[Preprint]. 2023 Dec 20:rs.3.rs-3694374.
doi: 10.21203/rs.3.rs-3694374/v1.

Meta-Prediction of Coronary Artery Disease Risk

Affiliations

Meta-Prediction of Coronary Artery Disease Risk

Ali Torkamani et al. Res Sq. .

Update in

  • Meta-prediction of coronary artery disease risk.
    Chen SF, Lee SE, Sadaei HJ, Park JB, Khattab A, Chen JF, Henegar C, Wineinger NE, Muse ED, Torkamani A. Chen SF, et al. Nat Med. 2025 Jul;31(7):2277-2288. doi: 10.1038/s41591-025-03648-0. Epub 2025 Apr 16. Nat Med. 2025. PMID: 40240837

Abstract

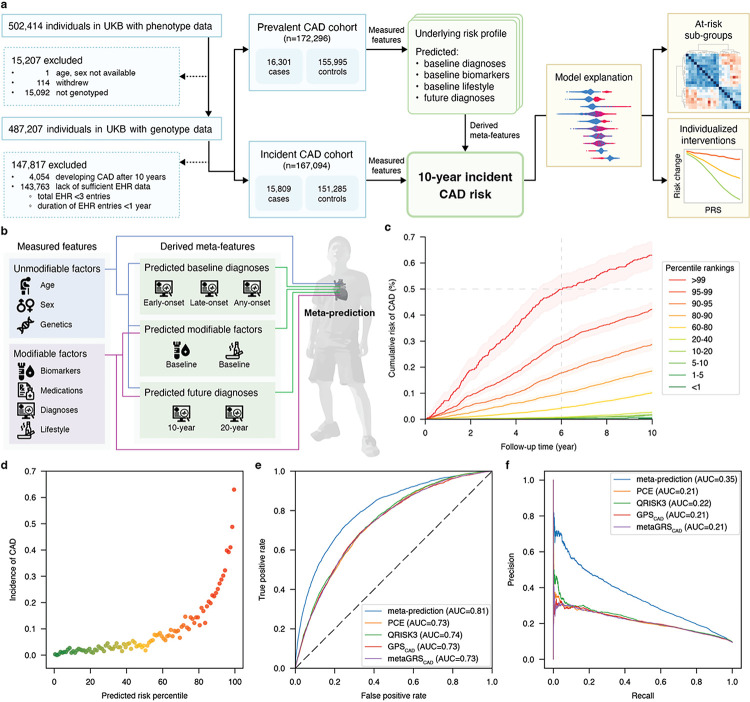
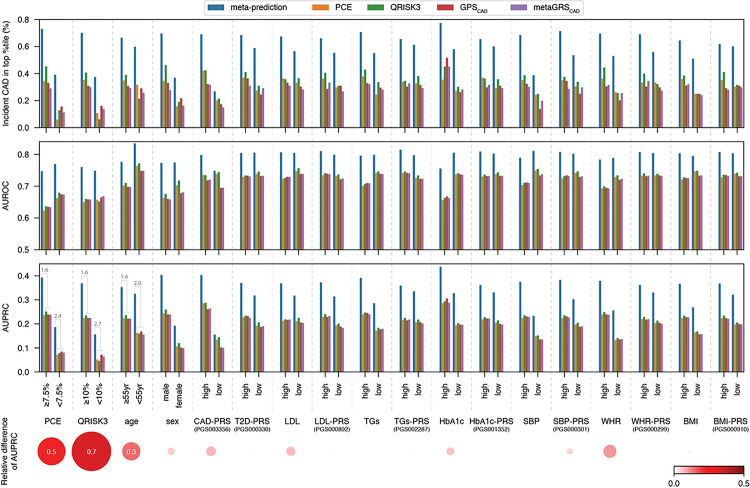
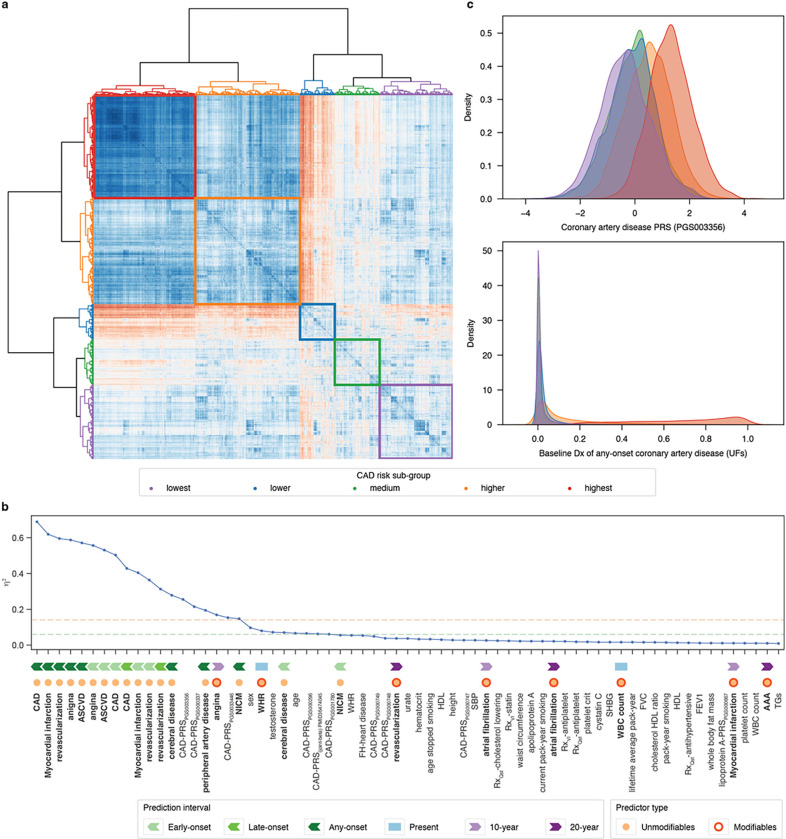
Coronary artery disease (CAD) remains the leading cause of mortality and morbidity worldwide. Recent advances in large-scale genome-wide association studies have highlighted the potential of genetic risk, captured as polygenic risk scores (PRS), in clinical prevention. However, the current clinical utility of PRS models is limited to identifying high-risk populations based on the top percentiles of genetic susceptibility. While some studies have attempted integrative prediction using genetic and non-genetic factors, many of these studies have been cross-sectional and focused solely on risk stratification. Our primary objective in this study was to integrate unmodifiable (age / genetics) and modifiable (clinical / biometric) risk factors into a prospective prediction framework which also produces actionable and personalized risk estimates for the purpose of CAD prevention in a heterogenous adult population. Thus, we present an integrative, omnigenic, meta-prediction framework that effectively captures CAD risk subgroups, primarily distinguished by degree and nature of genetic risk, with distinct risk reduction profiles predicted from standard clinical interventions. Initial model development considered ~ 2,000 predictive features, including demographic data, lifestyle factors, physical measurements, laboratory tests, medication usage, diagnoses, and genetics. To power our meta-prediction approach, we stratified the UK Biobank into two primary cohorts: 1) a prevalent CAD cohort used to train baseline and prospective predictive models for contributing risk factors and diagnoses, and 2) an incident CAD cohort used to train the final CAD incident risk prediction model. The resultant 10-year incident CAD risk model is composed of 35 derived meta-features from models trained on the prevalent risk cohort, most of which are predicted baseline diagnoses with multiple embedded PRSs. This model achieved an AUC of 0.81 and macro-averaged F1-score of 0.65, outperforming standard clinical scores and prior integrative models. We further demonstrate that individualized risk reduction profiles can be derived from this model, with genetic risk mediating the degree of risk reduction achieved by standard clinical interventions.

Keywords: Machine learning; cardiometabolic disease; cardiovascular disease; coronary artery disease; heart attack; integrative prediction; meta-prediction; myocardial infarction; omnigenic; polygenic; prospective prediction.


Figures

Figure 1
Figure 1. Overview of cohort construction, model development, performance assessment, and inference characterization for 10-year incident coronary artery disease (CAD) risk meta-prediction.
a. Depiction of primary case cohorts (16,301 prevalent cases with a CAD diagnosis at baseline and 15,809 incident cases developing CAD within 10-years after baseline) derived from the UK Biobank. Controls were filtered to exclude individuals with insufficient EHR data and/or follow-up. b. High-level overview of the 10-year CAD risk meta-prediction process, integrating unmodifiable and modifiable risk factors to make predictions about baseline diagnosis, baseline predicted risk factor values, and predicted future diagnoses, which are then all combined to make the final 10-year incident CAD risk meta-prediction. c. Cumulative risk curve of CAD (%) development over the 10-year follow-up period stratified by percentile of predicted risk. d. Incidence rates of CAD observed across the test cohort, stratified by percentile of predicted risk. e. and f. Comparative test accuracy (n = 33,419) for our meta-prediction model (AUROC = 0.81; AUPRC = 0.35) versus other standard clinical and research risk scores, including PCE (AUROC = 0.73; AUPRC = 0.21), QRISK3 (AUROC = 0.74; AUPRC = 0.22), GPSCAD (AUROC = 0.73; AUPRC = 0.21) and metaGRSCAD (AUROC = 0.73; AUPRC = 0.21). Abbreviations; AUC: Area under curve; CAD: coronary artery disease; EHR: electric health records; PCE: pool cohort equations; UKB: UK Biobank.
Figure 2
Figure 2. Comparative performance of meta-prediction stratified by standard risk factors.
Three-tiered bar charts detailing the meta-prediction’s performance when evaluated across sub-populations stratified by standard clinical risk factors. Model performance is compared with other standard clinical and research risk scores; PCE, QRISK3, GPSCAD, and metaGRSCAD. The upper bar charts display CAD incidence (%) in the top percentile, the middle bar charts show AUROC values, and the lower bar charts presents AUPRC values. The average fold change in AUPRC of meta-prediction vs other scores is annotated for the three factors showing the greatest advantage of meta-prediction over prior approaches (bottom left bar charts). The bubbles depict the relative difference of these AUPRC-fold change values within each risk factor strata, highlighting those strata where the fold-change in improved performance differs across sub-groups, identifying those risk factors where more than average improvements in performance are achieved for a sub-group. These sub-groups with the greatest gains in performance relative to prior methods include typically low-risk populations (low PCE, low QRISK3, or younger individuals). Abbreviations; BMI: body-mass index; CAD: coronary artery disease; PCE: pool cohort equations; SBP: systolic blood pressure; TGs: triglycerides; WHR: waist-hip ratio.
Figure 3
Figure 3. SHAP summary plot of the top 30 features in the meta-prediction framework.
This plot displays the top 30 of 60 total features contributing to meta-prediction. The vertical axis orders each feature by its overall importance to risk prediction. Each point represents a participant and is color-coded according to the feature’s direction of contribution to the individuals risk prediction (red increased risk, blue decreased risk). The value associated with each point on the x-axis represents the magnitude of its contribution to the individuals risk prediction. The sub-plots on the left and right provide SHAP plots for selected meta-features, top 3 meta-features on the left, and selected non-CAD future diagnoses on the right. Cerebral artery disease refers to cerebral and pre-cerebral disease other than stroke. Abbreviations; AAA: Abdominal aortic aneurysm: ASCVD: atherosclerotic cardiovascular disease; AF: atrial fibrillation; AID: auto immune disease; FH: family history; HCM: hypertrophic cardiomyopathy; HLR: high light scatter reticulocyte; MDD: major depressive disorder; NICM: nonischemic cardiomyopathy; PAR1: protease-activated receptor 1; PD: post duration; Qst: questionnaire response; VI: verbal interview; WBC: white blood cell.
Figure 4
Figure 4. Identification of CAD risk sub-groups and distinguishing features.
a. A heatmap illustrating the outcome of hierarchical clustering on the SHAP value correlation matrix for all predictors, demarcating five case subgroups in the incident CAD cohort. Each subgroup is assigned a color used in other panels respectively. b. A line chart highlighting 57 features with η2 values exceeding 0.01 among the five subgroups. Horizontal lines indicate thresholds for moderate (η2 ≥ 0.06) and large (η2 ≥ 0.14) effects. c. Visualization of the distribution of CAD-PRSPGS003356 and meta-feature (baseline diagnosis of any-onset CAD predicted by unmodifiable factors) within the 5 subgroups, color-matched to a. Abbreviation: AAA: Abdominal aortic aneurysm: ASCVD: atherosclerotic cardiovascular disease; FH: family history; FEV1: forced expiratory volume in 1st second; FVC: forced vital capacity; NICM: nonischemic cardiomyopathy; TGs: triglycerides Qst: questionnaire response; VI: verbal interview; WBC: white blood cell; WHR: waist-hip ratio.
Figure 5
Figure 5. Benefit of clinical interventions by genetic risk and risk sub-groups.
Upper panels (a-c) relate absolute risk reduction achieved with standard clinical interventions with degree of relevant genetic risk in at-risk individuals. Values are moving averages computed using a rolling window encompassing ±5 percentile bins, with error represented by SEM. Annotated values indicate the maximal benefit achieved per biomarker target: a. Absolute risk reduction achieved by LDL-lowering targets of 35, 55, 70, and 100 mg/dL vs standardized CAD-PRSPGS003356; b. Absolute risk-reduction achieved by HbA1c-lowering targets of 5.6% and 6%/ vs standardized T2D-PRSPGS000330; c. Absolute risk reduction achieved by SBP-lowering targets of 110 and 120 mmHg by standardized SBP-PRSPGS002257. Middle panels present the absolute risk reduction and lower panels present the relative risk change across risk sub-groups. Risk sub-groups are colored according to their assignments in Fig 4. d. Absolute risk reduction and g. relative risk reduction achieved by LDL lowering targets of 35, 55, 70 and 100 mg/dL. e. Absolute risk reduction and h. relative risk reduction achieved by HbA1c lowering targets of 5, 5.6, 6, 6.5 and 7%. f. Absolute risk reduction and i. relative risk reduction achieved by SBP lowering targets of 80, 90, 100, 110, 120, 130, 140, 150, and 160 mmHg. Each data point represents the median, with error bars representing the standard error.

References

    1. Muse E. D., Chen S. F. & Torkamani A. Monogenic and Polygenic Models of Coronary Artery Disease. Curr Cardiol Rep 23, 1–12 (2021). - PMC - PubMed
    1. Klarin D. & Natarajan P. Clinical utility of polygenic risk scores for coronary artery disease. Nat Rev Cardiol 19, 291–301 (2022). - PMC - PubMed
    1. Torkamani A., Wineinger N. E. & Topol E. J. The personal and clinical utility of polygenic risk scores. Nat Rev Genet 19, 581–590 (2018). - PubMed
    1. Damask A. et al. Patients with High Genome-Wide Polygenic Risk Scores for Coronary Artery Disease May Receive Greater Clinical Benefit from Alirocumab Treatment in the ODYSSEY OUTCOMES Trial. Circulation 624–636 (2020) doi:10.1161/CIRCULATIONAHA.119.044434. - DOI - PubMed
    1. Marston N. A. et al. Predicting Benefit from Evolocumab Therapy in Patients with Atherosclerotic Disease Using a Genetic Risk Score. Circulation 616–623 (2020) doi:10.1161/CIRCULATIONAHA.119.043805. - DOI - PMC - PubMed

Publication types

LinkOut - more resources