

This is a preprint.
Genetic and Survey Data Improves Performance of Machine Learning Model for Long COVID
- PMID: 38196610
- PMCID: PMC10775401
- DOI: 10.21203/rs.3.rs-3749510/v1
Genetic and Survey Data Improves Performance of Machine Learning Model for Long COVID
Abstract
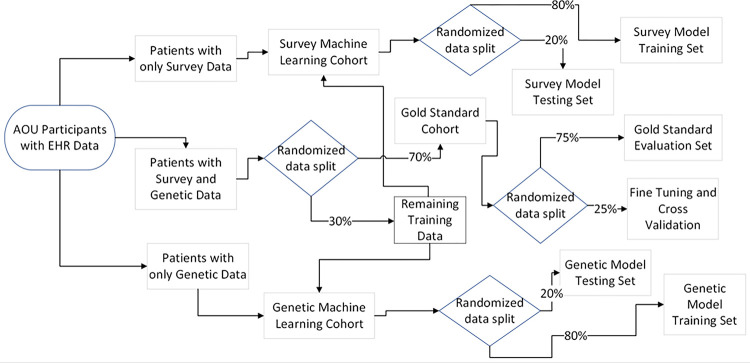
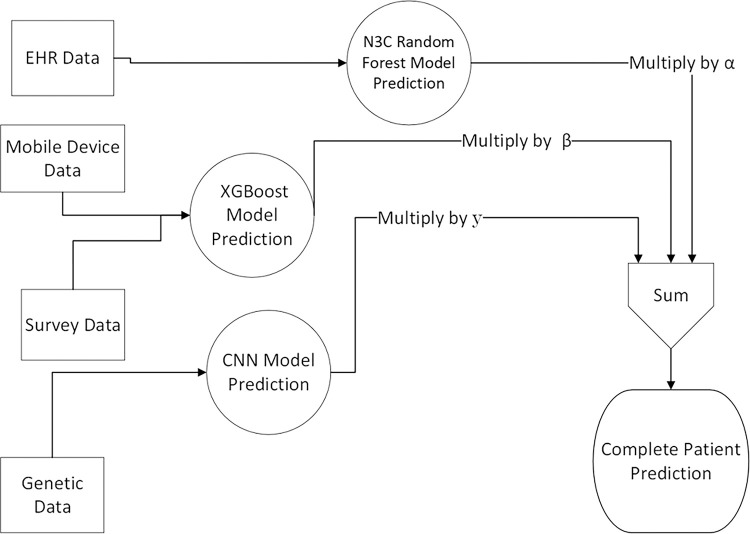
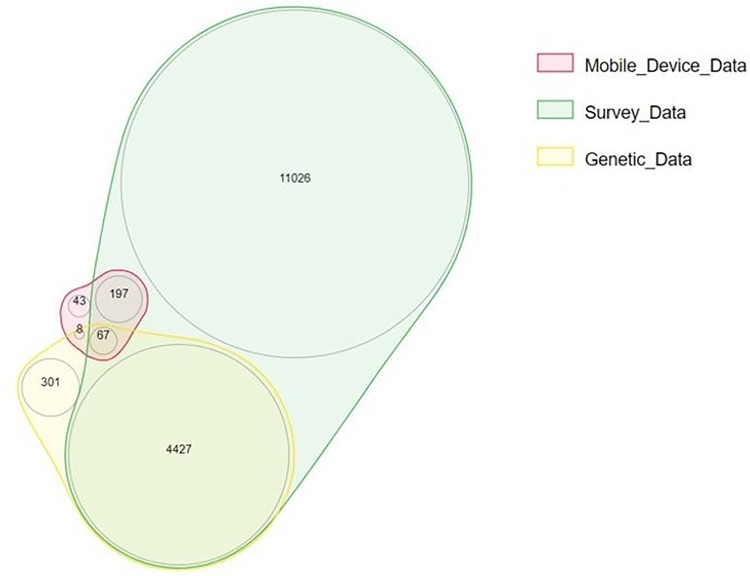
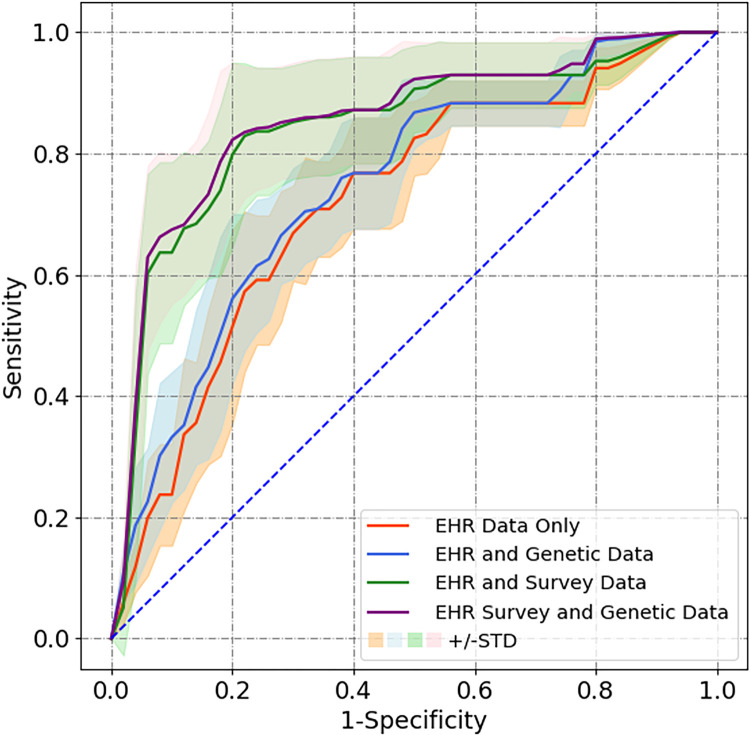
Over 200 million SARS-CoV-2 patients have or will develop persistent symptoms (long COVID). Given this pressing research priority, the National COVID Cohort Collaborative (N3C) developed a machine learning model using only electronic health record data to identify potential patients with long COVID. We hypothesized that additional data from health surveys, mobile devices, and genotypes could improve prediction ability. In a cohort of SARS-CoV-2 infected individuals (n=17,755) in the All of Us program, we applied and expanded upon the N3C long COVID prediction model, testing machine learning infrastructures, assessing model performance, and identifying factors that contributed most to the prediction models. For the survey/mobile device information and genetic data, extreme gradient boosting and a convolutional neural network delivered the best performance for predicting long COVID, respectively. Combined survey, genetic, and mobile data increased specificity and the Area Under Curve the Receiver Operating Characteristic score versus the original N3C model.
Conflict of interest statement
Declarations The authors declared no competing interests for this work.
Figures
Similar articles
-
Crowd-sourced machine learning prediction of long COVID using data from the National COVID Cohort Collaborative.EBioMedicine. 2024 Oct;108:105333. doi: 10.1016/j.ebiom.2024.105333. Epub 2024 Sep 24. EBioMedicine. 2024. PMID: 39321500 Free PMC article.
-
Tree-based classification model for Long-COVID infection prediction with age stratification using data from the National COVID Cohort Collaborative.JAMIA Open. 2024 Oct 9;7(4):ooae111. doi: 10.1093/jamiaopen/ooae111. eCollection 2024 Dec. JAMIA Open. 2024. PMID: 39524607 Free PMC article.
-
Machine Learning to Predict Mortality and Critical Events in a Cohort of Patients With COVID-19 in New York City: Model Development and Validation.J Med Internet Res. 2020 Nov 6;22(11):e24018. doi: 10.2196/24018. J Med Internet Res. 2020. PMID: 33027032 Free PMC article.
-
COVID-19 Mortality Prediction From Deep Learning in a Large Multistate Electronic Health Record and Laboratory Information System Data Set: Algorithm Development and Validation.J Med Internet Res. 2021 Sep 28;23(9):e30157. doi: 10.2196/30157. J Med Internet Res. 2021. PMID: 34449401 Free PMC article.
-
Recurrent neural network models (CovRNN) for predicting outcomes of patients with COVID-19 on admission to hospital: model development and validation using electronic health record data.Lancet Digit Health. 2022 Jun;4(6):e415-e425. doi: 10.1016/S2589-7500(22)00049-8. Epub 2022 Apr 21. Lancet Digit Health. 2022. PMID: 35466079 Free PMC article.
References
-
- WHO Coronavirus (COVID-19) Dashboard. https://covid19.who.int.
-
- Lammi V. et al. Genome-wide Association Study of Long COVID. 2023.06.29.23292056 Preprint at 10.1101/2023.06.29.23292056 (2023). - DOI
Publication types
Grants and funding
LinkOut - more resources
Full Text Sources
Miscellaneous
