[Preprint]. 2023 Dec 13:2023.09.28.559962.
doi: 10.1101/2023.09.28.559962.

Lysine-36 of Drosophila histone H3.3 supports adult longevity

Affiliations

Lysine-36 of Drosophila histone H3.3 supports adult longevity

John C Brown et al. bioRxiv. .

Update in

Abstract

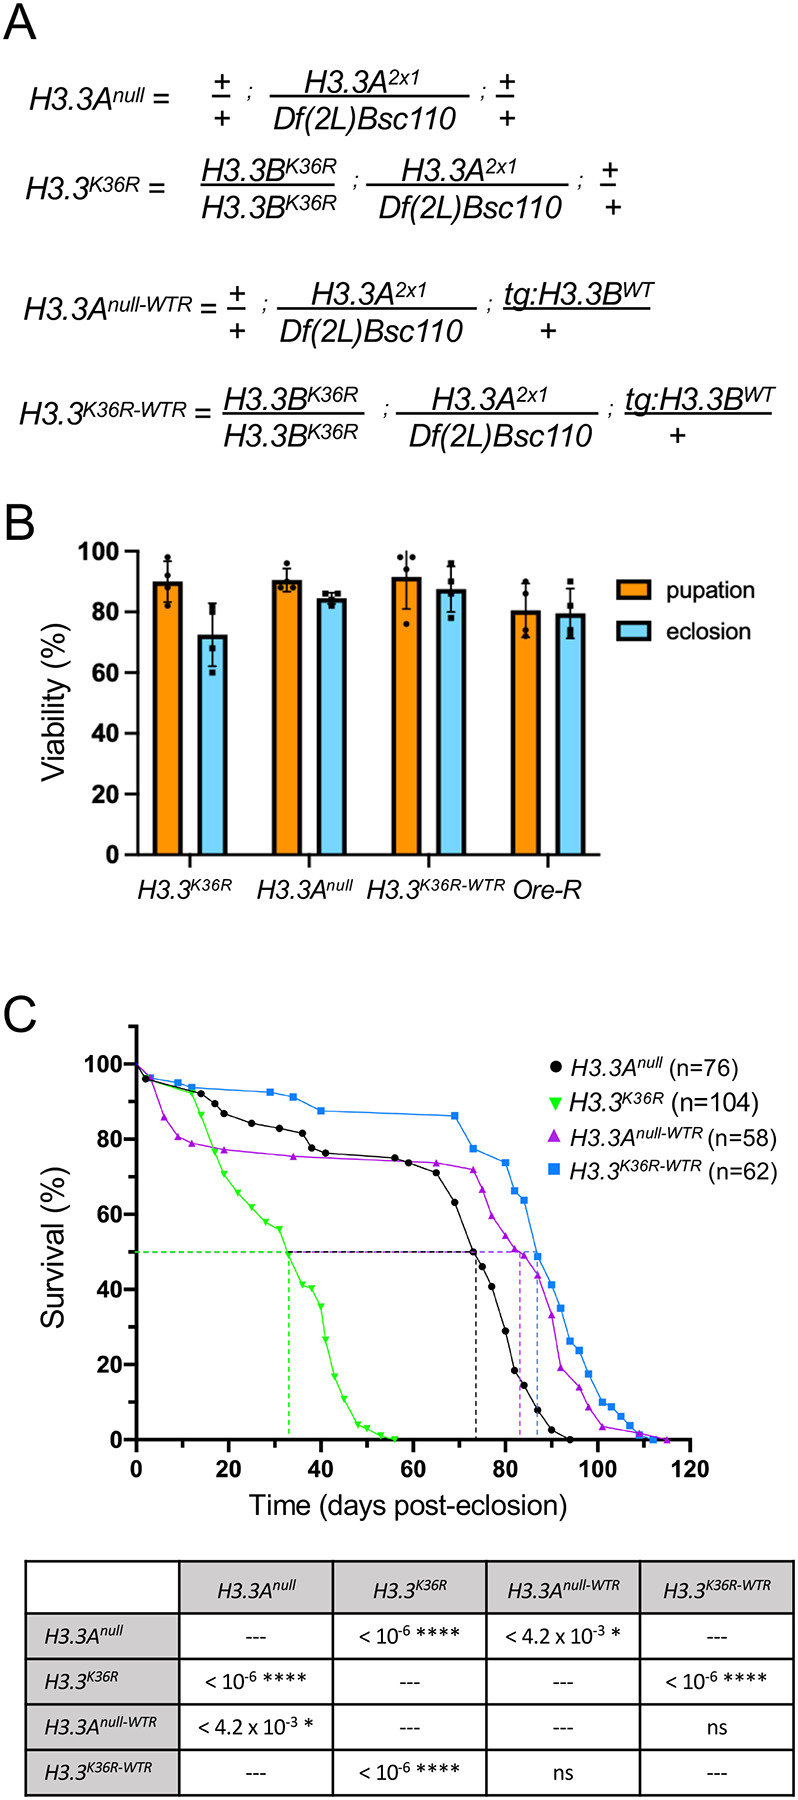
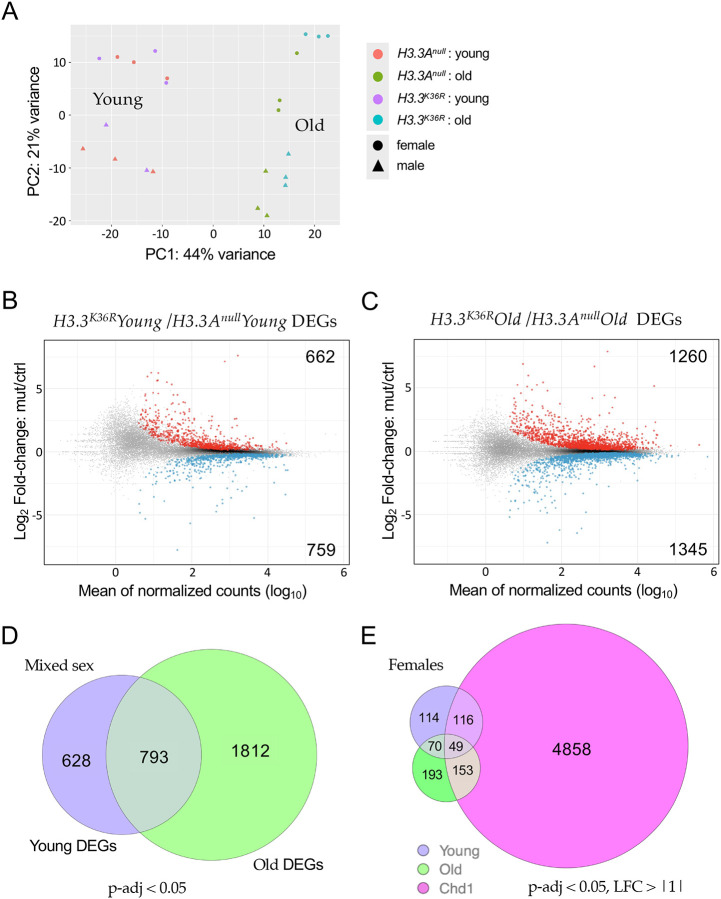
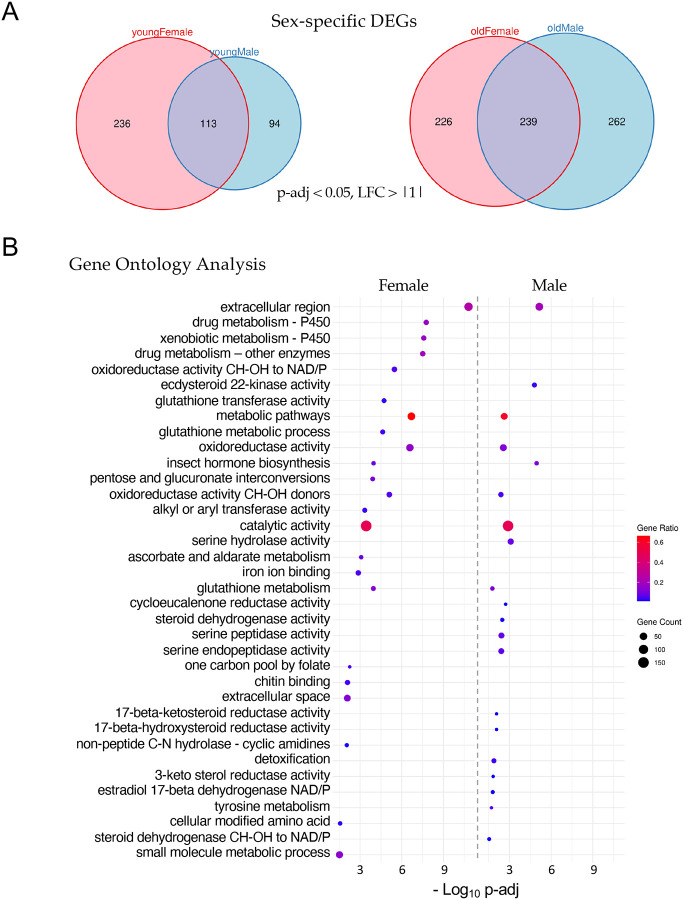
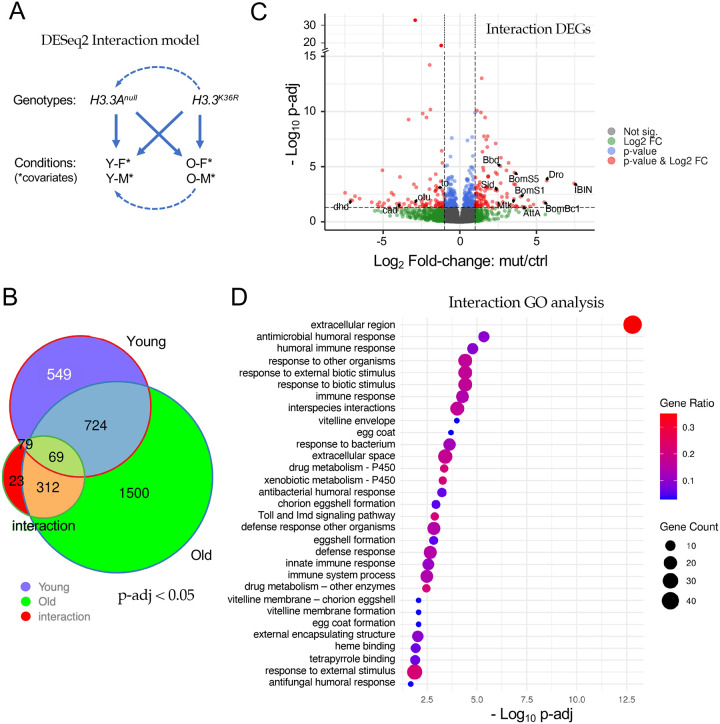
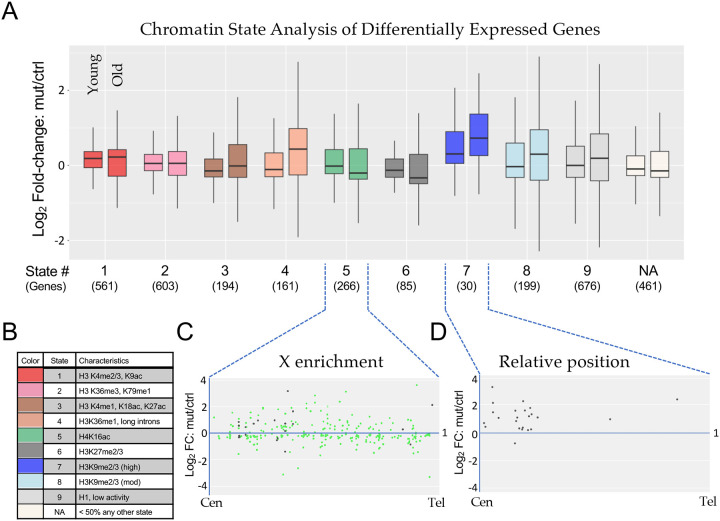
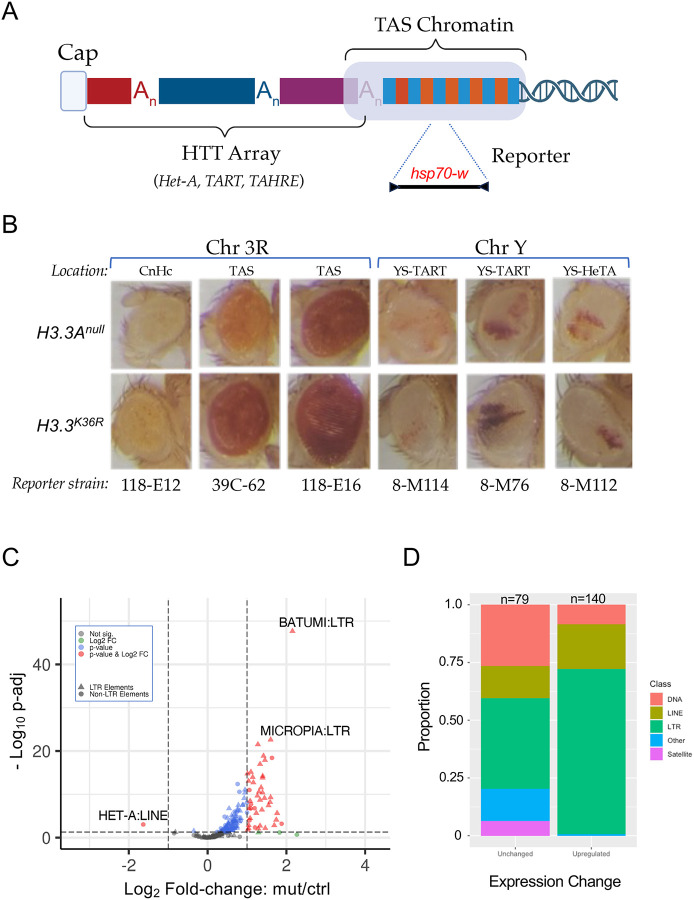
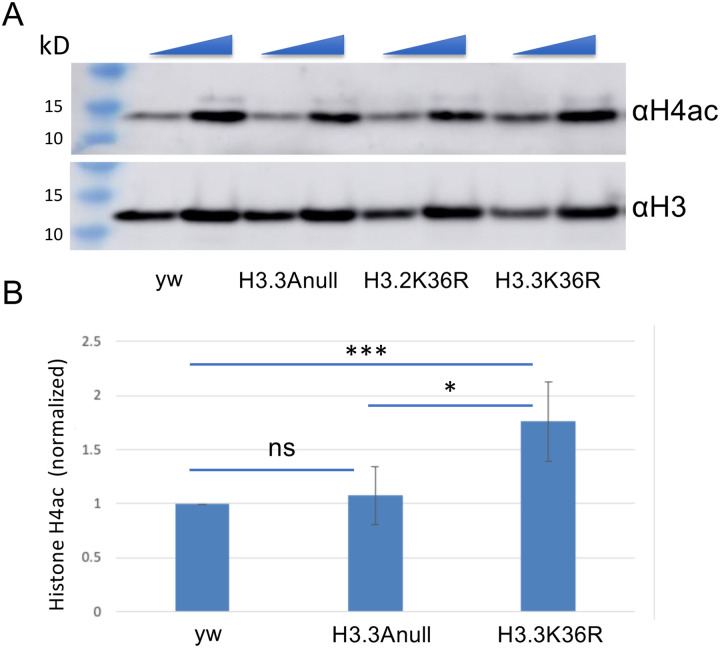
Aging is a multifactorial process that disturbs homeostasis, increases disease susceptibility, and ultimately results in death. Although the definitive set of molecular mechanisms responsible for aging remain to be discovered, epigenetic change over time is proving to be a promising piece of the puzzle. Several posttranslational histone modifications (PTMs) have been linked to the maintenance of longevity. Here, we focus on lysine-36 of the replication-independent histone protein, H3.3 (H3.3K36). To interrogate the role of this residue in Drosophila developmental gene regulation, we generated a lysine to arginine mutant that blocks the activity of its cognate modifying enzymes. We found that an H3.3BK36R mutation causes a significant reduction in adult lifespan, accompanied by dysregulation of the genomic and transcriptomic architecture. Transgenic co-expression of wild-type H3.3B completely rescues the longevity defect. Because H3.3 is known to accumulate in non-dividing tissues, we carried out transcriptome profiling of young vs aged adult fly heads. The data show that loss of H3.3K36 results in age-dependent misexpression of NF-κB and other innate immune target genes, as well as defects in silencing of heterochromatin. We propose H3.3K36 maintains the postmitotic epigenomic landscape, supporting longevity by regulating both pericentric and telomeric retrotransposons and by suppressing aberrant immune signaling.


Figures

Figure 1.
Figure 1.. H3.3K36R mutation reduces adult lifespan relative to H3.3Anull and wild-type rescue (WTR) controls.
(A) Detailed genotypes for H3.3Anull, H3.3K36R, H3.3Anull-WTR, and H3.3K36R-WTR animals. The notation tg:H3.3BWT corresponds to the rescue transgene. (B) Developmental viability assay. For each genotype, pupation and eclosion frequencies (%) were calculated and plotted (50 larvae per biological replicate vial). The mean and SD of these percentages are shown. Oregon-R (Ore-R) was used as an additional control. (C) Adult longevity assays for H3.3Anull and H3.3Anull-WTR controls, and for H3.3K36R and H3.3K36R-WTR flies. Median lifespan was determined (dotted lines) by identifying the day at which 50% of the animals survived. Statistical comparison of survival curves using Gehan-Breslow-Wilcoxon tests are presented in the accompanying table. A Bonferroni correction for multiple comparisons was employed, resulting in the following adjusted significance values: * p<0.0125, ** p<0.0025, *** p<2.5 × 10⁻⁴, ****p<2.5 × 10⁻⁵.
Figure 2.
Figure 2.. Transcriptomic profiling of young and old adult fly brains.
(A) Principle Component Analysis (PCA) of young (0–2 d post-eclosion) and old (21–25 d) H3.3Anull and H3.3K36R fly heads, labeled by sex. (B) M/A plot comparing gene expression from mixed sex H3.3K36R and H3.3Anull young fly heads. Red and blue dots represent differentially expressed genes (DEGs) that were significantly (adjusted p-value, p-adj < 0.05) up- or down-regulated, respectively. The number of DEGs in each direction is shown in the upper and lower corners. (C) M/A plot of mixed sex H3.3K36R vs. H3.3Anull transcripts from old adults. Labeling and significance as per panel B. (D) Venn diagram comparing overall number of DEGs (p-adj <0.05) between H3.3Anull and H3.3K36R genotypes, young and old mixed sex fly heads. (E) Venn diagram of DEGs (p-adj < 0.05 and Log2 Fold-change ≥ |1|) from female H3.3K36R (young or old) versus aged (20 d) female Chd1 fly heads. Data for Chd1 provided by [25].
Figure 3.
Figure 3.. Sex-specific analysis of significant differentially expressed genes.
(A) Venn diagrams of age- and sex-specific differentially expressed genes, DEGs (p-adj < 0.05 and, LFC > |1|) between H3.3K36R vs. H3.3Anull fly heads. Left diagram compares DEGs in young female with young male fly heads (0–2 d post-eclosion), and right diagram compares DEGs in old female with old male fly heads (21–25 d). (B) Gene Ontology (GO) analysis of the DEGs identified in panel A (old female and old male). The size of each dot is proportional to the number of genes contained within a given ontology term (gene count), and the fraction of those genes scoring significantly (gene ratio) is represented using a heatmap. Adjusted p-values (−Log10 transformed) for each GO term were calculated and plotted separately for both females and males.
Figure 4.
Figure 4.. Analysis of the interaction between age and genotype in old and young fly heads.
(A) Graphical representation of the DESeq2 model including interaction terms (design = sex + age + genotype + age:genotype). Solid arrows represent genotype:condition terms, dotted arrows illustrate how the model sets reference levels. (B) Venn diagram of differentially expressed genes (p-adj < 0.05) in young H3.3K36R vs. H3.3Anull (0–2 d post-eclosion) and old H3.3K36R vs. H3.3Anull fly heads (21–25 d), compared to those identified using the interaction model (age:genotype). (C) Volcano plot of RNA-seq data obtained using the interaction model. Dotted lines represent significance cutoffs for adjusted p-value and log2 fold-change. Dots represent individual genes, color coded according to the key at right. (D) Gene Ontology (GO) analysis of DEGs (padj < 0.05 and LFC > |1|) that were determined using the interaction model. Adjusted p-values (–Log10 transformed) for each GO term were calculated and plotted. The size of each dot is proportional to the number of genes contained within a given ontology term (gene count), and the fraction of those genes scoring significantly (gene ratio) is represented using a heatmap.
Figure 5.
Figure 5.. Chromatin state analysis of differentially expressed genes.
(A) The combined set of differentially expressed genes (adjusted p-value < 0.05) from the non-interaction DESeq2 model for both Young and Old conditions for H3.3K36R mutants relative to H3.3Anull controls was binned by predominant chromatin state [38]. Genes were binned to a given state if > 50% of the gene was marked by that state. The “NA” category was comprised of genes where no state color was > 50% of gene length (406 genes) or if chromatin states were undetermined when the original chromatin state study was published (55 genes). The mut/ctrl Log2 fold-change value for binned genes was plotted separately for Young and Old conditions. (B) A legend for colors corresponding to each chromatin state depicted in panel A, with representative histone marks for each state. (C and D) For genes in States 5 and 7, mut/ctrl Log2 fold-change values for the Old condition were plotted versus relative position along chromosome arms for all chromosomes, from centromere (Cen) to telomere (Tel). For State 5, the X chromosome genes are colored green, and autosomal genes, black.
Figure 6.
Figure 6.. Telomeric position effect and transposable element expression analysis.
(A) Cartoon depicting key features of Drosophila telomeres. At the distal end of the telomere, a capping complex assembles adjacent to arrays of Het-A, TAHRE, and TART retrotransposons (HTT array). Proximal to that is the TAS (Telomere Associated Sequence) Chromatin, which is characterized by the presence of complex satellite repeats that vary by chromosome. (B) Images of adult eyes. For each column, representative examples are shown for a particular reporter strain. Rows correspond to genotype (H3.3Anull control or H3.3K36R mutant). The location and type of chromatin for each reporter strain is also indicated: Pericentric heterochromatin (CnHc), Telomere Associated Sequences (TAS), YS-TART (Y chromosome TART), and YS-HeTA (Y chromosome HeT-A). n-values for each experiment ranged from 16 to 44, see Fig. S5 for details. (C) Volcano plot of annotated transposable elements (TEs) analyzed using the TEcounts tool within TEtranscripts. Each dot or triangle represents the combined reads from all loci for a given TE subtype. Dotted lines represent significance cutoffs for adjusted p-value and Log2 fold-change. Symbols are color coded according to the key in the upper left. LTR-type transposons are represented by triangles, non-LTR elements are shown as dots. (D) Stacked bar graph, binned by whether TEs were upregulated or unchanged in the H3.3K36R mutant. The relative proportion of a given type of transposable element (DNA, LINE, LTR, Satellite, and Other) in each bin are shaded as indicated in the legend.
Figure 7.
Figure 7.. Hyperacetlyation of histone H4 in H3.3K36R mutants.
Western blotting for pan H4 acetylation (H4ac) and anti-H3 on lysates from WL3 larvae. (A) Representative gel image. yw and H3.3Anull controls are shown along with H3.3K36R mutants. The H3.2K36R lanes are provided for visual comparison but are not quantified (see Methods for details). As indicated by the triangles at the top edge for each pair of lanes per genotype, either 20 or 40 ug of total protein per lane was loaded. (B) Quantification of the data from three independent replicates. Mean pixel intensity for each band was measured, and ratio of H4ac/H3 was computed per replicate. For each experiment, the H4ac/H3 ratio of mutant genotypes was normalized to the H3.3Anull control. For each genotype, normalized means and SD were plotted. Significance between raw H3K27me3/H3 ratios was assessed by paired one-way ANOVA, followed by Friedman tests comparing mutant genotypes to H3.3Anull controls. P values are indicated as follows: *** < 0.001; * < 0.05; ns = not significant.

Similar articles

References

    1. Bell O, Tiwari VK, Thoma NH, Schubeler D. Determinants and dynamics of genome accessibility. Nat Rev Genet. 2011;12(8):554–64. Epub 2011/07/13. doi: 10.1038/nrg3017. - DOI - PubMed
    1. Lorch Y, LaPointe JW, Kornberg RD. Nucleosomes inhibit the initiation of transcription but allow chain elongation with the displacement of histones. Cell. 1987;49(2):203–10. Epub 1987/04/24. doi: 10.1016/0092-8674(87)90561-7. - DOI - PubMed
    1. Ransom M, Dennehey BK, Tyler JK. Chaperoning histones during DNA replication and repair. Cell. 2010;140(2):183–95. Epub 2010/02/10. doi: 10.1016/j.cell.2010.01.004. - DOI - PMC - PubMed
    1. Bannister AJ, Kouzarides T. Regulation of chromatin by histone modifications. Cell Res. 2011;21(3):381–95. Epub 2011/02/16. doi: 10.1038/cr.2011.22. - DOI - PMC - PubMed
    1. Clapier CR, Iwasa J, Cairns BR, Peterson CL. Mechanisms of action and regulation of ATP-dependent chromatin-remodelling complexes. Nat Rev Mol Cell Biol. 2017;18(7):407–22. Epub 2017/05/18. doi: 10.1038/nrm.2017.26. - DOI - PMC - PubMed

Publication types