[Preprint]. 2023 Dec 18:rs.3.rs-3676579.
doi: 10.21203/rs.3.rs-3676579/v1.

Unagi: Deep Generative Model for Deciphering Cellular Dynamics and In-Silico Drug Discovery in Complex Diseases

Affiliations

Unagi: Deep Generative Model for Deciphering Cellular Dynamics and In-Silico Drug Discovery in Complex Diseases

Yumin Zheng et al. Res Sq. .

Update in

Abstract

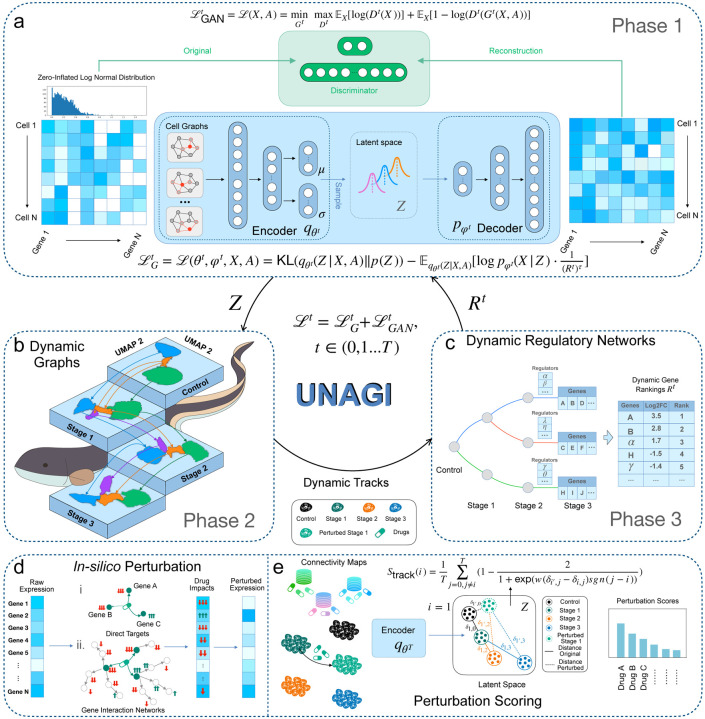
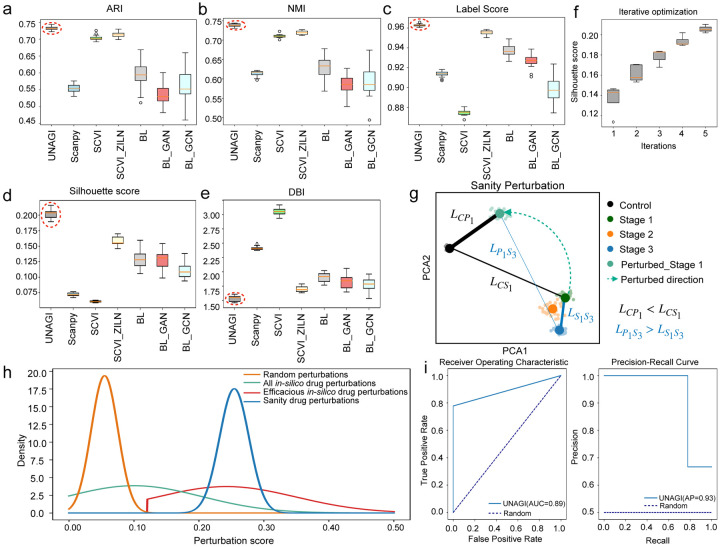
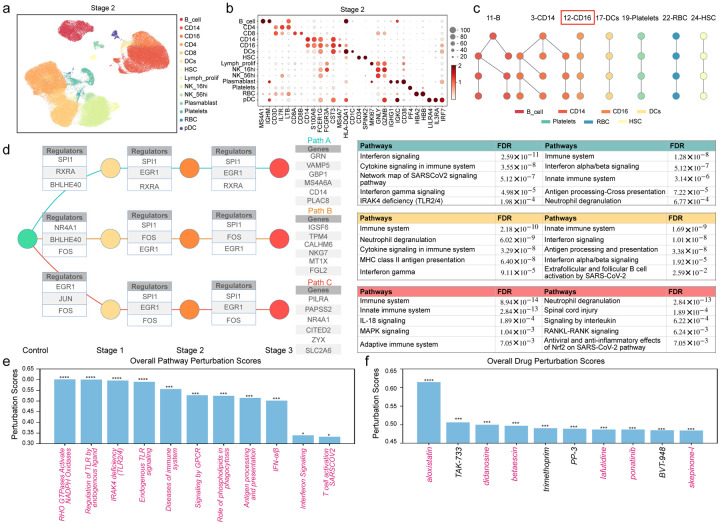
Human diseases are characterized by intricate cellular dynamics. Single-cell sequencing provides critical insights, yet a persistent gap remains in computational tools for detailed disease progression analysis and targeted in-silico drug interventions. Here, we introduce UNAGI, a deep generative neural network tailored to analyze time-series single-cell transcriptomic data. This tool captures the complex cellular dynamics underlying disease progression, enhancing drug perturbation modeling and discovery. When applied to a dataset from patients with Idiopathic Pulmonary Fibrosis (IPF), UNAGI learns disease-informed cell embeddings that sharpen our understanding of disease progression, leading to the identification of potential therapeutic drug candidates. Validation via proteomics reveals the accuracy of UNAGI's cellular dynamics analyses, and the use of the Fibrotic Cocktail treated human Precision-cut Lung Slices confirms UNAGI's predictions that Nifedipine, an antihypertensive drug, may have antifibrotic effects on human tissues. UNAGI's versatility extends to other diseases, including a COVID dataset, demonstrating adaptability and confirming its broader applicability in decoding complex cellular dynamics beyond IPF, amplifying its utility in the quest for therapeutic solutions across diverse pathological landscapes.


Conflict of interest statement

NK is a scientific founder at Thyron, served as a consultant to Boehringer Ingelheim, Pliant, Astra Zeneca, RohBar, Veracyte, Augmanity, CSL Behring, Splisense, Galapagos, Fibrogen, GSK, Merck and Thyron over the last 3 years, reports Equity in Pliant and Thyron, and grants from Veracyte, Boehringer Ingelheim, BMS and non-financial support from Astra Zeneca.

Figures

Fig. 1 |
Fig. 1 |. UNAGI overview: resolving cellular dynamics of complex disease & potential therapeutics through single-cell embeddings.
a, Phase 1: UNAGI employs a VAE-GAN paired with a graph convolution layer. This setup harnesses the complexities of single-cell data, producing a ‘Z’ latent space that bridges encoding and decoding with minimal error. b, Phase 2: Derived from the ‘Z’ embeddings, a temporal dynamics graph emerges. Here, the Leiden clustering method discerns cell populations, subsequently connecting them across stages based on their inherent similarity. c, Phase 3: The iDREM tool comes into play, spotlighting key gene regulators and genes that influence disease progression. These insights are channeled into an iterative model training, honing in on specific gene markers of the disease. d, With the model in place, UNAGI initiates in-silico perturbations, either directly tweaking drug target gene expressions (i) or manipulating gene expressions via established gene interaction networks (ii) to simulate drug treatment impact. e, UNAGI’s encoder processes the perturbed cell population alongside its peers. The perturbation scores, derived from the ‘Z’ space embeddings generated by the UNAGI encoder, assist in identifying potential drug candidates. These candidates are evaluated based on their ability to transition diseased cells towards healthier states, such as those resembling healthy control cells, thereby contributing to the treatment of the disease.
Fig. 2 |
Fig. 2 |. UNAGI identifies progressive heterogenous cell populations across IPF stages.
a, UMAP visualization: Mesenchymal cells across various IPF stages are depicted. Each point corresponds to a cell; the first column categorizes them by cell type (e.g., SMC = smooth muscle cell, VE = vascular endothelial), and the second by Leiden cluster IDs. This panel underscores UNAGI’s ability to learn a potent cell embedding, ensuring premium cell clustering. b, Gene dot plots: Dot plots illustrating the key biomarkers for each identified cell type across four stages of IPF. In these plots, the size of each circle indicates the proportion of cells expressing the gene, and the circle’s color reflects the level of normalized gene expression. c, Cell composition chart: A visualization of the shifts in cell type composition along with IPF disease progression. Colors indicate the specific cell type. Notably, there’s a discernible expansion of fibroblast cells as the disease progresses.
Fig. 3 |
Fig. 3 |. UNAGI reconstructs the temporal dynamics and the underlying gene regulatory networks of cellular dynamics during IPF progression.
a, Dynamics graph of IPF progression within the mesenchymal cell lineage, comprising four IPF stages. Each node symbolizes a cell population, colored according to cell type, and the edges between two nodes depict the progression trajectory across disease stages. Trajectories, spanning from Control to Stage 3, are termed progression tracks. Each track is named with the specific cell type and the corresponding Control cluster-ID. b, Gene regulatory networks for the FibAlv-4 track, were reconstructed using the iDREM tool. Individual nodes signify a set of genes, and edges connecting two nodes represent gene regulators regulating expression changes. Paths encompassing nodes from Control to Stage 3 depict a consistent set of genes displaying the same expression changes throughout IPF progression. The enriched pathways associated with gene paths were also provided. c, the temporal regulatory networks for the FibAdv-17 track. d, Line chart of expression of the top dynamic gene candidates on the FibAlv-4 and FibAdv-17 tracks, the top 10 most increasing and the top 10 most decreasing candidate marker genes through the IPF progression.
Fig. 4 |
Fig. 4 |. UNAGI comprehensively captures novel dynamical and hierarchical static markers across various IPF stages.
a, Heatmaps presenting the most pronounced increasing (left) and decreasing (right) temporal dynamic markers’ expressions, each z-score normalized, across tracks. b, The left panel showcases heatmaps of dynamic gene markers from the FibAlv-4 cluster. Importantly, the right panel provides experimental verification of these markers through corresponding protein expressions derived from proteomics data. Line plots accompanying these highlight gene expression shifts of these dynamic markers over the course of IPF progression. c, Dendrogram visualizing control cell populations. Each node signifies a cell type-specific population. The Fibroblast Adventitial cluster is accentuated. Using UNAGI, various hierarchical biomarkers are discernible at different levels, either contrasting with other cell types or juxtaposing subpopulations within the same cell type. d, Heatmap detailing the top 25 hierarchical static markers’ expressions, all z-score normalized, for the Fibroblast Adventitial cluster at level 0. This highlights UNAGI’s proficiency in pinpointing general cell type markers. e, Heatmap delineating the top 25 hierarchical marker gene expressions, z-score normalized, for the Fibroblast Adventitial cluster at level 4, set against two Fibroblast Alveolar clusters, emphasizing UNAGI’s capability in cell subtype marker identification.
Fig. 5 |
Fig. 5 |. UNAGI identifies potential therapeutic pathways and potent drugs for IPF treatments.
a, Bar chart of the track FibAlv-4 pathway perturbation results. The highlighted pathways are also identified in the reconstructed gene regulatory network of the track. b, Split-violin plot of the gene expression differences for the top 20 most changing genes of in-silico extracellular matrix (ECM) organization pathway perturbation in Stage 1 of the FibAlv-4 track. c, PCA plots of latent space Z of in-silico ECM organization pathway perturbation effects and dots represent cells from distinct stages. Lines connected to two nodes are the PAGA connectivity score between two clusters, where the width of a line is proportional to the strength of the score, and the length of the line can represent the distance between the UNAGI embeddings of the two connected clusters. (e.g., Line connecting Control and Perturbed Stage 1 (LCP1)). d, Bar chart of the top overall drug perturbation results. e, Split-violin plot of gene expressions for the top 10 changing targets of Nintedanib in the gene interactions network both before and after perturbation in Stage 1 of the FibAlv-4 track. f, PCA plots of Nintedanib perturbation effectiveness.
Fig. 6 |
Fig. 6 |. UNAGI outperforms alternative approaches in learning the cell embeddings and can effectively identify efficacious drugs in in-silico perturbations.
a, Adjusted Rand Index (ARI) and b, Normalized Mutual Information (NMI) illustrate the effectiveness of the learned cell embeddings for downstream clustering tasks. c, Label score, indicating that cells within neighborhoods primarily have the same cell type. d, Silhouette score. e, Davis-Bouldin index (DBI); a lower DBI signifies better clustering. These scores (c, d, e) are unsupervised metrics employed to demonstrate the clustering quality derived from the learned cell embeddings. f, Box plot presenting the silhouette scores of UNAGI across various training iterations, emphasizing that the iterative strategy progressively enhances cell embeddings and clustering quality with each iteration. g, PCA representation highlighting the impact of sanitary perturbation, which involves reversing the gene expression at Stage 1 back to the patterns observed in the control stage. This process essentially seeks to “normalize” or “sanitize” the aberrant gene expressions, bringing them in line with a control or reference state. h, Distribution patterns for various drug/compound perturbations. The x-axis represents the perturbation score, while the y-axis portrays the density of the fitted Gaussian distribution for each specific setting. i, AUROC and AUPRC metrics in relation to perturbation verification. As a reference, a random drug effectiveness predictor is used as a baseline, with an AUC (Area Under the Curve) score of 0.5, indicating no predictive discrimination, and an average precision (AP) score of 0.5, representing a baseline precision level.
Fig. 7 |
Fig. 7 |. The predictions of UNAGI align with human precision-cut lung slices (PCLS) drug validations.
a, UMAP visualization of the PCLS data with each dot representing an individual cell. b, UMAP representation emphasizing the similarity between the real-world treatments of Nifedipine and Nintedanib. Furthermore, cells under in-silico drug treatments (Nifedipine and Nintedanib) closely mirror those under actual treatments. c, Violin plots showcasing that Nintedanib and Nifedipine treatments markedly shift fibrotic cells, bringing them closer in resemblance to healthy control cells. (e.g., Dz(Fibrosis, Nifedipine) is the distance between fibrosis cells and fibrosis cells after Nifedipine treatment). d, Violin plots highlighting the strong alignment between in-silico drug treatments and their real-world counterparts. e, The RRHO (Ranked Rank Hypergeometric Overlap) plots for both Nifedipine and Nintedanib. These plots juxtapose in-silico perturbations post-VAE reconstruction against actual treatments, emphasizing the high degree of similarity between in-silico and real treatments. Specifically, the genes up-regulated and down-regulated in in-silico treatments show strong correlations with those affected in real treatments. f, Box plots and R2 plots compare the expression of the top differential genes of real treatments (Nintedanib or Nifedipine vs. fibrosis) to in-silico perturbation results. The box plot visualizes the top 25 differential genes (ranked based on log fold changes) for each treatment. The gene expression of the top 100 differential genes in real and in-silico drug treatments are used to calculate the adjusted R2 metric and generate R2 plots. This representation is intended to underline the remarkable similarity observed between in-silico drug perturbations and the corresponding actual drug treatments for both Nifedipine and Nintedanib. g, Box plots and R2 plots of ECM organization target gene expressions from real treatments and in-silico perturbations. The box plots visualize the top 15 genes of ECM based on log fold changes between real treatments and fibrosis cells. The gene expressions of all ECM organization target genes in real and in-silico drug treatments are used to calculate the adjusted R2 metric and generate R2 plots.
Fig. 8 |
Fig. 8 |. UNAGI in-silico analysis unveils COVID-19 cellular dynamics and therapeutic opportunities.
a, UMAP display of stage 2 COVID-19 data with each dot symbolizing an individual cell. Cells are color-coded based on their respective cell types. b, Dot plot illustrating the expression levels of canonical cell type markers present within the stage 2 COVID-19 data set. c, Dynamic graphs representing the cellular dynamics underlying the COVID-19 progression. Within these graphs, each node corresponds to a cell cluster, and the connecting edges signify the relationships between these nodes (shift of the cell population along with COVID-19 progression). d, Depiction of the reconstructed gene regulatory network for the track 12-CD16. Prominent gene regulators, genes, and pathways discerned from the enrichment analysis are enumerated. e, Bar chart detailing the principal pathway perturbation outcomes. Pathways highlighted have literature support, indicating their potential as therapeutic targets against COVID-19. f, Bar chart outlining the top 10 drug perturbation results. Drugs that are emphasized have been highlighted based on literature support, suggesting their candidacy for treating COVID-19.

References

    1. Mitchell K. J. What is complex about complex disorders? Genome Biol. 13, 237 (2012). - PMC - PubMed
    1. Schork N. J. Genetics of Complex Disease: Approaches, Problems, and Solutions. Am. J. Respir. Crit. Care Med. 156, S103–S109 (1997). - PubMed
    1. Ramsay R. R., Popovic‐Nikolic M. R., Nikolic K., Uliassi E. & Bolognesi M. L. A perspective on multi-target drug discovery and design for complex diseases. Clin. Transl. Med. 7, (2018). - PMC - PubMed
    1. Iyengar R. Complex diseases require complex therapies. EMBO Rep. 14, 1039–1042 (2013). - PMC - PubMed
    1. Dickson M. & Gagnon J. P. Key factors in the rising cost of new drug discovery and development. Nat. Rev. Drug Discov. 3, 417–429 (2004). - PubMed

Publication types

LinkOut - more resources