[Preprint]. 2023 Dec 24:2023.12.22.23300365.
doi: 10.1101/2023.12.22.23300365.

Genome-wide QTL mapping across three tissues highlights several Alzheimer's and Parkinson's disease loci potentially acting via DNA methylation

Affiliations

Genome-wide QTL mapping across three tissues highlights several Alzheimer's and Parkinson's disease loci potentially acting via DNA methylation

Olena Ohlei et al. medRxiv. .

Abstract

DNA methylation (DNAm) is an epigenetic mark with essential roles in disease development and predisposition. Here, we created genome-wide maps of methylation quantitative trait loci (meQTL) in three peripheral tissues and used Mendelian randomization (MR) analyses to assess the potential causal relationships between DNAm and risk for two common neurodegenerative disorders, i.e. Alzheimer's disease (AD) and Parkinson's disease (PD). Genome-wide single nucleotide polymorphism (SNP; ~5.5M sites) and DNAm (~850K CpG sites) data were generated from whole blood (n=1,058), buccal (n=1,527) and saliva (n=837) specimens. We identified between 11 and 15 million genome-wide significant (p<10-14) SNP-CpG associations in each tissue. Combining these meQTL GWAS results with recent AD/PD GWAS summary statistics by MR strongly suggests that the previously described associations between PSMC3, PICALM, and TSPAN14 and AD may be founded on differential DNAm in or near these genes. In addition, there is strong, albeit less unequivocal, support for causal links between DNAm at PRDM7 in AD as well as at KANSL1/MAPT in AD and PD. Our study adds valuable insights on AD/PD pathogenesis by combining two high-resolution "omics" domains, and the meQTL data shared along with this publication will allow like-minded analyses in other diseases.

Keywords: Alzheimer’s disease (AD); Genome-wide association study (GWAS); Mendelian randomization (MR); Parkinson’s disease (PD); colocalization; methylation quantitative trait locus (meQTL) analysis.


Conflict of interest statement

Competing interests D.B.F. serves on the scientific advisory board of Linus Health. A.P.L. serves on the scientific advisory boards for Neuroelectrics, Magstim Inc., TetraNeuron, Skin2Neuron, MedRhythms, and Hearts Radiant. He is co-founder of TI solutions and co-founder and chief medical officer of Linus Health. Furthermore, A.P.L. is listed as an inventor on several issued and pending patents on the real-time integration of transcranial magnetic stimulation with electroencephalography and magnetic resonance imaging, and applications of noninvasive brain stimulation in various neurological disorders; as well as digital biomarkers of cognition and digital assessments for early diagnosis of dementia. The remaining authors declare no competing interests.

Figures

Figure 1.
Figure 1.
Flowchart of meQTL study design and analysis strategies applied in this work. More details on the SMR/MR analyses can be found in Supplementary Figure S6.
Figure 2.
Figure 2.
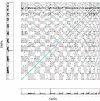
Chessboard plots for study-wide significant SNP-CpG associations results in all three tissue types analyzed here: blood, buccal mucosa and saliva. A. SNP-CpG pairwise associations in blood dataset (i.e. BASE-II; n=1,058). B. SNP-CpG pairwise associations in available buccal datasets (i.e. BASE-II, LCBC and BBHI; n=1,527). C. SNP-CpG pairwise associations in saliva dataset (i.e. LCBC; n=837). Each dot represents a SNP-CpG pair that has exceeded the study-wide significance level (P<10−14; Methods). CpG positions are shown on the x-axis, and SNP positions are shown on the y-axis. CpG position and CpG density (#CpGs/Mb) are provided on the x axis, while SNP position and SNP density (#CpGs/Mb) are provided on the y axis. SNP-CpG pairs are coded according to their genomic distance: cis = for pairs within 1 Mb (green markers; appear as a diagonal line); long-range cis = for pairs on the same chromosome but >1Mb apart (purple markers); trans = for pairs located on different chromosomes (black markers).
Figure 2.
Figure 2.
Chessboard plots for study-wide significant SNP-CpG associations results in all three tissue types analyzed here: blood, buccal mucosa and saliva. A. SNP-CpG pairwise associations in blood dataset (i.e. BASE-II; n=1,058). B. SNP-CpG pairwise associations in available buccal datasets (i.e. BASE-II, LCBC and BBHI; n=1,527). C. SNP-CpG pairwise associations in saliva dataset (i.e. LCBC; n=837). Each dot represents a SNP-CpG pair that has exceeded the study-wide significance level (P<10−14; Methods). CpG positions are shown on the x-axis, and SNP positions are shown on the y-axis. CpG position and CpG density (#CpGs/Mb) are provided on the x axis, while SNP position and SNP density (#CpGs/Mb) are provided on the y axis. SNP-CpG pairs are coded according to their genomic distance: cis = for pairs within 1 Mb (green markers; appear as a diagonal line); long-range cis = for pairs on the same chromosome but >1Mb apart (purple markers); trans = for pairs located on different chromosomes (black markers).
Figure 3.
Figure 3.
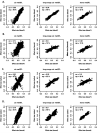
Correspondence of effect sizes from SNP-CpG pairs identified by meQTL analysis. A-C: Results from Hawe et al. (blood*) compared to blood from this study (A), buccal (B) and saliva (C). D: Effect sizes of meQTL analysis in buccal tissue compared to saliva specimens using data generated in this study.
Figure 4.
Figure 4.
Manhattan plots of trans acting SNP-CpG associations in A. blood (i.e. BASE-II; n=1058), B. buccal mucosa (i.e. BASE-II, LCBC and BBHI; n=1527), and C. saliva (i.e. LCBC; n=837) dataset. Each dot represents a SNP marker. Genomic location of SNPs is on the X-axis, the number of CpG sites associated in trans with each SNP are on the Y-axis. Red dots indicate the top 1% SNPs across all detected trans associations. Gene names are provided for regions of the top 1% SNPs. SNPs are annotated to most frequent meQTL genes in +/−10 Mb region and in 1% all top SNPs. When two genes are equally frequent, we chose the gene previously reported in Hawe at al., when present.
Figure 4.
Figure 4.
Manhattan plots of trans acting SNP-CpG associations in A. blood (i.e. BASE-II; n=1058), B. buccal mucosa (i.e. BASE-II, LCBC and BBHI; n=1527), and C. saliva (i.e. LCBC; n=837) dataset. Each dot represents a SNP marker. Genomic location of SNPs is on the X-axis, the number of CpG sites associated in trans with each SNP are on the Y-axis. Red dots indicate the top 1% SNPs across all detected trans associations. Gene names are provided for regions of the top 1% SNPs. SNPs are annotated to most frequent meQTL genes in +/−10 Mb region and in 1% all top SNPs. When two genes are equally frequent, we chose the gene previously reported in Hawe at al., when present.
Figure 5.
Figure 5.
Example MR analysis using four models estimated causal link to cg20307385 in PSMC3 in AD using independent instrumental variables (SNPs) at A. r2<0.1., and B. r2<0.01. Effect sizes and p-values corresponding to these analyses are depicted in Supplementary Table S15.
Figure 5.
Figure 5.
Example MR analysis using four models estimated causal link to cg20307385 in PSMC3 in AD using independent instrumental variables (SNPs) at A. r2<0.1., and B. r2<0.01. Effect sizes and p-values corresponding to these analyses are depicted in Supplementary Table S15.

References

    1. Bellenguez C. et al. New insights into the genetic etiology of Alzheimer’s disease and related dementias. Nat. Genet. 2022 544 54, 412–436 (2022). - PMC - PubMed
    1. Nalls M. A. et al. Identification of novel risk loci, causal insights, and heritable risk for Parkinson’s disease: a meta-analysis of genome-wide association studies. Lancet Neurol. 18, 1091–1102 (2019). - PMC - PubMed
    1. Finch C. E. & Kulminski A. M. The Alzheimer’s Disease Exposome. Alzheimer’s Dement. 15, 1123–1132 (2019). - PMC - PubMed
    1. Heilbron K. et al. Unhealthy Behaviours and Risk of Parkinson’s Disease: A Mendelian Randomisation Study. J. Parkinsons. Dis. 11, 1981 (2021). - PMC - PubMed
    1. Van Der Harst P., De Windt L. J. & Chambers J. C. Translational Perspective on Epigenetics in Cardiovascular Disease HHS Public Access. J Am Coll Cardiol 70, 590–606 (2017). - PMC - PubMed

Publication types