

This is a preprint.
Human movement and transmission dynamics early in Ebola outbreaks
- PMID: 38196653
- PMCID: PMC10775320
- DOI: 10.1101/2023.12.18.23300175
Human movement and transmission dynamics early in Ebola outbreaks
Abstract
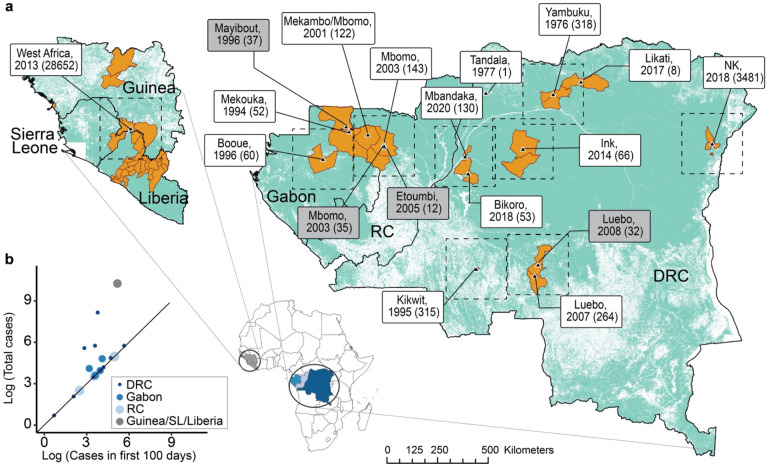
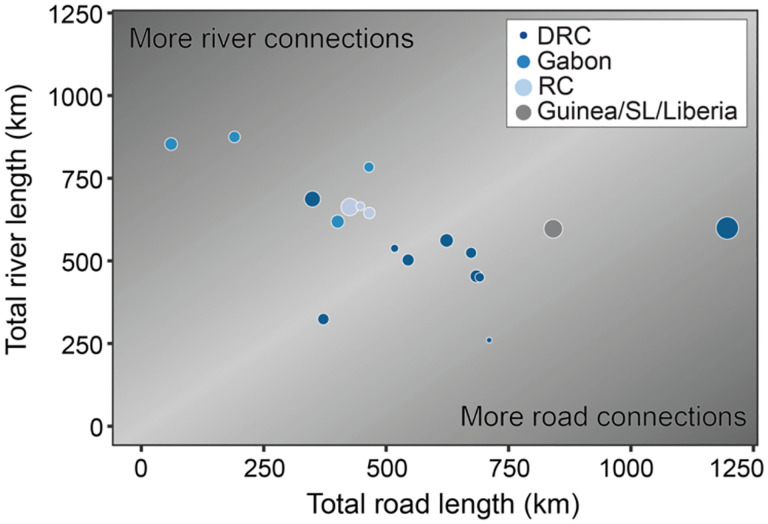
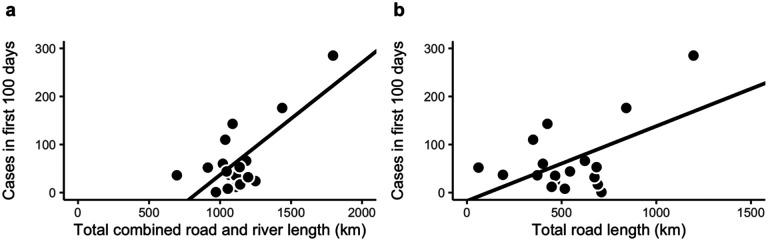
Human movement drives the transmission and spread of communicable pathogens. It is especially influential for emerging pathogens when population immunity is low and spillover events are rare. We digitized serial printed maps to measure transportation networks (roads and rivers) in Central and West Africa as proxies for population mobility to assess relationships between movement and Ebola transmission. We find that the lengths of roads and rivers in close proximity to spillover sites at or near the time of spillover events are significantly correlated with the number of EVD cases, particularly in the first 100 days of each outbreak. Early management and containment efforts along transportation networks may be beneficial in mitigation during the early days of transmission and spatial spread for Ebola outbreaks.
Keywords: Biological, Health, and Medical Sciences; Ebola; Movement; Pathogen Transmission; Public Health and Epidemiology; Roads; Spillovers.
Conflict of interest statement
All authors declare no competing interests.
Figures
Similar articles
-
Estimating undetected Ebola spillovers.PLoS Negl Trop Dis. 2019 Jun 13;13(6):e0007428. doi: 10.1371/journal.pntd.0007428. eCollection 2019 Jun. PLoS Negl Trop Dis. 2019. PMID: 31194734 Free PMC article.
-
Ebola virus disease outbreak; the role of field epidemiology training programme in the fight against the epidemic, Liberia, 2014.Pan Afr Med J. 2015 Oct 10;22 Suppl 1(Suppl 1):5. doi: 10.11694/pamj.supp.2015.22.1.6053. eCollection 2015. Pan Afr Med J. 2015. PMID: 26779298 Free PMC article.
-
The landscape configuration of zoonotic transmission of Ebola virus disease in West and Central Africa: interaction between population density and vegetation cover.PeerJ. 2015 Jan 20;3:e735. doi: 10.7717/peerj.735. eCollection 2015. PeerJ. 2015. PMID: 25648654 Free PMC article.
-
Ebola Virus Disease Outbreaks: Lessons Learned From Past and Facing Future Challenges.Mil Med. 2024 Jul 3;189(7-8):e1470-e1478. doi: 10.1093/milmed/usae204. Mil Med. 2024. PMID: 38743575 Review.
-
The effect of Ebola virus disease on maternal health service utilisation and perinatal outcomes in West Africa: a systematic review.Reprod Health. 2022 Feb 4;19(1):35. doi: 10.1186/s12978-022-01343-8. Reprod Health. 2022. PMID: 35120540 Free PMC article.
References
Publication types
Grants and funding
LinkOut - more resources
Full Text Sources