Gene methylation status in focus of advanced prostate cancer diagnostics and improved individual outcomes
- PMID: 38196695
- PMCID: PMC10772650
- DOI: 10.21037/tau-23-405
Gene methylation status in focus of advanced prostate cancer diagnostics and improved individual outcomes
Abstract
Background: Prostate cancer (PCa) is the most prevalent type of male genitourinary tumor, remains the second leading cause of deaths due to cancer in the United States in men. The aim of this study was to perform an integrative epigenetic analysis to explore the epigenetic abnormalities involved in the development and progression of PCa, and present advanced diagnostics and improved individual outcomes.
Methods: Genome-wide DNA methylation profiles obtained from The Cancer Genome Atlas (TCGA) were analyzed and a diagnostic model was constructed. For validation, we employed profiles from the Gene Expression Omnibus (GEO) and methylation data derived from clinical samples. Gene set enrichment analysis (GSEA) and the Tumor Immune Estimation Resource (TIMER) were employed for GSEA and to assess immune cell infiltration, respectively.
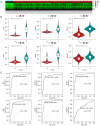
Results: An accurate diagnostic method for PCa was established based on the methylation level of Cyclin-D2 (CCND2) and glutathione S-transferase pi-1 (GSTP1), with an impressive area under the curve (AUC) value of 0.937. The model's reliability was further confirmed through validation using four GEO datasets GSE76938 (AUC =0.930), GSE26126 (AUC =0.906), GSE112047 (AUC =1.000), GSE84749 (AUC =0.938) and clinical samples (AUC =0.980). Notably, the TIMER analysis indicated that hypermethylation of CCND2 and GSTP1 was associated with reduced immune cell infiltration, higher tumor purity, and an increased risk of tumor progression.
Conclusions: In conclusion, our study provides a robust and reliable methylation-based diagnostic model for PCa. This model holds promise as an improved approach for screening and diagnosing PCa, potentially enhancing early detection and patient outcomes, as well as for an advanced clinical management for PCa in the framework of predictive, preventive and personalised medicine.
Keywords: DNA methylation; Prostate cancer (PCa); advanced diagnostics; improved individual outcomes; patient stratification.
2023 Translational Andrology and Urology. All rights reserved.
Conflict of interest statement
Conflicts of Interest: All authors have completed the ICMJE uniform disclosure form (available at https://tau.amegroups.com/article/view/10.21037/tau-23-405/coif). The authors have no conflicts of interest to declare.
Figures


Similar articles
-
Identification of key DNA methylation-driven genes in prostate adenocarcinoma: an integrative analysis of TCGA methylation data.J Transl Med. 2019 Sep 18;17(1):311. doi: 10.1186/s12967-019-2065-2. J Transl Med. 2019. PMID: 31533842 Free PMC article.
-
Prostate cancer molecular detection in plasma samples by glutathione S-transferase P1 (GSTP1) methylation analysis.Clin Lab. 2014;60(5):847-52. doi: 10.7754/clin.lab.2013.130701. Clin Lab. 2014. PMID: 24839830
-
DNA methylation of GSTP1 in human prostate tissues: pyrosequencing analysis.Korean J Urol. 2012 Mar;53(3):200-5. doi: 10.4111/kju.2012.53.3.200. Epub 2012 Mar 19. Korean J Urol. 2012. PMID: 22468217 Free PMC article.
-
Glutathione-S-Transferase p1 Gene Promoter Methylation in Cell-Free DNA as a Diagnostic and Prognostic Tool for Prostate Cancer: A Systematic Review and Meta-Analysis.Int J Endocrinol. 2023 Jan 28;2023:7279243. doi: 10.1155/2023/7279243. eCollection 2023. Int J Endocrinol. 2023. PMID: 36747996 Free PMC article. Review.
-
The prognostic and predictive value of TMPRSS2-ERG gene fusion and ERG protein expression in prostate cancer biopsies.Dan Med J. 2016 Dec;63(12):B5319. Dan Med J. 2016. PMID: 27910803 Review.
Cited by
-
Investigating the prognostic utility of GSTP1 promoter methylation in prostate cancer.BJUI Compass. 2024 Oct 30;5(12):1299-1306. doi: 10.1002/bco2.445. eCollection 2024 Dec. BJUI Compass. 2024. PMID: 39744075 Free PMC article.
-
Recent advances on gene-related DNA methylation in cancer diagnosis, prognosis, and treatment: a clinical perspective.Clin Epigenetics. 2025 May 5;17(1):76. doi: 10.1186/s13148-025-01884-2. Clin Epigenetics. 2025. PMID: 40325471 Free PMC article. Review.
-
Role of DNA methylation transferase in urinary system diseases: From basic to clinical perspectives (Review).Int J Mol Med. 2025 Feb;55(2):19. doi: 10.3892/ijmm.2024.5460. Epub 2024 Nov 22. Int J Mol Med. 2025. PMID: 39575487 Free PMC article. Review.
-
DNA methylation in human diseases.Heliyon. 2024 Jun 4;10(11):e32366. doi: 10.1016/j.heliyon.2024.e32366. eCollection 2024 Jun 15. Heliyon. 2024. PMID: 38933971 Free PMC article. Review.
References
-
- Mazurakova A, Samec M, Koklesova L, et al. Anti-prostate cancer protection and therapy in the framework of predictive, preventive and personalised medicine - comprehensive effects of phytochemicals in primary, secondary and tertiary care. EPMA J 2022;13:461-86. 10.1007/s13167-022-00288-z - DOI - PMC - PubMed
LinkOut - more resources
Full Text Sources
Research Materials
Miscellaneous
