

Identifying immunodeficiency status in children with pulmonary tuberculosis: using radiomics approach based on un-enhanced chest computed tomography
- PMID: 38197102
- PMCID: PMC10772833
- DOI: 10.21037/tp-23-309
Identifying immunodeficiency status in children with pulmonary tuberculosis: using radiomics approach based on un-enhanced chest computed tomography
Abstract
Background: Children with primary immunodeficiency diseases (PIDs) are particularly vulnerable to infection of Mycobacterium tuberculosis (Mtb). Chest computed tomography (CT) is an important examination diagnosing pulmonary tuberculosis (PTB), and there are some differences between primary immunocompromised and immunocompetent cases with PTB. Therefore, this study aimed to use the radiomics analysis based on un-enhanced CT for identifying immunodeficiency status in children with PTB.
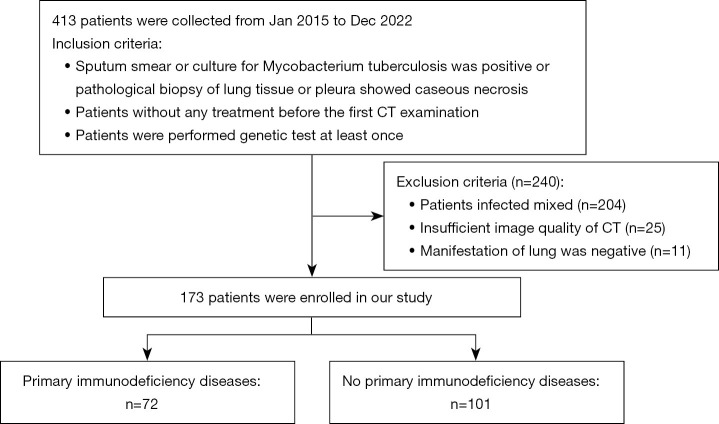
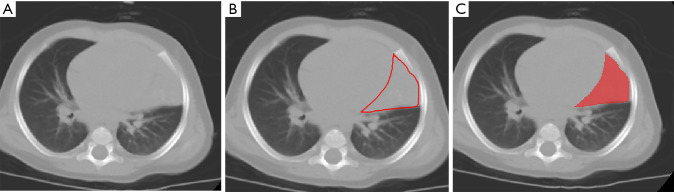
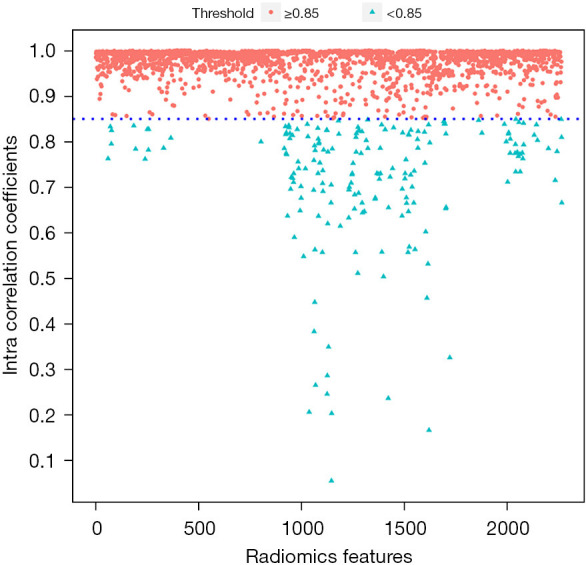
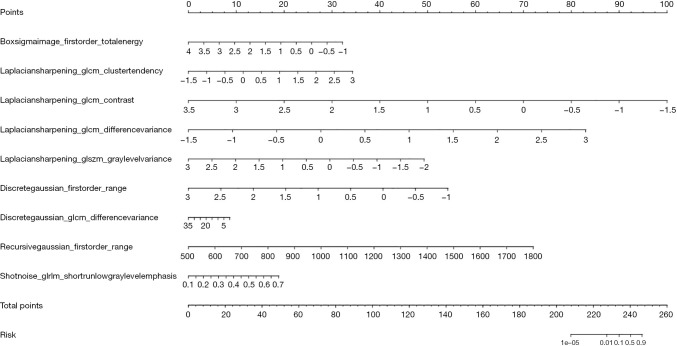
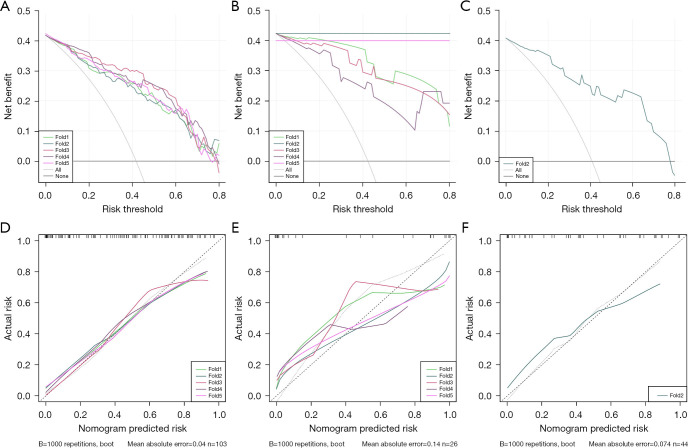
Methods: This retrospective study enrolled a total of 173 patients with diagnosis of PTB and available immunodeficiency status. Based on their immunodeficiency status, the patients were divided into PIDs (n=72) and no-PIDs (n=101). The samplings were randomly divided into training and testing groups according to a ratio of 3:1. Regions of interest were obtained by segmenting lung lesions on un-enhanced CT images to extract radiomics features. The optimal radiomics features were identified after dimensionality reduction in the training group, and a logistic regression algorithm was used to establish radiomics model. The model was validated in the training and testing groups. Diagnostic efficiency of the model was evaluated using the area under the receiver operating characteristic curve (AUC), sensitivity, specificity, precision, accuracy, F1 score, calibration curve, and decision curve.
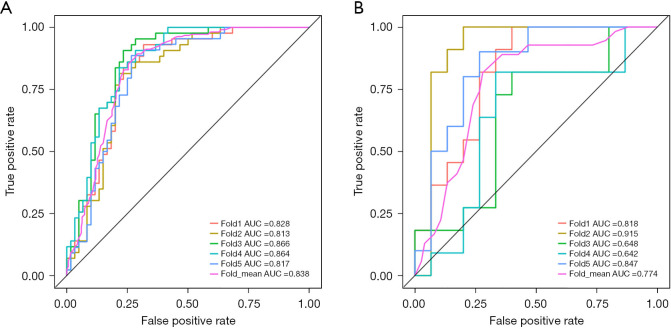
Results: The radiomics model was constructed using nine optimal features. In the training set, the model achieved an AUC of 0.837, sensitivity of 0.783, specificity of 0.780, and F1 score of 0.749. The cross-validation of the model in the training set showed an AUC of 0.774, sensitivity of 0.834, specificity of 0.720, and F1 score of 0.749. In the test set, the model achieved an AUC of 0.746, sensitivity of 0.722, specificity of 0.692, and F1 score of 0.823. Calibration curves indicated a strong predictive performance by the model, and decision curve analysis demonstrated its clinical utility.
Conclusions: The CT-based radiomics model demonstrates good discriminative efficacy in identifying the presence of PIDs in children with PTB, and shows promise in accurately identifying the immunodeficiency status in this population.
Keywords: Radiomics; children; differential diagnosis; primary immunodeficiency diseases (PIDs); pulmonary tuberculosis (PTB).
2023 Translational Pediatrics. All rights reserved.
Conflict of interest statement
Conflicts of Interest: All authors have completed the ICMJE uniform disclosure form (available at https://tp.amegroups.com/article/view/10.21037/tp-23-309/coif). F.W. is an employee of Shanghai United Imaging Intelligence Co., Ltd, a for-profit company, during the conduct of the study. The other authors have no conflicts of interest to declare.
Figures
Similar articles
-
Differentiating nontuberculous mycobacterium pulmonary disease from pulmonary tuberculosis through the analysis of the cavity features in CT images using radiomics.BMC Pulm Med. 2022 Jan 7;22(1):4. doi: 10.1186/s12890-021-01766-2. BMC Pulm Med. 2022. PMID: 34991543 Free PMC article.
-
Radiomics Analysis of Iodine-Based Material Decomposition Images With Dual-Energy Computed Tomography Imaging for Preoperatively Predicting Microsatellite Instability Status in Colorectal Cancer.Front Oncol. 2019 Nov 22;9:1250. doi: 10.3389/fonc.2019.01250. eCollection 2019. Front Oncol. 2019. PMID: 31824843 Free PMC article.
-
Radiomics nomogram for preoperative differentiation of pulmonary mucinous adenocarcinoma from tuberculoma in solitary pulmonary solid nodules.BMC Cancer. 2023 Mar 21;23(1):261. doi: 10.1186/s12885-023-10734-4. BMC Cancer. 2023. PMID: 36944978 Free PMC article. Clinical Trial.
-
Radiomics analysis of contrast-enhanced computed tomography in predicting the International Neuroblastoma Pathology Classification in neuroblastoma.Insights Imaging. 2023 Jun 14;14(1):106. doi: 10.1186/s13244-023-01418-5. Insights Imaging. 2023. PMID: 37316589 Free PMC article.
-
Revolutionizing diagnosis of pulmonary Mycobacterium tuberculosis based on CT: a systematic review of imaging analysis through deep learning.Front Microbiol. 2025 Jan 8;15:1510026. doi: 10.3389/fmicb.2024.1510026. eCollection 2024. Front Microbiol. 2025. PMID: 39845042 Free PMC article.
Cited by
-
Radiomics with structural magnetic resonance imaging, surface morphometry features, neurology scales, and clinical metrics to evaluate the neurodevelopment of preschool children with corrected tetralogy of Fallot.Transl Pediatr. 2024 Sep 30;13(9):1571-1587. doi: 10.21037/tp-24-219. Epub 2024 Sep 26. Transl Pediatr. 2024. PMID: 39399711 Free PMC article.
References
-
- Global Tuberculosis Report 2022[website]. Geneva: World Health Organization. 2022. Available online: https://www.who.int/publications/i/item/9789240061729
LinkOut - more resources
Full Text Sources