. 2024 Feb 1;131(2):360-378.
doi: 10.1152/jn.00369.2023. Epub 2024 Jan 10.

Transcranial magnetic stimulation over supramarginal gyrus stimulates primary motor cortex directly and impairs manual dexterity: implications for TMS focality

Affiliations

Transcranial magnetic stimulation over supramarginal gyrus stimulates primary motor cortex directly and impairs manual dexterity: implications for TMS focality

Nicholas P Holmes et al. J Neurophysiol. .

Abstract

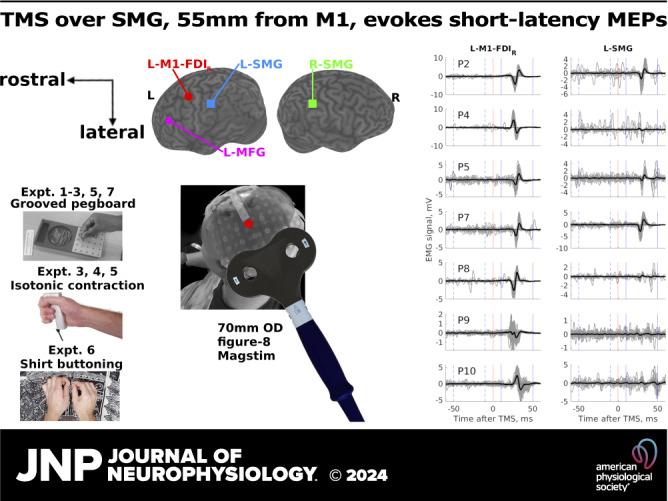
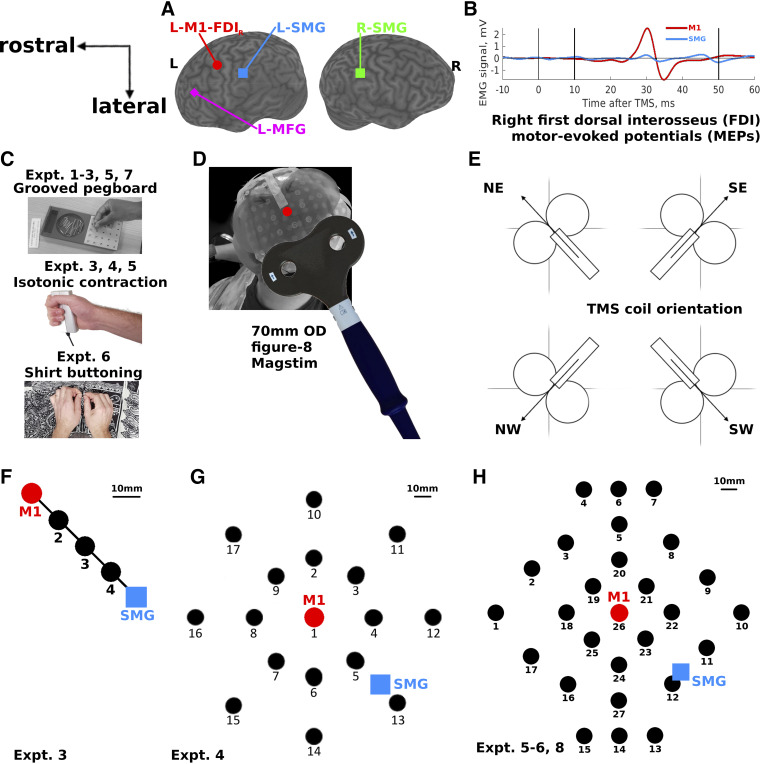
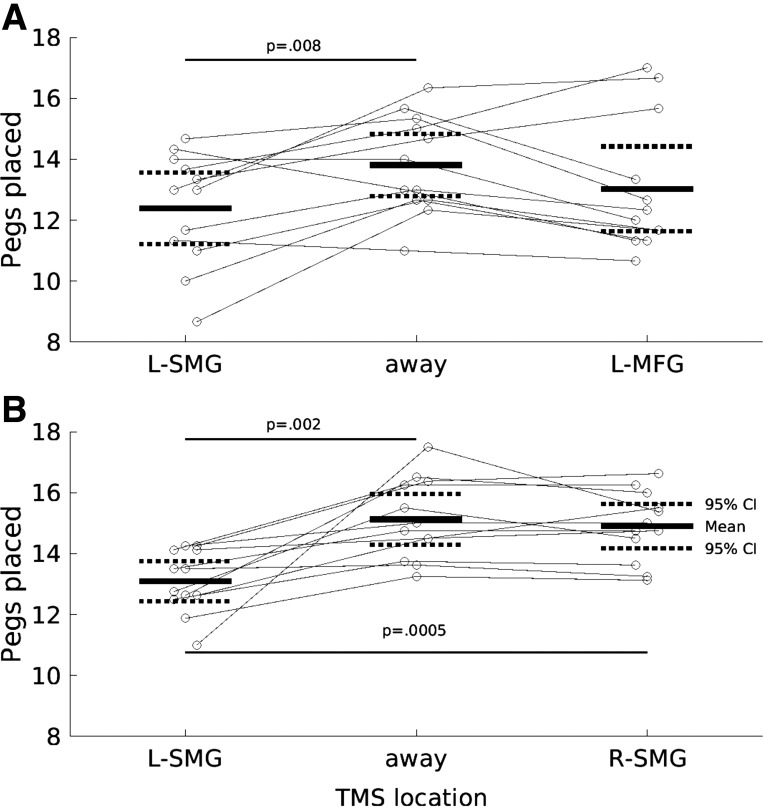
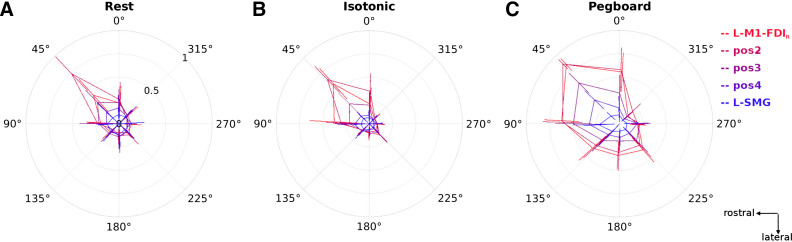
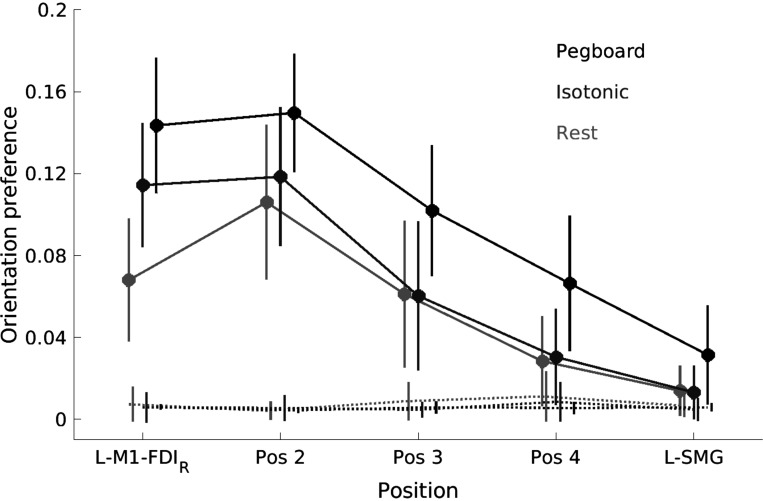
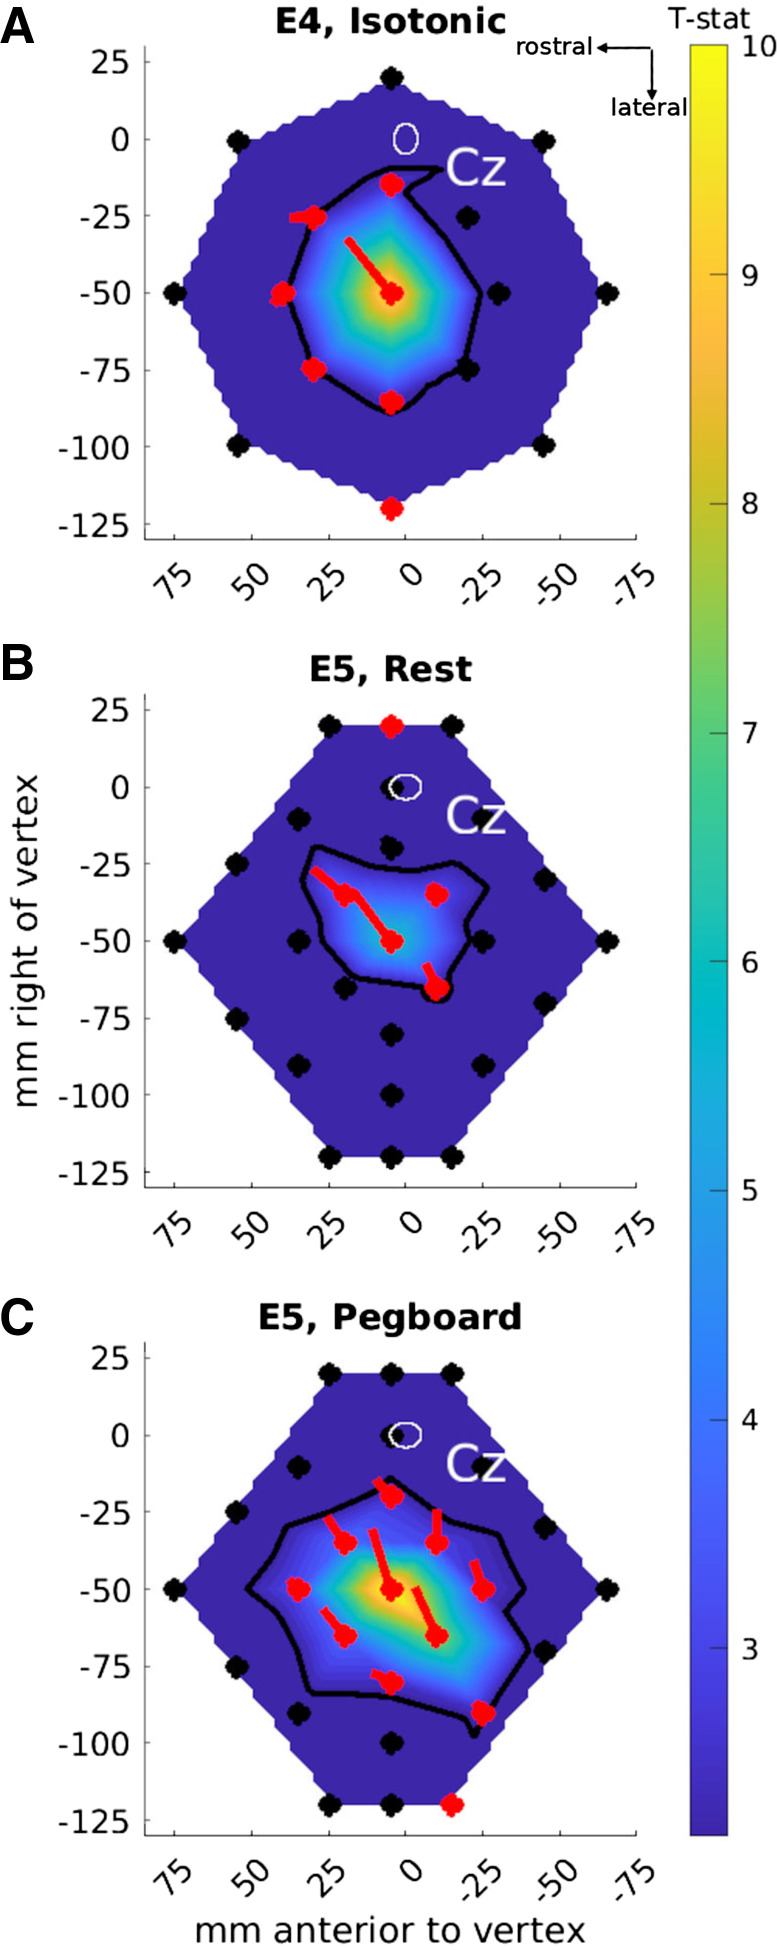
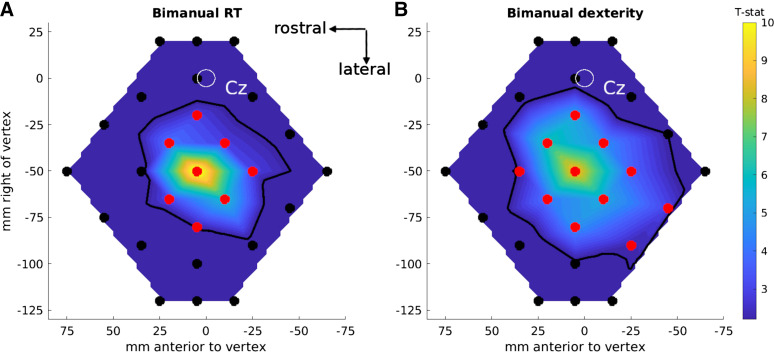
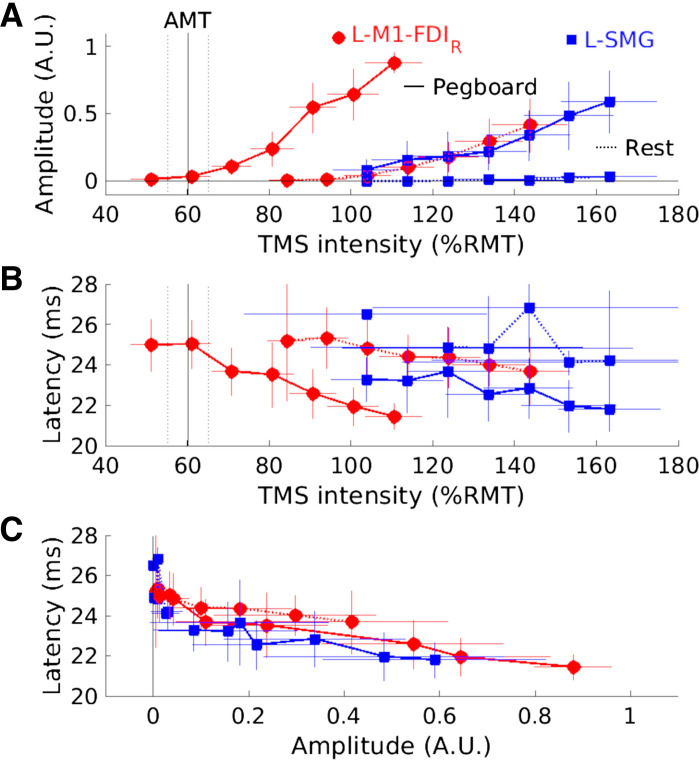
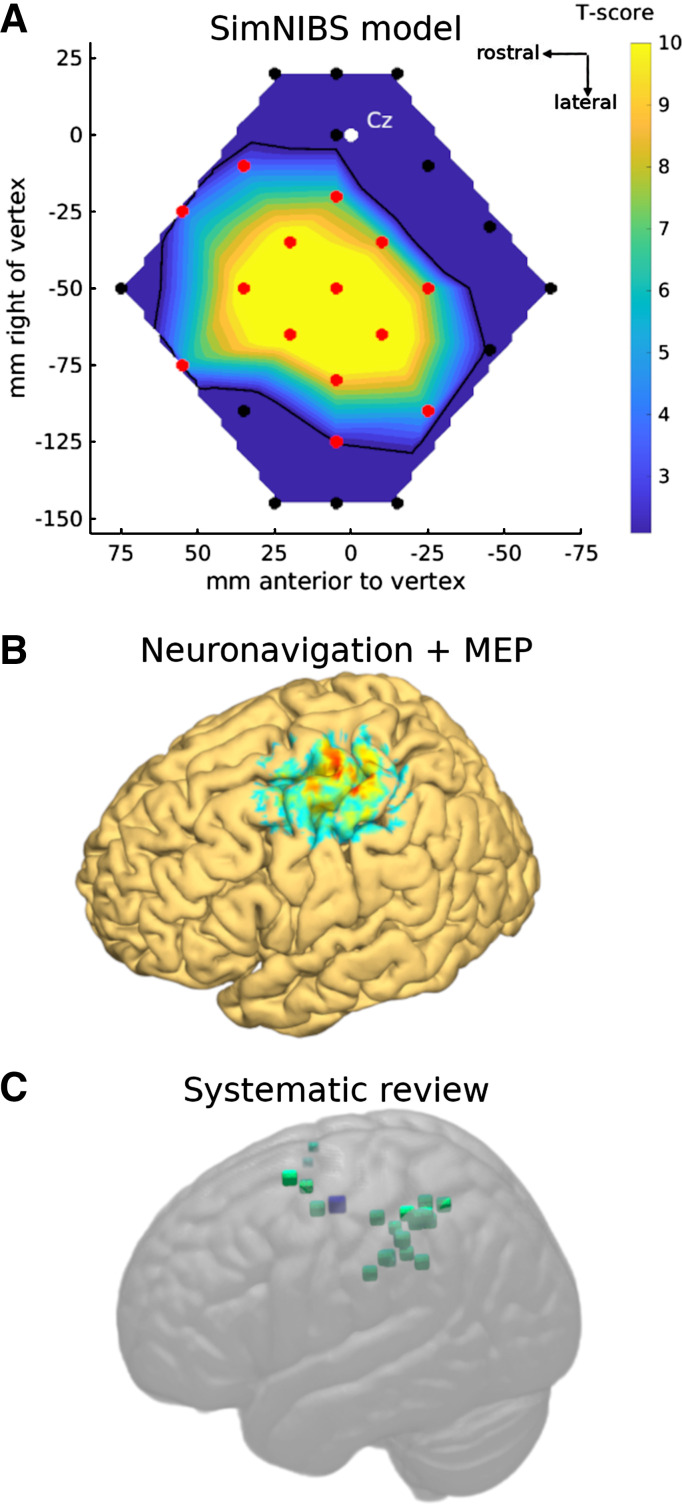
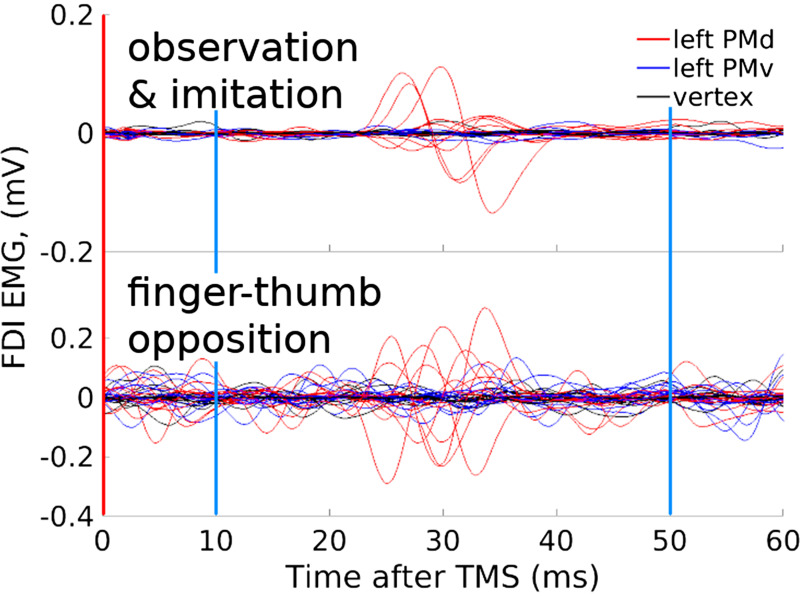
Based on human motor cortex, the effective spatial resolution of transcranial magnetic stimulation (TMS) is often described as 5-20 mm, because small changes in TMS coil position can have large effects on motor-evoked potentials (MEPs). MEPs are often studied at rest, with muscles relaxed. During muscle contraction and movement, corticospinal excitability is higher, thresholds for effective stimulation are lower, and MEPs can be evoked from larger regions of scalp, so the effective spatial resolution of TMS is larger. We found that TMS over the supramarginal gyrus (SMG) impaired manual dexterity in the grooved pegboard task. It also resulted in short-latency MEPs in hand muscles, despite the coil being 55 mm away from the motor cortex hand area (M1). MEPs might be evoked by either a specific corticospinal connection from SMG or a remote but direct electromagnetic stimulation of M1. To distinguish these alternatives, we mapped MEPs across the scalp during rest, isotonic contraction, and manual dexterity tasks and ran electric field simulations to model the expected M1 activation from 27 scalp locations and four coil orientations. We also systematically reviewed studies using TMS during movement. Across five experiments, TMS over SMG reliably evoked MEPs during hand movement. These MEPs were consistent with direct M1 stimulation and substantially decreased corticospinal thresholds during natural movement. Systematic review suggested that 54 published experiments may have suffered from similar motor activation confounds. Our results have implications for the assumed spatial resolution of TMS, and especially when TMS is presented within 55 mm of the motor cortex.NEW & NOTEWORTHY Transcranial magnetic stimulation (TMS) is often described as having an effective spatial resolution of ∼10 mm, because of the limited area of the scalp on which TMS produces motor-evoked potentials (MEPs) in resting muscles. We find that during natural hand movement TMS evokes MEPs from a much larger scalp area, in particular when stimulating over the supramarginal gyrus 55 mm away. Our results show that TMS can be effective at much larger distances than generally assumed.

Keywords: corticospinal excitability; manual dexterity; mapping; movement; pegboard.


Conflict of interest statement

No conflicts of interest, financial or otherwise, are declared by the authors.

Figures

None
Graphical abstract
Figure 1.
Figure 1.
Transcranial magnetic stimulation (TMS) over the left motor cortex (L-M1-FDIR, red circles), left and right supramarginal gyrus (L-SMG, blue squares; R-SMG, green square), left middle frontal gyrus (L-MFG, magenta diamond), and 3, 16, and 26 other scalp locations (black circles). A: the cortical locations targeted in experiments 1–3. B: example averaged motor-evoked potentials (MEPs) recorded from 60 TMS pulses in a single participant’s surface electromyography (EMG) over the right hand first dorsal interosseus (FDI) muscle (experiments 2b–7). The vertical lines show the TMS onset (0 ms) and the MEP analysis window between 10 ms and 50 ms. C, top: the Grooved Pegboard task used in experiments 1–3, 5, and 7. Middle: the isometric contraction task used in experiments 3, 4, and 5. Bottom: the shirt-buttoning task used in experiment 6. D: the 27-location map (H), as seen from behind and to the left of 1 participant. The cloth map has 27 numbered targets. A transparent plastic TMS coil template is fixed over the central location (red dot, M1, location 26), and a Magstim 70-mm-outer diameter (OD) figure-8 coil is shown in the approximate “North-East” orientation, with handle 45° to the midline, pointing posterolaterally. Figures 4, 6, 7, and 9 show data from this perspective. E: 4 of the 8 coil orientations used in the study. Circles represent the coil wings; the rectangle represents the coil handle; arrows represent the direction of induced current flow in the brain. Coil orientations were labeled according to compass directions of the induced current flow in the brain, where North (N) is toward the nasion; East (E) is toward the right preauricular point; South (S) is toward the inion; and West (W) is toward the left preauricular point. F: the 5 locations stimulated in experiment 3, from L-M1-FDIR to L-SMG in equidistant intervals; 10 mm scale bar reflects the average across participants. G: the 17 locations stimulated in experiment 4, with L-M1-FDIR in the center (1) and L-SMG approximately midway between locations 5 and 13. H: the 27 locations stimulated in experiments 5 and 6 and measured in experiment 8. The central location is L-M1-FDIR (26), and L-SMG is partway between locations 12 and 11.
Figure 2.
Figure 2.
Transcranial magnetic stimulation (TMS, biphasic) over the left supramarginal gyrus (L-SMG) reduces right hand performance on the pegboard task (pegs placed, y-axis) compared to TMS away from the head or over a control site selected for its annoyance and discomfort (left middle frontal gyrus, L-MFG). Short horizontal solid and dashed lines show the group means and 95% confidence intervals (CIs). Gray circles and lines show individual participant data. Long horizontal lines and P values indicate significant 2-tailed paired t tests. A: experiment 1 (N = 12): TMS at 1 Hz over L-SMG vs. away from the head and over L-MFG. B: experiment 2a (N = 12), TMS at 2 Hz over L-SMG vs. away from the head and over right (R)-SMG. P values relate to paired t tests.
Figure 3.
Figure 3.
Transcranial magnetic stimulation (TMS, biphasic) over the left supramarginal gyrus (L-SMG) produces motor-evoked potentials (MEPs) in the right first dorsal interosseous (FDIR) muscle during the pegboard task (experiment 2b, N = 7). Each panel shows all 60 raw traces (thin gray lines) and the grand average mean electromyographic (EMG) signal (thick black lines) after TMS over the primary motor cortex (L-M1-FDIR, left) and L-SMG (right) from each participant (from top to bottom, P2, 4, 5, 7, 8, 9, 10). With TMS over SMG, all 7 participants show TMS-related EMG deflections in the 10 ms to 50 ms window following TMS, some participants more than others, all participants more in the post-TMS than the pre-TMS window. The y-axis scale varies from a minimum of ±1 mV to ±10 mV.
Figure 4.
Figure 4.
The effect of transcranial magnetic stimulation (TMS, monophasic) coil orientation on motor-evoked potential (MEP) amplitude is strongest during the active movement pegboard task (experiment 3). Data show mean and 95% confidence intervals (N = 12) of MEP amplitudes (normalized by the maximum MEP amplitude per participant and condition, ranging from 0 to 1, radial axis) for 3 conditions, Rest (A), Isotonic contraction (B), and Pegboard (C); 5 TMS coil positions [red (primary motor cortex, L-M1-FDIR) through to blue (left supramarginal gyrus, L-SMG)], and 8 TMS coil orientations (from East at 0°, through North-East at 45°, to South-East at 315°, on polar axes; 90° is toward the nasion). See Supplemental Results S2 and Supplemental Fig. S7 for alternative visualizations of these data along with estimated MEP latency. Data are presented in the same perspective as the participant and brain in Fig. 1.
Figure 5.
Figure 5.
Transcranial magnetic stimulation (TMS, monophasic) coil orientation preference is stronger for the pegboard task compared to both isotonic contraction and rest and remains significantly greater than baseline when the coil is held ∼50 mm away from the primary motor cortex hand area (L-M1-FDIR), over the left supramarginal gyrus (L-SMG) (experiment 3, N = 12). Circles show the mean orientation preference [mean resultant length across 8 orientations of motor-evoked potential (MEP) amplitudes normalized by participant and condition] across 12 participants in 3 conditions (black = Pegboard, mid-gray = Isotonic contraction, light gray = Rest) and for 5 TMS coil positions (between L-M1-FDIR and L-SMG). Error bars show 95% confidence intervals. Solid lines: data measured after the TMS pulse (i.e., from MEPs). Dotted lines: data measured before the TMS pulse (i.e., background electromyographic activity).
Figure 6.
Figure 6.
Cartesian maps of motor-evoked potential (MEP) amplitudes (as t statistics compared to pre-TMS data, map color) and transcranial magnetic stimulation (TMS, monophasic) coil orientation preferences (oriented lines) in experiments 4 (A; 17 locations, N = 12) and 5 (B and C; 27 locations, N = 12). The map background colors show the interpolated t statistics comparing the mean MEP amplitudes after vs. before TMS across all stimulated locations [scale bar on right; thresholded at t(11) > 2.20, P < 0.05; nonsignificant t statistics are in deep blue]. TMS locations are shown as filled circles. Black symbols: no significant difference between pre- and post-TMS (i.e., no significant MEPs). Red symbols: significant differences [t(11) > 2.20, P < 0.05] between pre- and post-TMS. The oriented lines show the mean orientation preference vector for each location (red indicates vectors that were significantly greater in amplitude for post- compared to pre-TMS). The thick black contour line shows the interpolated threshold level: TMS presented at locations inside the contour induced significant MEPs. Cz: the white oval shows the mean ± 95% confidence ellipsoid for the origin of the map across participants, at the vertex, Cz[0,0]mm. Data are presented in the same perspective as the participant and brain in Fig. 1.
Figure 7.
Figure 7.
Cartesian maps of motor-evoked potential (MEP) amplitudes as t statistics compared to before transcranial magnetic stimulation (TMS, monophasic; data shown as map color) in experiment 6: bimanual reaction time (RT) task (A) and bimanual dexterity task (B) (27 locations each). The map background colors show the t statistics comparing the mean MEP amplitudes after vs. before TMS, interpolated across all the locations stimulated [scale bar on right; thresholded at t(11) > 2.20, P < 0.05; nonsignificant t statistics are in deep blue]. TMS locations are shown as filled circles. Black symbols: no significant difference between pre- and post-TMS (i.e., no significant MEPs). Red symbols: significant differences (P < 0.05) between pre- and post-TMS. The thick black contour line shows the interpolated threshold level: TMS presented at locations inside the contour induced significant MEPs in the hand muscle. Cz: the white oval shows the mean ± 95% confidence ellipsoid for the origin of the map across participants, at the vertex, Cz[0,0]mm. Data are presented in the same perspective as the participant and brain in Fig. 1.
Figure 8.
Figure 8.
Motor-evoked potential (MEP) amplitude and latency across 7 transcranial magnetic stimulation (TMS, monophasic) intensities provide no evidence for separate sources of MEPs evoked from TMS over left motor cortex hand area (L-M1-FDIR) or left supramarginal gyrus (L-SMG; experiment 7, N = 11). TMS was delivered over L-M1-FDIR (red circles) and L-SMG (blue squares) during rest (dotted lines) and the pegboard task (solid lines). Thin red and blue horizontal and vertical lines show 95% confidence intervals for the means, based on different numbers of participants for each data point. Vertical black lines in A and B indicate the mean (solid) and 95% confidence intervals (dotted) active motor threshold (AMT) during the pegboard task (AMTpegboard). A: normalized MEP amplitude [y-axis, arbitrary units (A.U.)] vs. TMS intensity [x-axis, % of resting motor threshold (%RMTRossini94)]. B: MEP latency (y-axis, ms) vs. TMS intensity (x-axis, %RMTRossini94). C: MEP latency (y-axis, ms) vs. normalized MEP amplitude (x-axis, A.U.). The generally overlapping curves in C are consistent with a single neural source of the MEPs, evoked at lower TMS intensities from directly over L-M1-FDIR and at higher intensities over L-SMG, 55 mm away on the scalp.
Figure 9.
Figure 9.
Modeling and localizing the scalp and brain areas over which transcranial magnetic stimulation (TMS) can generate motor-evoked potentials (MEPs) in hand muscles during hand movement. A: SimNIBS modeling of the electric field generated by a TMS pulse at 110% resting motor threshold in the North-East orientation. The data show the expected activation of the motor cortex hand area from each location, thresholded at the estimated cutoff where MEPs were detected (Supplemental Fig. S3) and expressed as a t test against the threshold value. The SimNIBS modeling data reflect the empirical findings (Figs. 6 and 7). B: 3-dimensional (3-D) rendering of MEP amplitudes obtained from 7 participants with neuronavigation data. The image shows an approximate, conservative representation of which brain areas, when targeted with TMS, are likely close enough to the hand area of the left motor cortex to induce MEPs during right hand and arm movement. Voxel intensity is a weighted sum proportional to the inverse of distance between each voxel and all 27 TMS sites, thresholded, rescaled, transformed to MNI space, smoothed and averaged across participants, and rendered with FieldTrip and FSL tools. C: systematic review revealed 19 studies that targeted 41 locations (small green squares) away from, but within 42 mm of, the left primary motor cortex hand area (MNI[−38,−15,58]mm, large blue square). Fewer than 41 distinct locations are visible since some locations were stimulated multiple times across studies. Data are presented in the same perspective as the participant and brain in Fig. 1.
Figure 10.
Figure 10.
Motor-evoked potentials (MEPs) were elicited with transcranial magnetic stimulation (TMS) over premotor cortex during movement in a previously unanalyzed dataset. Red vertical lines show the onset of TMS; blue vertical lines show the window from 10 ms to 50 ms after TMS in which MEPs in the hand and arm will occur. The data are from first dorsal interosseus (FDI) muscle activity during action observation, imitation, and finger-thumb opposition and after TMS at 110% distance-adjusted resting motor threshold (RMT) [Stokes et al. (32)] over dorsal (PMd, red) and ventral (PMv, blue) premotor cortex and vertex (black). Grand average EMG traces from 1,176 TMS pulses during observation and imitation (top) or 15 pulses during finger-thumb opposition movements (bottom) for each of 12 participants; previously unpublished data from the study by Reader and Holmes (31). Further examples are provided in Supplemental Results S11.

Similar articles

Cited by

References

    1. Schieber MH. Constraints on somatotopic organization in the primary motor cortex. J Neurophysiol 86: 2125–2143, 2001. doi:10.1152/jn.2001.86.5.2125. - DOI - PubMed
    1. Rizzolatti G, Cattaneo L, Fabbri-Destro M, Rozzi S. Cortical mechanisms underlying the organization of goal-directed actions and mirror neuron-based action understanding. Physiol Rev 94: 655–706, 2014. doi:10.1152/physrev.00009.2013. - DOI - PubMed
    1. Borra E, Belmalih A, Calzavara R, Gerbella M, Murata A, Rozzi S, Luppino G. Cortical connections of the macaque anterior intraparietal (AIP) area. Cereb Cortex 18: 1094–1111, 2008. doi:10.1093/cercor/bhm146. - DOI - PubMed
    1. Blatt GJ, Andersen RA, Stoner GR. Visual receptive field organization and cortico-cortical connections of the lateral intraparietal area (area LIP) in the macaque. J Comp Neurol 299: 421–445, 1990. doi:10.1002/cne.902990404. - DOI - PubMed
    1. Stanton GB, Bruce CJ, Goldberg ME. Topography of projections to posterior cortical areas from the macaque frontal eye fields. J Comp Neurol 353: 291–305, 1995. doi:10.1002/cne.903530210. - DOI - PubMed

LinkOut - more resources