. 2024 Feb 28;52(4):e21.
doi: 10.1093/nar/gkad1249.

Improved detection and consistency of RNA-interacting proteomes using DIA SILAC

Affiliations

Improved detection and consistency of RNA-interacting proteomes using DIA SILAC

Thomas C J Tan et al. Nucleic Acids Res. .

Abstract

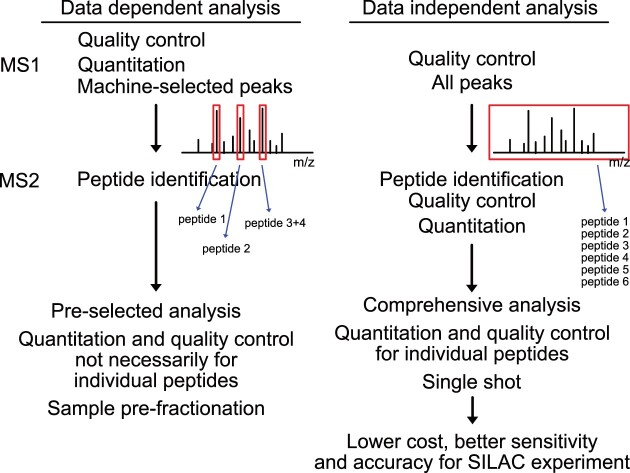
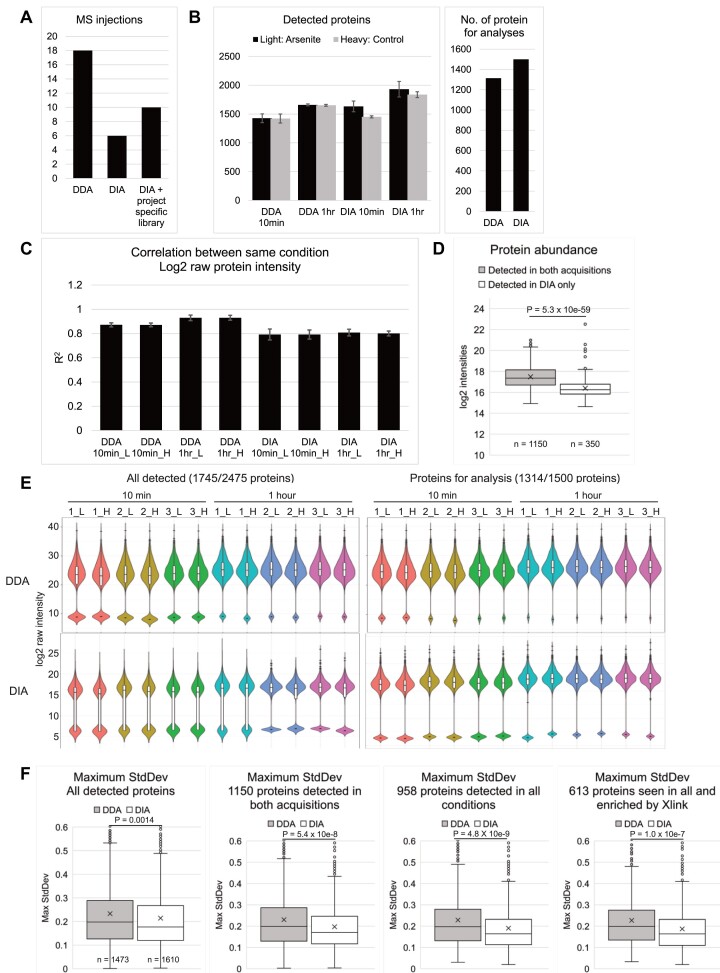
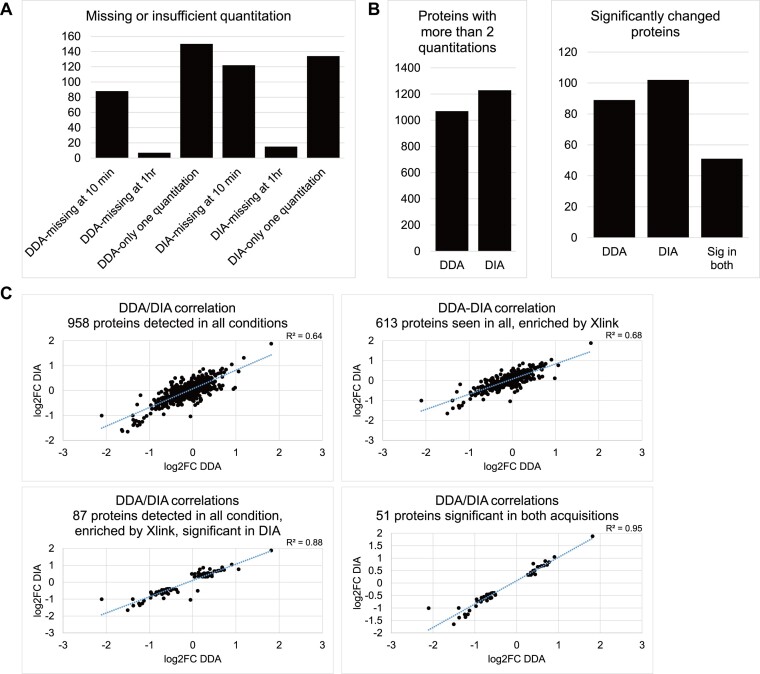
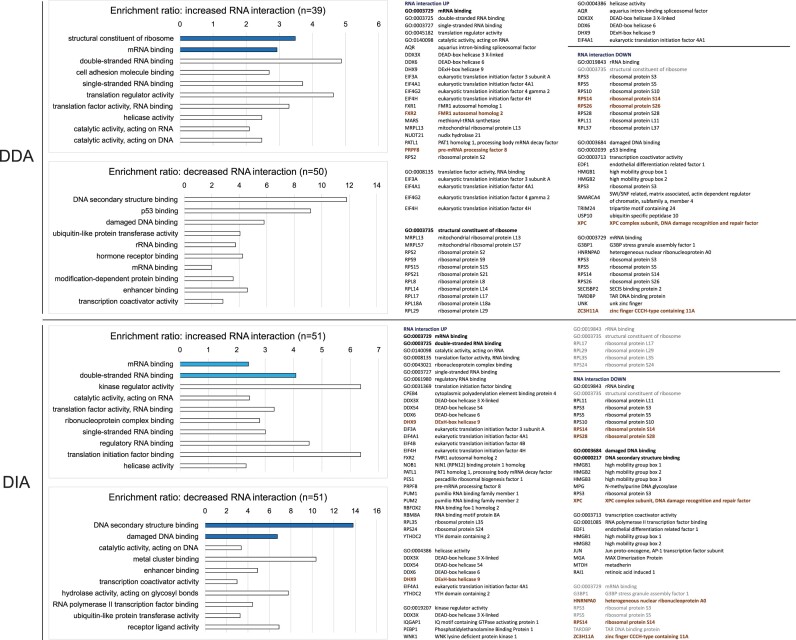
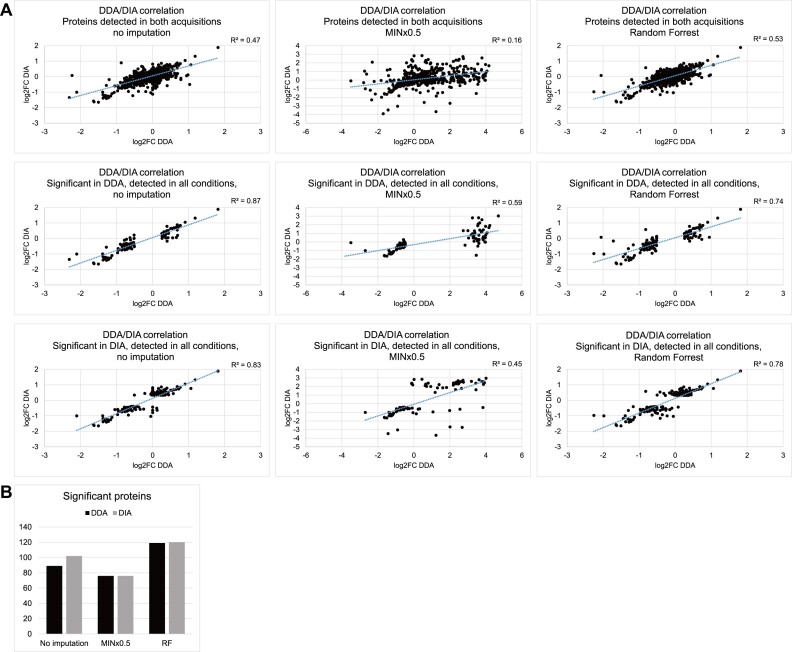
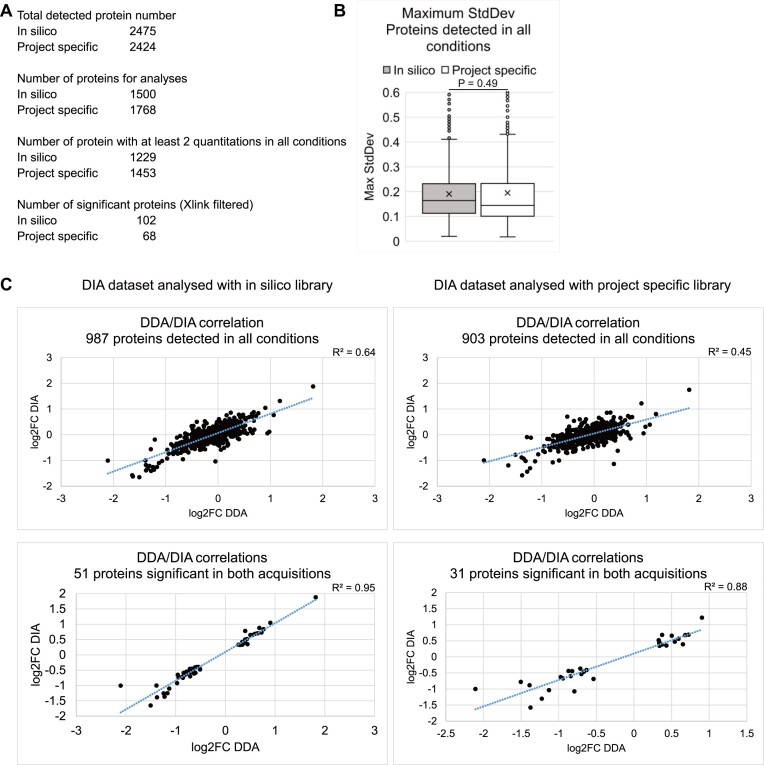
The RNA-interacting proteome is commonly characterized by UV-crosslinking followed by RNA purification, with protein recovery quantified using SILAC labeling followed by data-dependent acquisition (DDA) of proteomic data. However, the low efficiency of UV-crosslinking, combined with limited sensitivity of the DDA approach often restricts detection to relatively abundant proteins, necessitating multiple mass spec injections of fractionated peptides for each biological sample. Here we report an application of data-independent acquisition (DIA) with SILAC in a total RNA-associated protein purification (TRAPP) UV-crosslinking experiment. This gave 15% greater protein detection and lower inter-replicate variation relative to the same biological materials analyzed using DDA, while allowing single-shot analysis of the sample. As proof of concept, we determined the effects of arsenite treatment on the RNA-bound proteome of HEK293T cells. The DIA dataset yielded similar GO term enrichment for RNA-binding proteins involved in cellular stress responses to the DDA dataset while detecting extra proteins unseen by DDA. Overall, the DIA SILAC approach improved detection of proteins over conventional DDA SILAC for generating RNA-interactome datasets, at a lower cost due to reduced machine time. Analyses are described for TRAPP data, but the approach is suitable for proteomic analyses following essentially any RNA-binding protein enrichment technique.


Conflict of interest statement

None declared.

Figures

Graphical Abstract
Graphical Abstract
Figure 1.
Figure 1.
DIA detected more proteins with lower inter-replicate variability compared to DDA. (A) Left: Number of mass-spec injections required by the two acquisitions. (B) Left: means (bar) and standard deviations (error bar) of number of detected proteins in three technical replicates were plotted for all four conditions; Right: number of proteins for analysis, defined as those represented by more than two peptides, and detected in at least two out of three control samples (heavy) in both time points. (C) Pearson correlation coefficient (R2) between log2 raw protein intensities in three replicates of the same conditions. Bar, mean; error bar, standard deviation. (D) Box plot showing average log2 intensities of proteins detected in both acquisitions, and proteins detected only in the DIA dataset. (E) Violin and box plot showing log2 raw intensity of all detected proteins or proteins for analysis. Colors denote the SILAC pairs. Missing values were imputed with half of the minimal log2 value of each sample, reflected by the second population below the main ones in each violin plot. (F) Box plot showing maximum standard deviation (higher of the two time points) of light/heavy ratios of the three replicates for all detected proteins, proteins detected in both acquisitions, proteins detected in all conditions, and proteins detected in all conditions and enriched in UVC-crosslinked over non-crosslinked samples. Center line, median; cross, mean; box limits, upper and lower quartiles; whiskers, 1.5× interquartile range; points, outliers. P values were determined by two-sided t tests, with n numbers indicated in each graph.
Figure 2.
Figure 2.
Positive correlation between protein quantitation and fold-change in SILAC light/heavy ratio between time points in the DDA and DIA datasets. (A) Number of proteins excluded from DE analysis, including those missing at 10 min or 1 h, or having only one quantitation at any time points. (B) Left: Number of proteins with at least two quantitations at any time point in DDA and DIA datasets. Right: Number of significantly changed proteins (two-sided t test P-value < 0.05, FC > 90th and < 10th percentile) in each acquisition, common significant proteins in both datasets. No proteins found were significant in both datasets but showed opposite fold-changes. (C) Dot plot of log2 fold change in light/heavy ratio from 10 min to 1 h time points in DDA and DIA datasets for proteins detected in all conditions; proteins detected in all conditions and enriched by crosslinking; proteins detected in all conditions, enriched by crosslinking, and significantly changed according to the DIA dataset; and proteins commonly significant in both datasets.
Figure 3.
Figure 3.
Significantly differentially associated proteins in DDA and DIA datasets have similar GO term enrichment.Left: top-ten enriched GO terms in molecular function for proteins with increased or decreased RNA interaction from 10 min to 1 h and detected at both time points according to the DDA or DIA dataset. Dark blue bar, FDR < 0.05; pale blue bar, P-value < 0.01 when all FDRs are ≥0.05; white bar, FDR > 0.05. GO terms were sorted by FDR in ascending order, or by pre-adjusted P value if all FDRs were 1. Right: selected gene sets possibly related to the stress-induced RNA translation shutdown. Font: bold black, enriched GO term with FDR < 0.05 or P-value < 0.01 when all FDRs were ≥0.05; black, enriched with FDR > 0.05; grey, GO term absent in top-ten enrichment; bold brown, proteins significant according Benjamini-Hochberg multiple test correction, FDR < 0.05.
Figure 4.
Figure 4.
Effects on the datasets by different imputation approaches. Imputation by MINx0.5 replaced significant proteins with those missing at 10 min, while Random Forrest produced similar dataset to no imputation, but called slightly more significant proteins. (A) Like-for-like comparison of DDA/DIA correlation between original datasets with no imputation, with missing values replaced with sample minimum log2 value minus 1 (MINx0.5) or using Random Forrest. Comparison was restricted to proteins detected in both acquisitions and proteins detected in all conditions while significantly changed between 10 min and 1 h of treatment according to DDA or DIA. (B) Number of proteins regarded as significantly changed between 10 min and 1 h of treatment (two-sided t test P-value < 0.05, FC > 90th and < 10th percentile, enriched in UV-crosslinked samples) in datasets with no imputation, imputed by MINx0.5 or Random Forrest.
Figure 5.
Figure 5.
Effects of in silico or project-specific spectral libraries on DIA datasets. (A) Numbers of proteins: Totally detected; Selected for analysis (detected in at least two replicates at both time points in heavy controls); With at least two quantitations at each time points; Significantly altered plus enriched in UV-crosslinked samples when the peptides were searched using in silico-constructed or mass spec data-constructed (project-specific) spectral libraries. (B) Distribution of maximum inter-replicate standard deviations for proteins detected in all conditions in datasets generated with in silico or project-specific libraries. (C) DDA-DIA correlations for proteins detected in all conditions and significant in both acquisitions in datasets using in silico (left) or project-specific (right) libraries.

Similar articles

Cited by

References

    1. Bresson S., Shchepachev V., Spanos C., Turowski T.W., Rappsilber J., Tollervey D Stress-induced translation inhibition through rapid displacement of scanning initiation factors. Mol. Cell. 2020; 80:470–484. - PMC - PubMed
    1. Queiroz R.M.L., Smith T., Villanueva E., Marti-Solano M., Monti M., Pizzinga M., Mirea D.-M., Ramakrishna M., Harvey R.F., Dezi V. et al. . Comprehensive identification of RNA–protein interactions in any organism using orthogonal organic phase separation (OOPS). Nat. Biotech. 2019; 37:169–178. - PMC - PubMed
    1. Shchepachev V., Bresson S., Spanos C., Petfalski P., Fischer L., Rappsilber J., Tollervey D Defining the RNA interactome by total RNA-associated protein purification. Mol. Sys. Biol. 2019; 15:e8689. - PMC - PubMed
    1. Trendel J., Schwarzl T., Horos R., Prakash A., Bateman A., Hentze M.W., Krijgsveld J. The human RNA-binding proteome and its dynamics during translational arrest. Cell. 2019; 176:391–403. - PubMed
    1. Perez-Perri J.I., Rogell B., Schwarzl T., Stein F., Zhou Y., Rettel M., Brosig A., Hentze M.W. Discovery of RNA-binding proteins and characterization of their dynamic responses by enhanced RNA interactome capture. Nat. Commun. 2018; 9:4408–4408. - PMC - PubMed