. 2024 Feb;66(2):106-118.
doi: 10.1111/dgd.12906. Epub 2024 Jan 10.

Transcription factor Tcf21 modulates urinary bladder size and differentiation

Affiliations

Transcription factor Tcf21 modulates urinary bladder size and differentiation

Elizabeth A Mann et al. Dev Growth Differ. 2024 Feb.

Abstract

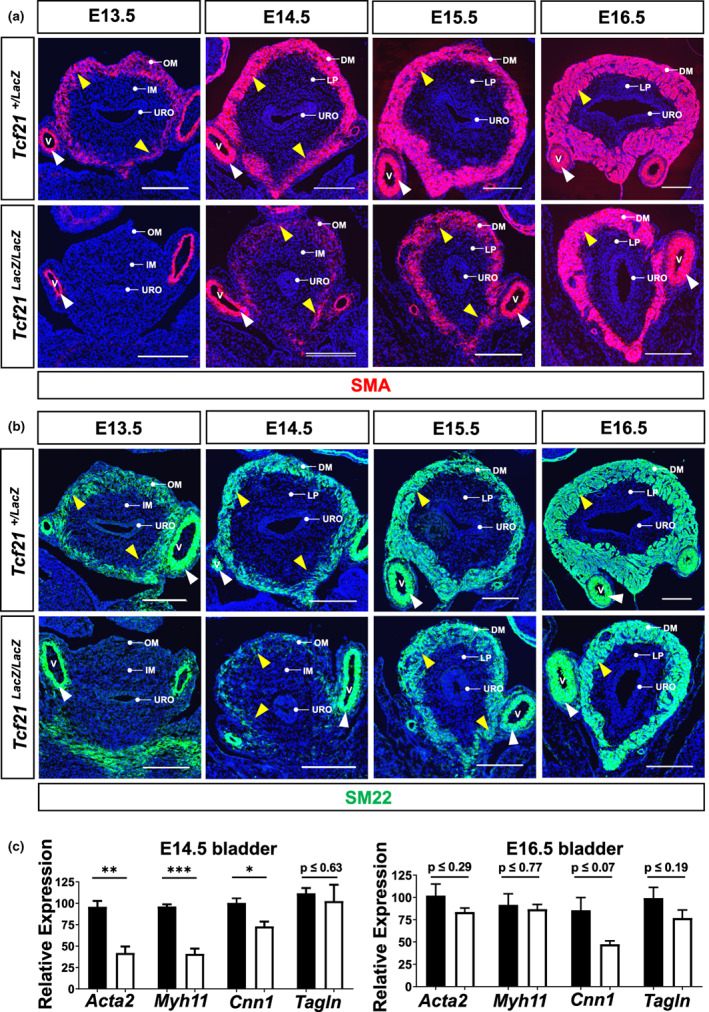
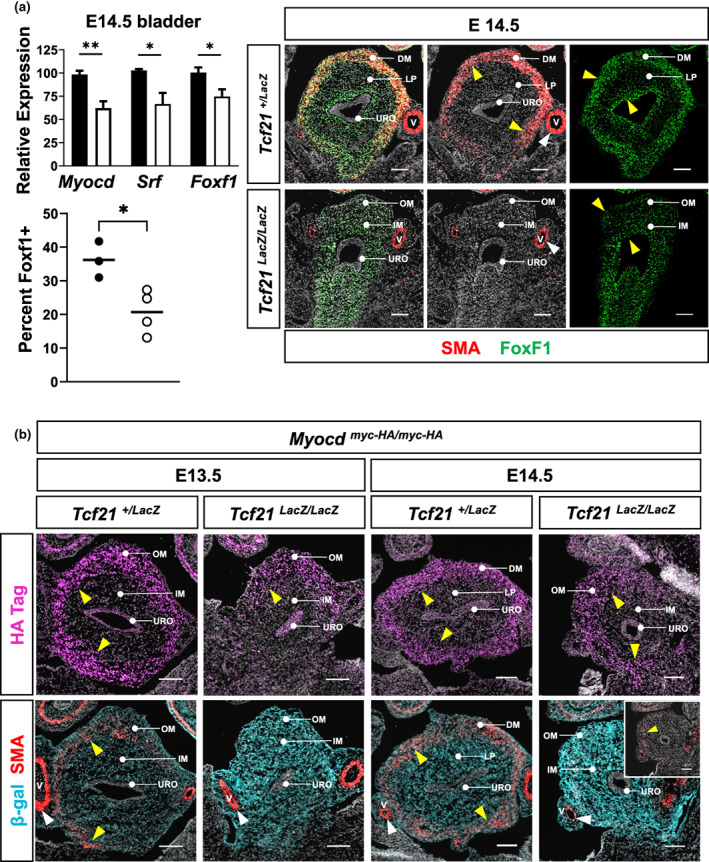
Urinary bladder organogenesis requires coordinated cell growth, specification, and patterning of both mesenchymal and epithelial compartments. Tcf21, a gene that encodes a helix-loop-helix transcription factor, is specifically expressed in the mesenchyme of the bladder during development. Here we show that Tcf21 is required for normal development of the bladder. We found that the bladders of mice lacking Tcf21 were notably hypoplastic and that the Tcf21 mutant mesenchyme showed increased apoptosis. There was also a marked delay in the formation of visceral smooth muscle, accompanied by a defect in myocardin (Myocd) expression. Interestingly, there was also a marked delay in the formation of the basal cell layer of the urothelium, distinguished by diminished expression of Krt5 and Krt14. Our findings suggest that Tcf21 regulates the survival and differentiation of mesenchyme cell-autonomously and the maturation of the adjacent urothelium non-cell-autonomously during bladder development.

Keywords: bladder; development; smooth muscle; transcription factor Tcf21; urothelium.


Figures

FIGURE 1
FIGURE 1
Loss of mesenchymal Tcf21 expression results in reduced bladder size with increased apoptosis. (a) Comparison of morphology in sections of Tcf21 +/LacZ and Tcf21 LacZ/LacZ bladders at indicated developmental stages. Tcf21 expression is marked by antibody staining (green, yellow arrowheads) against β‐Galactosidase encoded by the LacZ reporter. There is no staining in the urothelium (URO) at any time point. At E13.5, Tcf21 expression is found primarily in the inner mesenchyme (IM) of the control bladder and extends throughout the entire outer mesenchyme (OM) and IM of the null bladder. As the smooth muscle (SM) layer differentiates (DM) at E14.5, Tcf21 expression in the control is localized to the lamina propria (LP) and continues to be abundant in the LP at E16.5 and E18.5. By contrast, in the null bladder, development of the DM does not become apparent until after E14.5 (see Figure 2 for SM marker immunostaining), whereupon Tcf21 expression is localized to the LP at E16.5 and continues at E18.5. In the null mutant, decreased size compared to the control is first visibly apparent at E14.5 and continues through later stages shown (all scale bars = 100 μm). Dilation of the control bladder at E16.5 is shown with gold arrows. V, blood vessel. (b) Cleaved caspase 3 (CC3) immunostaining of Tcf21 +/LacZ and Tcf21 LacZ/LacZ bladder sections at E14.5 and E16.5. CC3+ nuclei are colored white, as indicated by yellow arrowheads. Quantification of CC3+ nuclei (percentage of total nuclei, line at mean) reveals that apoptosis is higher in the null bladder at both time points. **, E14.5, p ≤ .01; E16.5, p ≤ .007. All cells in the bladder, outlined in gold, were counted. The mean cell number counted per embryo, at E14.5, is 3240 cells for control and 2342 for null bladders, n = 7 embryos per genotype. For E16.5, the mean cell number counted is control, 9579 cells and null, 3765 cells, n = 7 embryos per genotype. Scale bar = 100 μm. (c) Immunostaining for phosphorylated histone H3 (pH3) in Tcf21 +/LacZ and Tcf21 LacZ/LacZ bladder sections at E14.5 and E16.5. pH3+ nuclei are colored white, as indicated by yellow arrowheads. No difference in the percentage of pH3+ nuclei (line at mean) was seen between control and null bladders at either E14.5 or E16.5. All bladder cells within the gold lines were counted. For the E14.5 control, mean cell number counted per embryo: 2826, n = 9 embryos; for the E14.5 null bladder, mean cell number: 2171, n = 10 embryos; for the E16.5 control, mean cell number: 7652, n = 7 embryos; for the E16.5 null bladder, mean cell number: 3110, n = 6 embryos. Scale bar = 100 μm. Black circles, control; white circles, null. Nuclei are stained with DAPI (blue).
FIGURE 2
FIGURE 2
Formation of smooth muscle (SM) is delayed in bladders lacking Tcf21. (a, b) Immunostaining of the SM markers SMA (smooth muscle actin alpha 2, magenta) and SM22 (transgelin, green) shows that SM formation lags by ~1 day in the Tcf21 null bladder compared to the control bladder (scale bar = 200 μm). Yellow arrowheads indicate SM in bladder; white arrowheads indicate SM in blood vessels (V). DM, detrusor muscle; IM, inner mesenchyme; LP, lamina propria; OM, outer mesenchyme, URO, urothelium. Nuclei are stained with DAPI (blue). (c) Relative expression of SM marker genes in whole bladder is measured by real‐time qPCR at E14.5 and E16.5. While Acta2, Myh11, and Cnn1 levels are significantly reduced at E14.5 in Tcf21 LacZ/LacZ bladders (white bars) compared to control (black bars), by E16.5 the levels are similar to control. No significant difference is seen for Tagln at either time point. Expression of Cnn1 is reduced in null bladders at E16.5 but the difference is not significant (control, 85.6 ± 14.3 vs. null, 47.4 ± 3.9, mean ± SEM). Data shown are normalized to Gapdh expression and are relative to the levels in the control bladder (mean ± SEM). E14.5, control, n = 4, null, n = 3; E16.5, control, n = 6, null, n = 4). *p ≤ .02, **p ≤ .003, ***p ≤ .0002.
FIGURE 3
FIGURE 3
Expression of SM transcriptional regulators is altered by Tcf21 deficiency. (a) At E14.5 the expression levels (normalized to Gapdh and expressed relative to the control values, mean ± SEM) of the genes encoding transcriptional regulators of SM development Myocd, SRF, and Foxf1 are reduced by ~25%–35% in the Tcf21 null bladder (white bars) compared to control (black bars) as determined by qPCR. *p ≤ .04, **p ≤ .005. In the control bladder at E14.5, abundant SMA (red) immunostaining of the DM (yellow arrowheads) is accompanied by high expression of Foxf1 (green) localized primarily in the DM as well as in the sub‐urothelial LP (yellow arrowheads). In contrast, reduced and uniform staining of Foxf1 is seen in the mesenchyme of the Tcf21 null bladder with little to no SMA expression. Quantification of the percentage of Foxf1+ nuclei revealed a significant reduction (*p ≤ .02) in the null bladder (mean of 21%, n = 4, white circles) relative to the control (mean of 36%, n = 3, black circles). The average number of cells counted per embryo was 3635 for null and 3385 for control. (b) At E13.5, Myocd, visualized by immunostaining for the HA tag (magenta staining, yellow arrowheads, top panel), is present throughout the outer mesenchyme of the control bladder and is accompanied by the appearance of scattered cells positive for SMA (red staining, yellow arrowheads, bottom panel). In contrast, Myocd is limited to the dome region of the Tcf21 null bladder. No signal is seen for SMA in the null bladder. At E14.5, Myocd expression is extended around the periphery of the null bladder, and is accompanied by sparse expression of SMA (inset, yellow arrowhead) compared to abundant expression of both SMA and Myocd present in control bladders. Tcf21 expression in Tcf21 +/LacZ and Tcf21 LacZ/LacZ bladders is marked by immunostaining for β‐Galactosidase encoded by the LacZ reporter (turquoise staining, bottom panel). Nuclei are stained with DAPI (white). White arrowheads indicate SMA immunostaining in the umbilical artery. DM, detrusor muscle; IM, inner mesenchyme; LP, lamina propria; OM, outer mesenchyme; URO, urothelium; V, blood vessel. Scale bar = 100 μm.
FIGURE 4
FIGURE 4
Spatial identity of urothelial cell layers is maintained in the Tcf21 null bladder. (a) Immunostaining for p63, a marker for intermediate and basal cells, shows similar patterns in both genotypes at E14.5 and E16.5. Localization of the uroplakins, Upk1a and Upk3a, in the S cells (apical layer) of the urothelium is apparent in both genotypes. Less intense staining of uroplakins is evident in the null urothelium at E14.5. At E16.5 the staining of both Upks has increased in the null bladder and appears more similar to control than at E14.5. However, the more diffuse pattern of Upk1a staining in the null urothelium at E16.5 more closely resembles the pattern of the control at E14.5. Micrographs of portions of the urothelium at E16.5 have been enlarged to different extents for each genotype. Nuclei are stained with DAPI (blue). Scale bar = 50 μm. Regions of immunostaining in the bladder are indicated by yellow arrowheads; IM, inner mesenchyme; LP, lamina propria; URO, urothelium. (b) Gene expression levels (normalized to Gapdh and expressed relative to the control values, mean ± SEM) of uroplakin family members Upk1a, Upk2, and Upk3a are reduced in the null bladder compared to control at E14.5 and E16.5 as determined by qPCR. Black bars, control; white bars, null. E14.5, control, n = 4, null, n = 3; E16.5, control, n = 6, null, n = 4. ***p ≤ .0005; **p ≤ .008; *p ≤ .03.
FIGURE 5
FIGURE 5
The timing of basal cell formation is delayed in the Tcf21 null bladder. (a) At E15.5, immunostaining of p63 (red staining and arrowheads) marks the urothelium (URO) in both the bladder and the urethra (UR), while the basal cell marker Krt5 (green staining and arrowheads) is seen mainly in the UR in both control and Tcf21 null mice. White staining and arrowheads indicate SM22+ regions. DM, detrusor muscle; LP, lamina propria. Nuclei are stained with DAPI (blue). Scale bar = 100 μm. (b) At E16.5, Krt5 (green) is highly expressed in the basal and intermediate layers of the control urothelium but is sparse in the basal layer of Tcf21 null bladders (gold arrowheads). Immunostaining of the cell membrane marker Aqp3 (white) is comparable in all urothelial layers of both genotypes (gold arrowheads). Nuclei are stained with DAPI (blue). Scale bar = 25 μm. The transcript level of Krt5 is reduced by 75% in the null bladder, while Aqp3 levels are similar between genotypes, as determined by qPCR. Black bars, control; white bars, null. Control, n = 6; null, n = 3. *p ≤ .02 (c) Krt14, which marks a subset of basal cells, is present in the control bladder at E18.5 (turquoise staining and arrowheads) but is considerably reduced in the Tcf21 null bladder. Of note, Upk1a staining (magenta staining and arrowheads) is increased in the null urothelium compared to E16.5 (shown in Figure 4a). Compared to the E16.5 stage shown in (b), an increased number of urothelial cells of the null bladder are positive for Krt5 (green staining and gold arrowheads) at E18.5. Nuclei are stained with DAPI (blue). Scale bar = 25 μm.

Similar articles

References

    1. Acharya, A. , Baek, S. T. , Huang, G. , Eskiocak, B. , Goetsch, S. , Sung, C. Y. , Banfi, S. , Sauer, M. F. , Olsen, G. S. , Duffield, J. S. , Olson, E. N. , & Tallquist, M. D. (2012). The bHLH transcription factor Tcf21 is required for lineage‐specific EMT of cardiac fibroblast progenitors. Development, 139(12), 2139–2149. 10.1242/dev.079970 - DOI - PMC - PubMed
    1. Bell, S. M. , Zhang, L. , Mendell, A. , Xu, Y. , Haitchi, H. M. , Lessard, J. L. , & Whitsett, J. A. (2011). Kruppel‐like factor 5 is required for formation and differentiation of the bladder urothelium. Developmental Biology, 358(1), 79–90. 10.1016/j.ydbio.2011.07.020 - DOI - PMC - PubMed
    1. Braitsch, C. M. , Combs, M. D. , Quaggin, S. E. , & Yutzey, K. E. (2012). Pod1/Tcf21 is regulated by retinoic acid signaling and inhibits differentiation of epicardium‐derived cells into smooth muscle in the developing heart. Developmental Biology, 368(2), 345–357. 10.1016/j.ydbio.2012.06.002 - DOI - PMC - PubMed
    1. Cao, M. , Tasian, G. , Wang, M. H. , Liu, B. , Cunha, G. , & Baskin, L. (2010). Urothelium‐derived sonic hedgehog promotes mesenchymal proliferation and induces bladder smooth muscle differentiation. Differentiation, 79(4–5), 244–250. 10.1016/j.diff.2010.02.002 - DOI - PMC - PubMed
    1. Cheng, W. , Yeung, C. K. , Ng, Y. K. , Zhang, J. R. , Hui, C. C. , & Kim, P. C. (2008). Sonic hedgehog mediator Gli2 regulates bladder mesenchymal patterning. The Journal of Urology, 180(4), 1543–1550. 10.1016/j.juro.2008.06.003 - DOI - PubMed

MeSH terms

Substances