

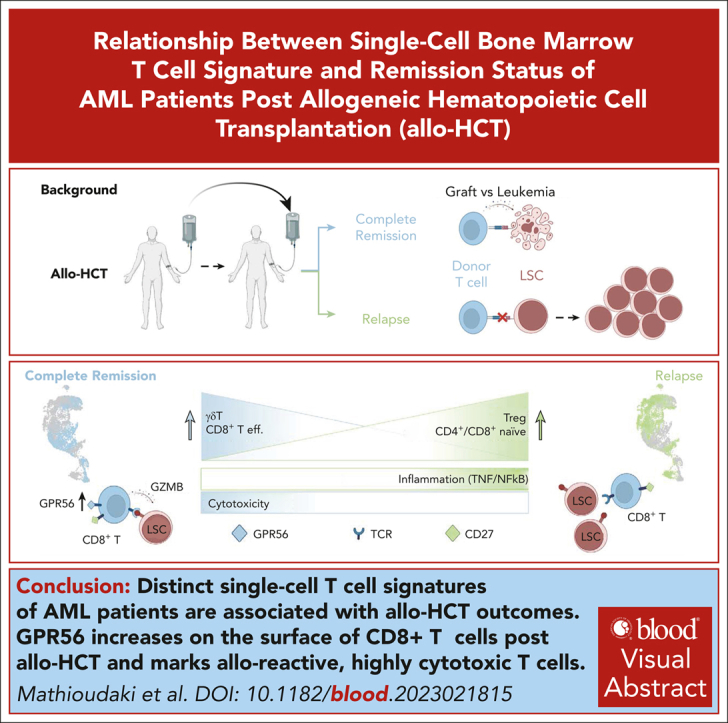
The remission status of AML patients after allo-HCT is associated with a distinct single-cell bone marrow T-cell signature
- PMID: 38197505
- PMCID: PMC10997908
- DOI: 10.1182/blood.2023021815
The remission status of AML patients after allo-HCT is associated with a distinct single-cell bone marrow T-cell signature
Abstract
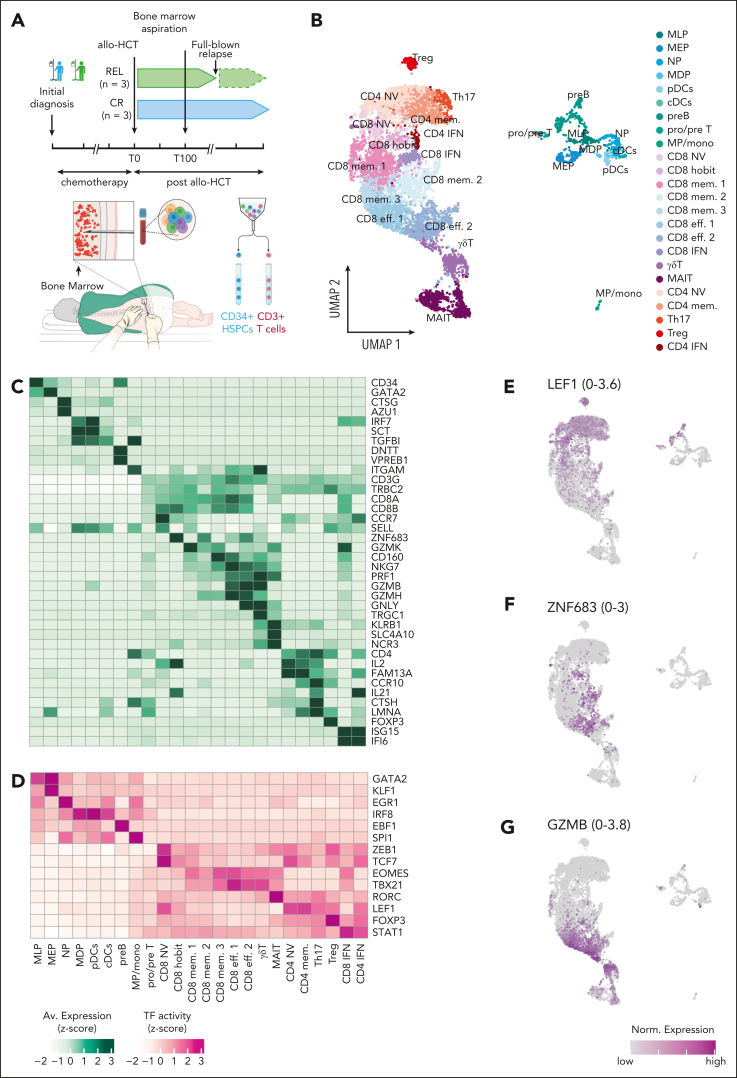
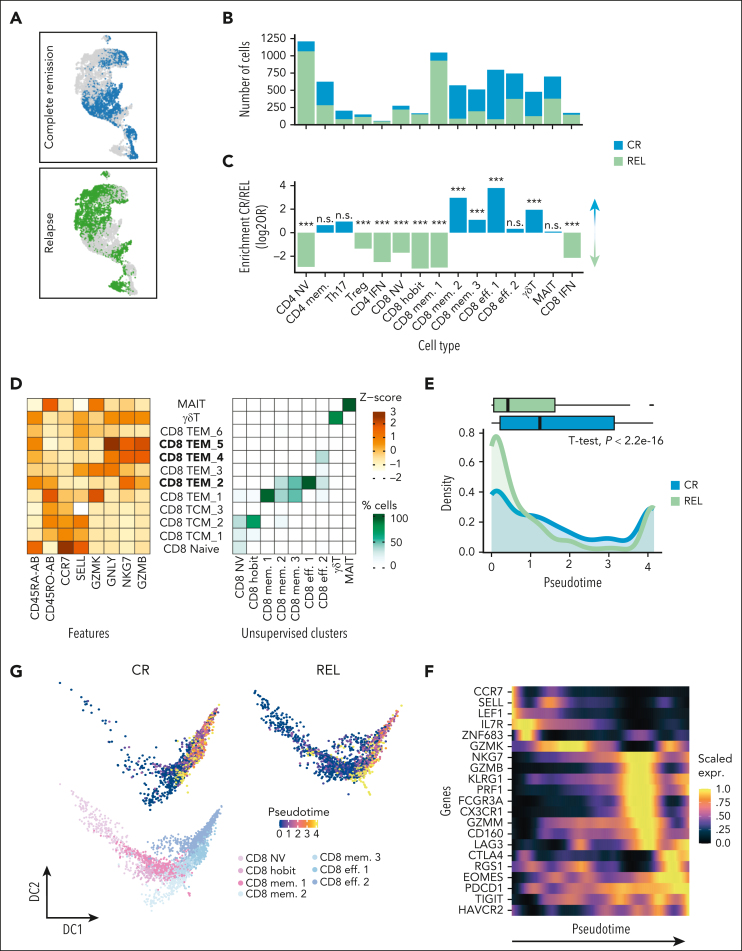
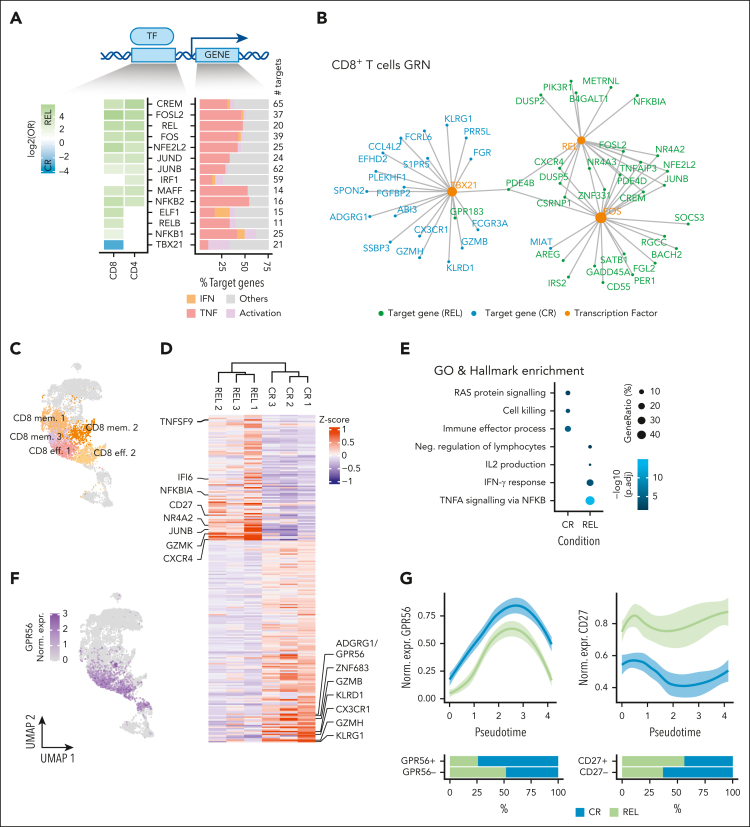
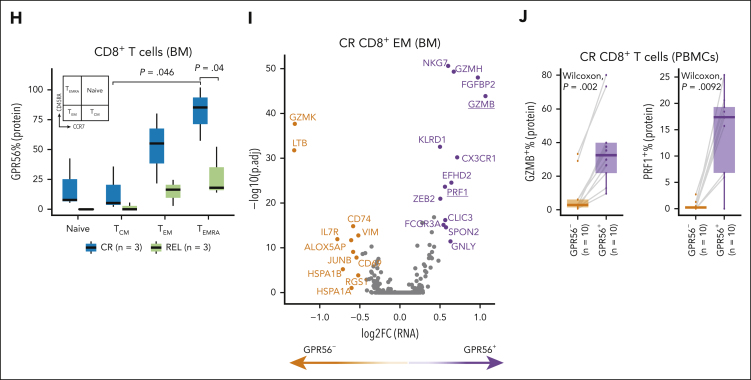
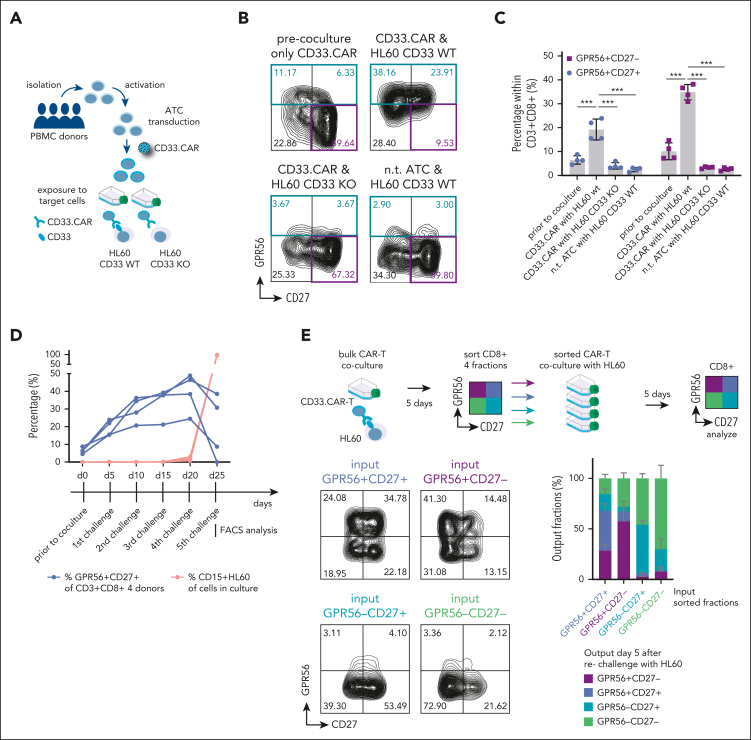
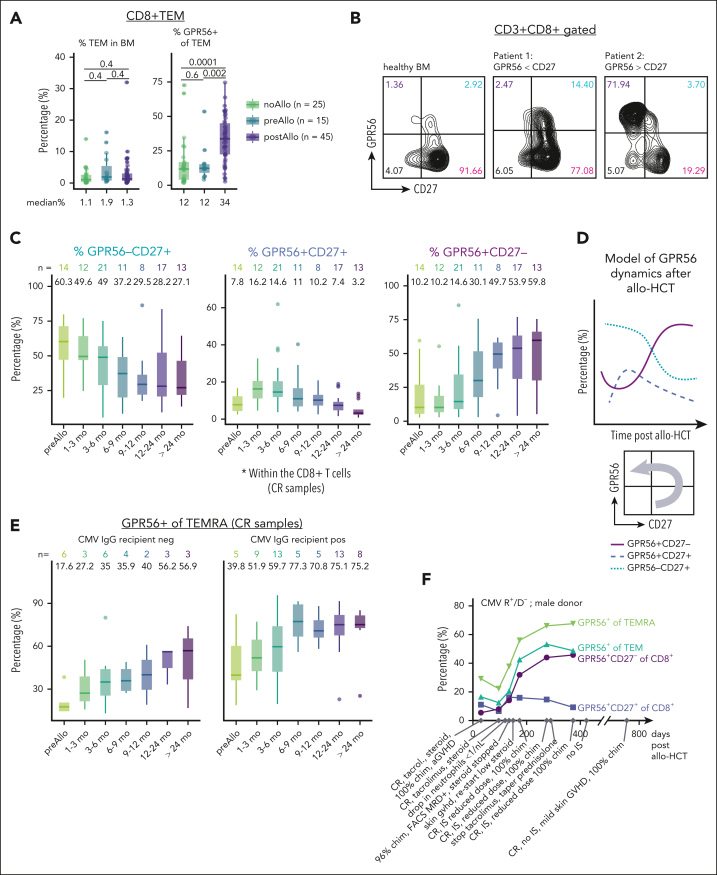
Acute myeloid leukemia (AML) is a hematologic malignancy for which allogeneic hematopoietic cell transplantation (allo-HCT) often remains the only curative therapeutic approach. However, incapability of T cells to recognize and eliminate residual leukemia stem cells might lead to an insufficient graft-versus-leukemia (GVL) effect and relapse. Here, we performed single-cell RNA-sequencing (scRNA-seq) on bone marrow (BM) T lymphocytes and CD34+ cells of 6 patients with AML 100 days after allo-HCT to identify T-cell signatures associated with either imminent relapse (REL) or durable complete remission (CR). We observed a higher frequency of cytotoxic CD8+ effector and gamma delta (γδ) T cells in CR vs REL samples. Pseudotime and gene regulatory network analyses revealed that CR CD8+ T cells were more advanced in maturation and had a stronger cytotoxicity signature, whereas REL samples were characterized by inflammatory tumor necrosis factor/NF-κB signaling and an immunosuppressive milieu. We identified ADGRG1/GPR56 as a surface marker enriched in CR CD8+ T cells and confirmed in a CD33-directed chimeric antigen receptor T cell/AML coculture model that GPR56 becomes upregulated on T cells upon antigen encounter and elimination of AML cells. We show that GPR56 continuously increases at the protein level on CD8+ T cells after allo-HCT and confirm faster interferon gamma (IFN-γ) secretion upon re-exposure to matched, but not unmatched, recipient AML cells in the GPR56+ vs GPR56- CD8+ T-cell fraction. Together, our data provide a single-cell reference map of BM-derived T cells after allo-HCT and propose GPR56 expression dynamics as a surrogate for antigen encounter after allo-HCT.
© 2024 American Society of Hematology. Published by Elsevier Inc. Licensed under Creative Commons Attribution-NonCommercial-NoDerivatives 4.0 International (CC BY-NC-ND 4.0), permitting only noncommercial, nonderivative use with attribution. All other rights reserved.
Conflict of interest statement
Conflict-of-interest disclosure: The authors declare no competing financial interests.
Figures

Comment in
-
GPR56 in GVL: marker or mechanism?Blood. 2024 Mar 28;143(13):1206-1207. doi: 10.1182/blood.2023023448. Blood. 2024. PMID: 38546637 Free PMC article. No abstract available.
References
-
- Takami A. Hematopoietic stem cell transplantation for acute myeloid leukemia. Int J Hematol. 2018;107(5):513–518. - PubMed
-
- Wang Z, Yin C, Zhang W, et al. The benefit of chronic graft-versus-host disease in patients with acute myeloid leukemia relapsed after allogeneic stem cell transplantation. Ann Hematol. 2019;98(7):1765–1773. - PubMed
Publication types
MeSH terms
LinkOut - more resources
Full Text Sources
Medical
Molecular Biology Databases
Research Materials
