. 2024 Mar 1;14(3):424-445.
doi: 10.1158/2159-8290.CD-23-0754.

Noninvasive Detection of Neuroendocrine Prostate Cancer through Targeted Cell-free DNA Methylation

Affiliations

Noninvasive Detection of Neuroendocrine Prostate Cancer through Targeted Cell-free DNA Methylation

Gian Marco Franceschini et al. Cancer Discov. .

Abstract

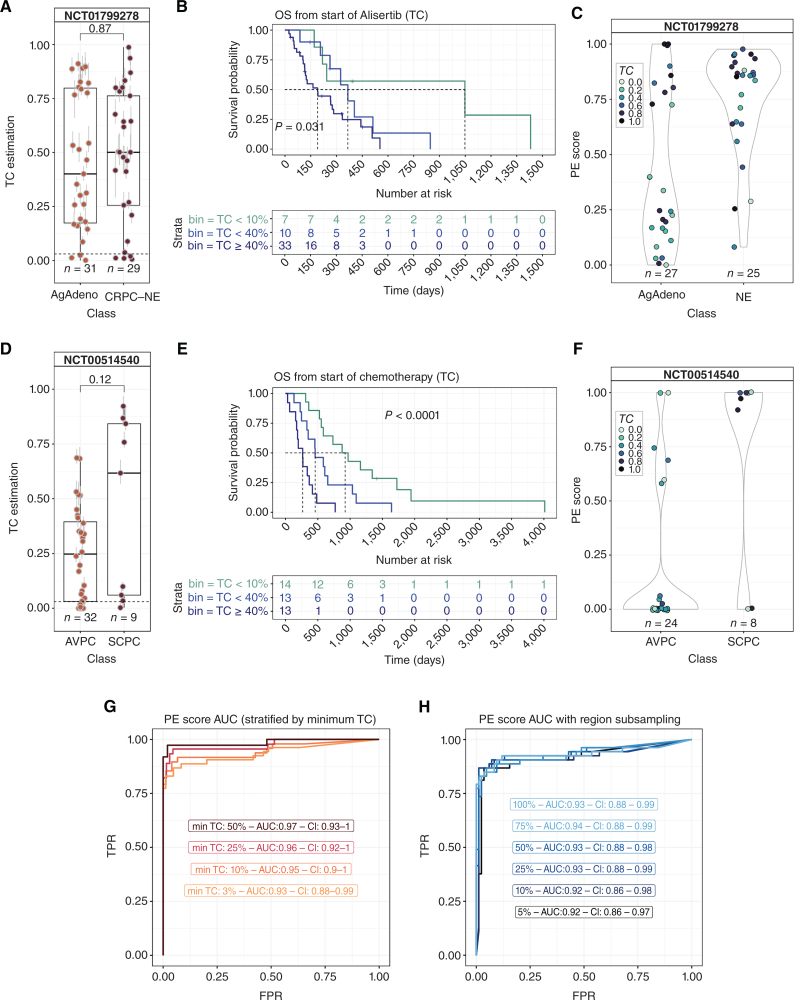
Castration-resistant prostate cancer (CRPC) is a heterogeneous disease associated with phenotypic subtypes that drive therapy response and outcome differences. Histologic transformation to castration-resistant neuroendocrine prostate cancer (CRPC-NE) is associated with distinct epigenetic alterations, including changes in DNA methylation. The current diagnosis of CRPC-NE is challenging and relies on metastatic biopsy. We developed a targeted DNA methylation assay to detect CRPC-NE using plasma cell-free DNA (cfDNA). The assay quantifies tumor content and provides a phenotype evidence score that captures diverse CRPC phenotypes, leveraging regions to inform transcriptional state. We tested the design in independent clinical cohorts (n = 222 plasma samples) and qualified it achieving an AUC > 0.93 for detecting pathology-confirmed CRPC-NE (n = 136). Methylation-defined cfDNA tumor content was associated with clinical outcomes in two prospective phase II clinical trials geared towards aggressive variant CRPC and CRPC-NE. These data support the application of targeted DNA methylation for CRPC-NE detection and patient stratification.

Significance: Neuroendocrine prostate cancer is an aggressive subtype of treatment-resistant prostate cancer. Early detection is important, but the diagnosis currently relies on metastatic biopsy. We describe the development and validation of a plasma cell-free DNA targeted methylation panel that can quantify tumor fraction and identify patients with neuroendocrine prostate cancer noninvasively. This article is featured in Selected Articles from This Issue, p. 384.


Figures

Figure 1. Genome-wide DNA methylation reflects the transition from prostate adenocarcinoma to neuroendocrine prostate cancer. A, Potential model of castration-resistant prostate cancer (CRPC) disease progression with emphasis on the transition from an AR-positive CRPC-Adeno toward AR-negative phenotypes. The top lines indicate a noncomprehensive set of systemic therapies. The bottom bars indicate an overview of the relative contribution of selected biological pathways to the corresponding CRPC subtype based on the current literature. The schematic includes a series of proposed CRPC subtypes, highlighting two lineage plasticity endpoints: neuroendocrine prostate cancer (CRPC-NE) and double-negative prostate cancer (DNPC). Various morphologic or transcriptomic subsets have been proposed as potential intermediary states. ADT, androgen deprivation therapy; ARSi, AR signaling inhibitors; HSPCa, hormone-sensitive prostate cancer; AMPC, amphicrine prostate cancer; EMT, epithelial-to-mesenchymal transition. B, Plot of the genomic burden of DMR obtained with Rockermeth differential methylation analysis for comparisons across progressive prostate cancer disease states. The reported fractions are relative to the length of the haploid genome. Normal, benign prostatic tissue. C, Barplot representing the number of differentially methylated CpG sites (DMS) detected across progressive prostate cancer disease states as reported in B. The criteria for defining differential CpG methylation is based on the AUC obtained using the single CpG site to segregate the two groups (see Materials and Methods). D, Dot plot of motif enrichment around DMSs between CRPC-NE and CRPC-Adeno solid tissue biopsy samples. For each motif, the difference in motif rank between the set of hypermethylated DMSs and hypomethylated DMSs is computed using the P value as the ranking variable. The y-axis reports the most significant P value obtained between the two sets of regions. Blue indicates preferentially hypomethylated motifs (likely activated); red indicates preferentially hypermethylated (likely suppressed); white indicates motifs enriched in DMSs but with no preferential directionality. E, Cumulative density plot of differential methylation signal in Hyper and Hypo DMSs reported in C. The labels indicate the fraction of differentially methylated CpG sites with an absolute difference in β (Δβ) greater than 0.5, 0.4, and 0.3 between CRPC-NE and CRPC-Adeno samples.
Figure 1.
Genome-wide DNA methylation reflects the transition from prostate adenocarcinoma to neuroendocrine prostate cancer. A, Potential model of castration-resistant prostate cancer (CRPC) disease progression with emphasis on the transition from an AR-positive CRPC-Adeno toward AR-negative phenotypes. The top lines indicate a noncomprehensive set of systemic therapies. The bottom bars indicate an overview of the relative contribution of selected biological pathways to the corresponding CRPC subtype based on the current literature. The schematic includes a series of proposed CRPC subtypes, highlighting two lineage plasticity endpoints: neuroendocrine prostate cancer (CRPC-NE) and double-negative prostate cancer (DNPC). Various morphologic or transcriptomic subsets have been proposed as potential intermediary states. ADT, androgen deprivation therapy; ARSi, AR signaling inhibitors; HSPCa, hormone-sensitive prostate cancer; AMPC, amphicrine prostate cancer; EMT, epithelial-to-mesenchymal transition. B, Plot of the genomic burden of DMR obtained with Rockermeth differential methylation analysis for comparisons across progressive prostate cancer disease states. The reported fractions are relative to the length of the haploid genome. Normal, benign prostatic tissue. C, Barplot representing the number of differentially methylated CpG sites (DMS) detected across progressive prostate cancer disease states as reported in B. The criteria for defining differential CpG methylation is based on the AUC obtained using the single CpG site to segregate the two groups (see Materials and Methods). D, Dot plot of motif enrichment around DMSs between CRPC-NE and CRPC-Adeno solid tissue biopsy samples. For each motif, the difference in motif rank between the set of hypermethylated DMSs and hypomethylated DMSs is computed using the P value as the ranking variable. The y-axis reports the most significant P value obtained between the two sets of regions. Blue indicates preferentially hypomethylated motifs (likely activated); red indicates preferentially hypermethylated (likely suppressed); white indicates motifs enriched in DMSs but with no preferential directionality. E, Cumulative density plot of differential methylation signal in Hyper and Hypo DMSs reported in C. The labels indicate the fraction of differentially methylated CpG sites with an absolute difference in β (Δβ) greater than 0.5, 0.4, and 0.3 between CRPC-NE and CRPC-Adeno samples.
Figure 2. Design of an efficient custom sequencing panel to monitor CRPC tumor burden and detect the emergence of CRPC-NE. A, Schematic of NEMO panel design. DNA methylation profiles of solid tissue biopsies from patients with CRPC were collected from two independent studies. Tumor biopsies were classified as CRPC-Adeno and CRPC-NE based on tumor morphology. White blood cells (WBC) and healthy cfDNA profiles were collected from two additional studies and are considered the expected nontumor contribution in cfDNA. A series of differential methylation analyses produced informative DMRs that were prioritized following specific criteria (see Methods section). In addition, a series of knowledge-informed regions were included. The final NEMO sequencing panel design spans ∼150 Kb and covers roughly 8,000 CpG sites. B, Example of informative DMRs. For each sample category, a subset of three representative solid tissue biopsy samples, in vitro models, or primary cell lines (white blood cells) are shown (cyan: PBMC, sepia: CRPC-Adeno, mauve: CRPC-NE). Blue top tracks indicate the captured regions. Left column, two examples of DMRs used for tumor content estimation, exhibiting opposite DNA methylation values in mCRPC (independent of morphology) and WBC samples. Right column, two examples of DMRs used for CRPC-NE detection, exhibiting opposite DNA methylation in CRPC-Adeno and CRPC-NE samples. C, Revigo semantic representation of gene ontology from genes associated with NEMO informative DMRs. The dot size is proportional to the significance of the collapsed terms. The left GO analysis was obtained from the tumor content estimation DMRs. The right GO analysis refers to the modules containing DMRs between CRPC-NE and CRPC-Adeno samples. Knowledge-driven regions have been excluded to avoid enrichment artifacts. D, Multidimensional scaling plot based on a WGBS atlas of normal cell types masked to retain only the regions included in the NEMO panel. Representative cell types of interest are highlighted, prioritizing the most similar healthy counterpart to the phenotypes of interest: WBCs (expected background, cfDNA), prostate epithelial (CRPC-Adeno), and pancreatic endocrine and neural lineage cells (CRPC-NE).
Figure 2.
Design of an efficient custom sequencing panel to monitor CRPC tumor burden and detect the emergence of CRPC-NE. A, Schematic of NEMO panel design. DNA methylation profiles of solid tissue biopsies from patients with CRPC were collected from two independent studies. Tumor biopsies were classified as CRPC-Adeno and CRPC-NE based on tumor morphology. White blood cells (WBC) and healthy cfDNA profiles were collected from two additional studies and are considered the expected nontumor contribution in cfDNA. A series of differential methylation analyses produced informative DMRs that were prioritized following specific criteria (see Methods section). In addition, a series of knowledge-informed regions were included. The final NEMO sequencing panel design spans ∼150 Kb and covers roughly 8,000 CpG sites. B, Example of informative DMRs. For each sample category, a subset of three representative solid tissue biopsy samples, in vitro models, or primary cell lines (white blood cells) are shown (cyan: PBMC, sepia: CRPC-Adeno, mauve: CRPC-NE). Blue top tracks indicate the captured regions. Left column, two examples of DMRs used for tumor content estimation, exhibiting opposite DNA methylation values in mCRPC (independent of morphology) and WBC samples. Right column, two examples of DMRs used for CRPC-NE detection, exhibiting opposite DNA methylation in CRPC-Adeno and CRPC-NE samples. C, Revigo semantic representation of gene ontology from genes associated with NEMO informative DMRs. The dot size is proportional to the significance of the collapsed terms. The left GO analysis was obtained from the tumor content estimation DMRs. The right GO analysis refers to the modules containing DMRs between CRPC-NE and CRPC-Adeno samples. Knowledge-driven regions have been excluded to avoid enrichment artifacts. D, Multidimensional scaling plot based on a WGBS atlas of normal cell types masked to retain only the regions included in the NEMO panel. Representative cell types of interest are highlighted, prioritizing the most similar healthy counterpart to the phenotypes of interest: WBCs (expected background, cfDNA), prostate epithelial (CRPC-Adeno), and pancreatic endocrine and neural lineage cells (CRPC-NE).
Figure 3. Inference of CRPC tumor content in circulation with a minimal set of informative regions. A, Schematic of the tumor content inference strategy. A set of informative regions with opposite and extreme DNA methylation values in WBCs and CRPC was used to estimate the tumor content in cfDNA samples, assuming that the nontumoral fraction of cfDNA is similar to the cfDNA methylation observed in healthy individuals. An iterative subsampling with only half of the informative regions produces a stability interval for the estimation. B, Tumor content estimation on a set of preclinical models, including cell lines, organoids, PDXs, and samples representative of the healthy cfDNA background (PBMC, healthy donors). C, Tumor content estimation on a set of serial dilutions based on preclinical models, pure cell lines, and cfDNA. PBMCs and plasma cell-free DNA from healthy donors (HD) are expected to be negative for tumor content. D, Tumor content estimation of CRPC ctDNA samples from a set of patients from the PRIME cohort. Genomic-based tumor content estimation was obtained by applying the PCF-SELECT panel to matched ctDNA samples collected at the same time point. E, Zoomed-in view of the low tumor content samples with discordant tumor content estimation between NEMO (based on DNA methylation) and PCF-SELECT (based on copy-number alterations and SNP allelic fraction). The statistical significance of an orthogonal per-read analysis based on alpha values of informative regions (see Methods) is reported near the sample.
Figure 3.
Inference of CRPC tumor content in circulation with a minimal set of informative regions. A, Schematic of the tumor content inference strategy. A set of informative regions with opposite and extreme DNA methylation values in WBCs and CRPC was used to estimate the tumor content in cfDNA samples, assuming that the nontumoral fraction of cfDNA is similar to the cfDNA methylation observed in healthy individuals. An iterative subsampling with only half of the informative regions produces a stability interval for the estimation. B, Tumor content estimation on a set of preclinical models, including cell lines, organoids, PDXs, and samples representative of the healthy cfDNA background (PBMC, healthy donors). C, Tumor content estimation on a set of serial dilutions based on preclinical models, pure cell lines, and cfDNA. PBMCs and plasma cell-free DNA from healthy donors (HD) are expected to be negative for tumor content. D, Tumor content estimation of CRPC ctDNA samples from a set of patients from the PRIME cohort. Genomic-based tumor content estimation was obtained by applying the PCF-SELECT panel to matched ctDNA samples collected at the same time point. E, Zoomed-in view of the low tumor content samples with discordant tumor content estimation between NEMO (based on DNA methylation) and PCF-SELECT (based on copy-number alterations and SNP allelic fraction). The statistical significance of an orthogonal per-read analysis based on alpha values of informative regions (see Methods) is reported near the sample.
Figure 4. A tumor content-aware phenotype evidence score detects CRPC-NE in circulation. A, Schematic of phenotype evidence (PE) score estimation in ctDNA samples. Three reference distributions were created using a panel of high tumor-content solid tissue biopsies and PBMC/cfDNA from healthy donors. As the tumor content is known from the previous step, the expected contribution of CRPC-NE and CRPC-Adeno to the observed DNA methylation can be estimated using a Bayesian regression with a strong prior on the non-tumoral component (see Methods). This procedure is equivalent to estimating the position of each sample in a subspace on a two-dimensional simplex, representing a three-component deconvolution bound to a known tumor content. The estimation can be normalized by factoring the tumor content to obtain the relative contribution of the CRPC-NE signal over the total tumor signal, which we refer to as the Phenotype Evidence score (PE score). B, The PE score estimation in a collection of preclinical models of CRPC. The shape of each dot indicates whether the data has been generated with NEMO (circle) or by masking whole genome data (triangle). Statistical significance is assessed with Wilcoxon test.C, Ranked dot-plot of a subset of preclinical CRPC models annotated by gene expression group based on a previous study by Tang et al. (25). SCL, stem cell-like; WNT, WNT-driven; AR, CRPC-Adeno; NE, CRPC-NE. The right bar represents the gradient of CRPC progression captured by the PE score. D, Linearity test of PE score estimation using in vitro dilutions between PM154/PM155 cell lines (minor fraction) and LNCaP. The score presents a clear linear trend with respect to the real minor component. The shaded region represents the 95% CI for a fitted linear model. E, Results of PE score estimation in clinical cohorts. Samples with tumor content below 3% have been excluded because of high PE score uncertainty and possible ambiguity in tumor content detection. The WCM/DFCI cohorts comprise a subset of samples previously profiled with WGBS and masked (circles), retaining only regions captured by the NEMO design. The Wu2020 cohort (19) comprises only masked samples, profiled by bisulfite genome-wide targeted NGS. The PRIME cohort comprises only samples profiled with the NEMO assay. Different shades of blue are used to represent the tumor content of each sample.
Figure 4.
A tumor content-aware phenotype evidence score detects CRPC-NE in circulation. A, Schematic of phenotype evidence (PE) score estimation in ctDNA samples. Three reference distributions were created using a panel of high tumor-content solid tissue biopsies and PBMC/cfDNA from healthy donors. As the tumor content is known from the previous step, the expected contribution of CRPC-NE and CRPC-Adeno to the observed DNA methylation can be estimated using a Bayesian regression with a strong prior on the non-tumoral component (see Methods). This procedure is equivalent to estimating the position of each sample in a subspace on a two-dimensional simplex, representing a three-component deconvolution bound to a known tumor content. The estimation can be normalized by factoring the tumor content to obtain the relative contribution of the CRPC-NE signal over the total tumor signal, which we refer to as the Phenotype Evidence score (PE score). B, The PE score estimation in a collection of preclinical models of CRPC. The shape of each dot indicates whether the data has been generated with NEMO (circle) or by masking whole genome data (triangle). Statistical significance is assessed with Wilcoxon test.C, Ranked dot-plot of a subset of preclinical CRPC models annotated by gene expression group based on a previous study by Tang et al. (25). SCL, stem cell-like; WNT, WNT-driven; AR, CRPC-Adeno; NE, CRPC-NE. The right bar represents the gradient of CRPC progression captured by the PE score. D, Linearity test of PE score estimation using in vitro dilutions between PM154/PM155 cell lines (minor fraction) and LNCaP. The score presents a clear linear trend with respect to the real minor component. The shaded region represents the 95% CI for a fitted linear model. E, Results of PE score estimation in clinical cohorts. Samples with tumor content below 3% have been excluded because of high PE score uncertainty and possible ambiguity in tumor content detection. The WCM/DFCI cohorts comprise a subset of samples previously profiled with WGBS and masked (circles), retaining only regions captured by the NEMO design. The Wu2020 cohort (19) comprises only masked samples, profiled by bisulfite genome-wide targeted NGS. The PRIME cohort comprises only samples profiled with the NEMO assay. Different shades of blue are used to represent the tumor content of each sample.
Figure 5. Probing the CRPC spectrum in PDX models reveals an association between the PE score and transcriptional activity. A, Heat map of gene expression for 11 LuCaP PDX models profiled with NEMO. The reported gene signatures from Labrecque et al. (23) capture the expression of genes supporting the previously described subtype classification of CRPC. B, PE score estimation on the 11 selected PDX models. Top annotation: discretized activity of the reference signatures reported in A. CRPC subtypes are colored as in A. C, GSEA analysis based on the correlation coefficient between gene expression of every single gene and PE score in PDX models. Significant results (Padj < 0.05) for the Hallmark MSigDB collection are reported. NES: GSEA normalized enrichment score. D, Comparison of the Pearson correlation between gene expression and proximal DNA methylation for a selection of regions included in NEMO. The x-axis reports the correlation observed in a collection of PDX samples, whereas the y-axis reports the correlation obtained for the same region-gene pair in the WCDT cohort. Four selected genes of interest are highlighted in red.E, Visualization of the correlation between DNA methylation and gene expression in PDX samples and WCDT cohorts for INSM1, FASN, KLK3, and EZH2. The blue line and shaded regions represent the linear model fit and 95% CI, respectively. F, Kaplan–Meier overall survival analysis based on quantiles of EZH2 expression in the WCDT CRPC cohort. Samples with tumor content below 50% were excluded. Dashed lines indicate the median OS for each group. G, Kaplan–Meier overall survival analysis using the DNA methylation quantiles of the EZH2 associated as a proxy of EZH2 expression. The same samples of F are used.
Figure 5.
Probing the CRPC spectrum in PDX models reveals an association between the PE score and transcriptional activity. A, Heat map of gene expression for 11 LuCaP PDX models profiled with NEMO. The reported gene signatures from Labrecque et al. (23) capture the expression of genes supporting the previously described subtype classification of CRPC. B, PE score estimation on the 11 selected PDX models. Top annotation: discretized activity of the reference signatures reported in A. CRPC subtypes are colored as in A. C, GSEA analysis based on the correlation coefficient between gene expression of every single gene and PE score in PDX models. Significant results (Padj < 0.05) for the Hallmark MSigDB collection are reported. NES: GSEA normalized enrichment score. D, Comparison of the Pearson correlation between gene expression and proximal DNA methylation for a selection of regions included in NEMO. The x-axis reports the correlation observed in a collection of PDX samples, whereas the y-axis reports the correlation obtained for the same region-gene pair in the WCDT cohort. Four selected genes of interest are highlighted in red.E, Visualization of the correlation between DNA methylation and gene expression in PDX samples and WCDT cohorts for INSM1, FASN, KLK3, and EZH2. The blue line and shaded regions represent the linear model fit and 95% CI, respectively. F, Kaplan–Meier overall survival analysis based on quantiles of EZH2 expression in the WCDT CRPC cohort. Samples with tumor content below 50% were excluded. Dashed lines indicate the median OS for each group. G, Kaplan–Meier overall survival analysis using the DNA methylation quantiles of the EZH2 associated as a proxy of EZH2 expression. The same samples of F are used.
Figure 6. The application of NEMO in two phase II clinical trials reveals the prognostic value of cfDNA tumor content and detects potentially undiagnosed CRPC-NE. A, Boxplot of tumor content estimation from ctDNA samples in the phase II trial of the aurora kinase A inhibitor alistertib. Patients had either aggressive clinical features with adenocarcinoma histology (AgAdeno) or CRPC-NE, defined based on tumor morphology on central review of pretreatment biopsy. Eligibility criteria are listed in Supplementary Table S6. B, Kaplan–Meier analysis of overall survival based on estimated ctDNA tumor content in the circulation at the beginning of treatment in patients enrolled on the alisertib trial. C, Violin plot of PE score estimation of cfDNA from patients with AgAdeno and CRPC-NE (samples with tumor content <3% are excluded).D, Boxplot of tumor content estimation from ctDNA samples in the docetaxel plus carboplatin chemotherapy trial. Patients had clinically defined aggressive variant prostate cancer (AVPC) or small-cell prostate carcinoma (i.e., CRPC-NE). A pretreatment biopsy to confirm histo­logy was not required. Eligibility criteria are listed in Supplementary Table S6. E, Kaplan–Meier analysis of overall survival based on estimated tumor content in circulation at the beginning of treatment for the chemotherapy cohort. F, PE score estimation of cfDNA from patients with AVPC and small-cell prostate cancer (SCPC; samples with tumor content <3% are excluded). G, Global AUC of binary classification (CRPC-NE, CRPC-Adeno) based on ctDNA samples with biopsy-confirmed pathology and excluding AVPC and AgAdeno samples. Different shades represent the minimum tumor content required before measuring the PE score segregation performance. H, Global AUC of binary classification based on ctDNA samples as in G. Different shades represent the downsampling of informative regions used for PE score calculation with respect to the total ensemble of informative regions. The more lenient threshold of 3% tumor content has been used for this analysis.
Figure 6.
The application of NEMO in two phase II clinical trials reveals the prognostic value of cfDNA tumor content and detects potentially undiagnosed CRPC-NE. A, Boxplot of tumor content estimation from ctDNA samples in the phase II trial of the aurora kinase A inhibitor alistertib. Patients had either aggressive clinical features with adenocarcinoma histology (AgAdeno) or CRPC-NE, defined based on tumor morphology on central review of pretreatment biopsy. Eligibility criteria are listed in Supplementary Table S6. B, Kaplan–Meier analysis of overall survival based on estimated ctDNA tumor content in the circulation at the beginning of treatment in patients enrolled on the alisertib trial. C, Violin plot of PE score estimation of cfDNA from patients with AgAdeno and CRPC-NE (samples with tumor content <3% are excluded).D, Boxplot of tumor content estimation from ctDNA samples in the docetaxel plus carboplatin chemotherapy trial. Patients had clinically defined aggressive variant prostate cancer (AVPC) or small-cell prostate carcinoma (i.e., CRPC-NE). A pretreatment biopsy to confirm histo­logy was not required. Eligibility criteria are listed in Supplementary Table S6. E, Kaplan–Meier analysis of overall survival based on estimated tumor content in circulation at the beginning of treatment for the chemotherapy cohort. F, PE score estimation of cfDNA from patients with AVPC and small-cell prostate cancer (SCPC; samples with tumor content <3% are excluded). G, Global AUC of binary classification (CRPC-NE, CRPC-Adeno) based on ctDNA samples with biopsy-confirmed pathology and excluding AVPC and AgAdeno samples. Different shades represent the minimum tumor content required before measuring the PE score segregation performance. H, Global AUC of binary classification based on ctDNA samples as in G. Different shades represent the downsampling of informative regions used for PE score calculation with respect to the total ensemble of informative regions. The more lenient threshold of 3% tumor content has been used for this analysis.

References

    1. Lorenzin F, Demichelis F. Evolution of the prostate cancer genome towards resistance. J Transl Genet Genom 2019;3:5.
    1. Bluemn EG, Coleman IM, Lucas JM, Coleman RT, Hernandez-Lopez S, Tharakan R, et al. . Androgen receptor pathway-independent prostate cancer is sustained through FGF signaling. Cancer Cell 2017;32:474–89. - PMC - PubMed
    1. Beltran H, Prandi D, Mosquera JM, Benelli M, Puca L, Cyrta J, et al. . Divergent clonal evolution of castration-resistant neuroendocrine prostate cancer. Nat Med 2016;22:298–305. - PMC - PubMed
    1. Davies AH, Beltran H, Zoubeidi A. Cellular plasticity and the neuroendocrine phenotype in prostate cancer. Nat Rev Urol 2018;15:271–86. - PubMed
    1. Ku SY, Rosario S, Wang Y, Mu P, Seshadri M, Goodrich ZW, et al. . Rb1 and Trp53 cooperate to suppress prostate cancer lineage plasticity, metastasis, and antiandrogen resistance. Science 2017;355:78–83. - PMC - PubMed

Substances