. 2024 Apr 1;81(4):386-395.
doi: 10.1001/jamapsychiatry.2023.5083.

A Systematic Evaluation of Machine Learning-Based Biomarkers for Major Depressive Disorder

Affiliations

A Systematic Evaluation of Machine Learning-Based Biomarkers for Major Depressive Disorder

Nils R Winter et al. JAMA Psychiatry. .

Abstract

Importance: Biological psychiatry aims to understand mental disorders in terms of altered neurobiological pathways. However, for one of the most prevalent and disabling mental disorders, major depressive disorder (MDD), no informative biomarkers have been identified.

Objective: To evaluate whether machine learning (ML) can identify a multivariate biomarker for MDD.

Design, setting, and participants: This study used data from the Marburg-Münster Affective Disorders Cohort Study, a case-control clinical neuroimaging study. Patients with acute or lifetime MDD and healthy controls aged 18 to 65 years were recruited from primary care and the general population in Münster and Marburg, Germany, from September 11, 2014, to September 26, 2018. The Münster Neuroimaging Cohort (MNC) was used as an independent partial replication sample. Data were analyzed from April 2022 to June 2023.

Exposure: Patients with MDD and healthy controls.

Main outcome and measure: Diagnostic classification accuracy was quantified on an individual level using an extensive ML-based multivariate approach across a comprehensive range of neuroimaging modalities, including structural and functional magnetic resonance imaging and diffusion tensor imaging as well as a polygenic risk score for depression.

Results: Of 1801 included participants, 1162 (64.5%) were female, and the mean (SD) age was 36.1 (13.1) years. There were a total of 856 patients with MDD (47.5%) and 945 healthy controls (52.5%). The MNC replication sample included 1198 individuals (362 with MDD [30.1%] and 836 healthy controls [69.9%]). Training and testing a total of 4 million ML models, mean (SD) accuracies for diagnostic classification ranged between 48.1% (3.6%) and 62.0% (4.8%). Integrating neuroimaging modalities and stratifying individuals based on age, sex, treatment, or remission status does not enhance model performance. Findings were replicated within study sites and also observed in structural magnetic resonance imaging within MNC. Under simulated conditions of perfect reliability, performance did not significantly improve. Analyzing model errors suggests that symptom severity could be a potential focus for identifying MDD subgroups.

Conclusion and relevance: Despite the improved predictive capability of multivariate compared with univariate neuroimaging markers, no informative individual-level MDD biomarker-even under extensive ML optimization in a large sample of diagnosed patients-could be identified.


Conflict of interest statement

Conflict of Interest Disclosures: Dr Andlauer reported employment by Boehringer Ingelheim outside the submitted work. Dr Nöthen reported grants from German Research Foundation during the conduct of the study; personal fees from HMG Systems Engineering GmbH, Deutsches Ärzteblatt, and EVERIS Belgique outside the submitted work; employment by Life & Brain GmbH; and holding shares in Life & Brain GmbH. Dr Hofmann reported professorship from Alexander von Humboldt Foundation and personal fees from the National Institute of Mental Health during the conduct of the study. Dr Nenadić reported grants from the German Research Foundation during the conduct of the study. Dr Kircher received unrestricted educational grants from Servier, Janssen, Recordati, Aristo, Otsuka, and Neuraxpharm. Dr Dannlowski reported grants from the German Research Foundation and Interdisciplinary Centre for Clinical Research Münster during the conduct of the study. No other disclosures were reported.

Figures

Figure 1.
Figure 1.. Overview of All Analyses
Overview of all analyses. A, Steps of the machine learning pipeline. B, Reliability correction and its effect on classification accuracy. C, Model error analysis using misclassification frequency (MF) through repeated bootstrapping. BDI indicates Beck Depression Inventory; fMRI, functional magnetic resonance imaging; MDD, major depressive disorder; MRI, magnetic resonance imaging.
Figure 2.
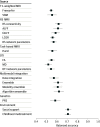
Figure 2.. Balanced Accuracy for the Best Machine Learning Pipelines
Balanced accuracy for the best machine learning pipeline in every modality. Error bars display 1 SD calculated across the 10 outer cross-validation folds. ALFF, amplitude of low-frequency fluctuations; DTI, diffusion tensor imaging; FA, fractional anisotropy; fALFF, fractional amplitude of low-frequency fluctuations; fMRI, functional magnetic resonance imaging; LCOR, local correlation; MD, mean diffusivity; MRI, magnetic resonance imaging; PRS, polygenic risk score; RS, resting state; VBM, voxel-based morphometry.
Figure 3.
Figure 3.. Balanced Accuracy After Attenuation Correction
A, Balanced accuracy for the best machine learning pipeline in every modality after performing an attenuation correction for the empirical reliability of the major depressive disorder (MDD) diagnosis. Error bars display 1 SD calculated across the 10 outer cross-validation folds. B, Balanced accuracy for the best machine learning pipeline in every modality after performing an attenuation correction for simulated reliability of the neuroimaging data. A simulated reliability of 1 corresponds to the empirical results achieved in the unimodal analyses. Decreasing the simulated reliability results in a corrected balanced classification accuracy (BACC). ALFF, amplitude of low-frequency fluctuations; DTI, diffusion tensor imaging; FA, fractional anisotropy; fALFF, fractional amplitude of low-frequency fluctuations; fMRI, functional magnetic resonance imaging; LCOR, local correlation; MD, mean diffusivity; MRI, magnetic resonance imaging; PRS, polygenic risk score; RS, resting state; VBM, voxel-based morphometry.

References

    1. Kendler KS. Toward a philosophical structure for psychiatry. Am J Psychiatry. 2005;162(3):433-440. doi:10.1176/appi.ajp.162.3.433 - DOI - PubMed
    1. Insel TR, Cuthbert BN. Medicine. Brain disorders? Precisely. Science. 2015;348(6234):499-500. doi:10.1126/science.aab2358 - DOI - PubMed
    1. Insel T, Cuthbert B, Garvey M, et al. . Research domain criteria (RDoC): toward a new classification framework for research on mental disorders. Am J Psychiatry. 2010;167(7):748-751. doi:10.1176/appi.ajp.2010.09091379 - DOI - PubMed
    1. Gray JP, Müller VI, Eickhoff SB, Fox PT. Multimodal abnormalities of brain structure and function in major depressive disorder: a meta-analysis of neuroimaging studies. Am J Psychiatry. 2020;177(5):422-434. doi:10.1176/appi.ajp.2019.19050560 - DOI - PMC - PubMed
    1. Winter NR, Leenings R, Ernsting J, et al. . Quantifying deviations of brain structure and function in major depressive disorder across neuroimaging modalities. JAMA Psychiatry. 2022;79(9):879-888. doi:10.1001/jamapsychiatry.2022.1780 - DOI - PMC - PubMed