. 2024 Jan 16;121(3):e2314699121.
doi: 10.1073/pnas.2314699121. Epub 2024 Jan 10.

Local and dynamic regulation of neuronal glycolysis in vivo

Affiliations

Local and dynamic regulation of neuronal glycolysis in vivo

Aaron D Wolfe et al. Proc Natl Acad Sci U S A. .

Abstract

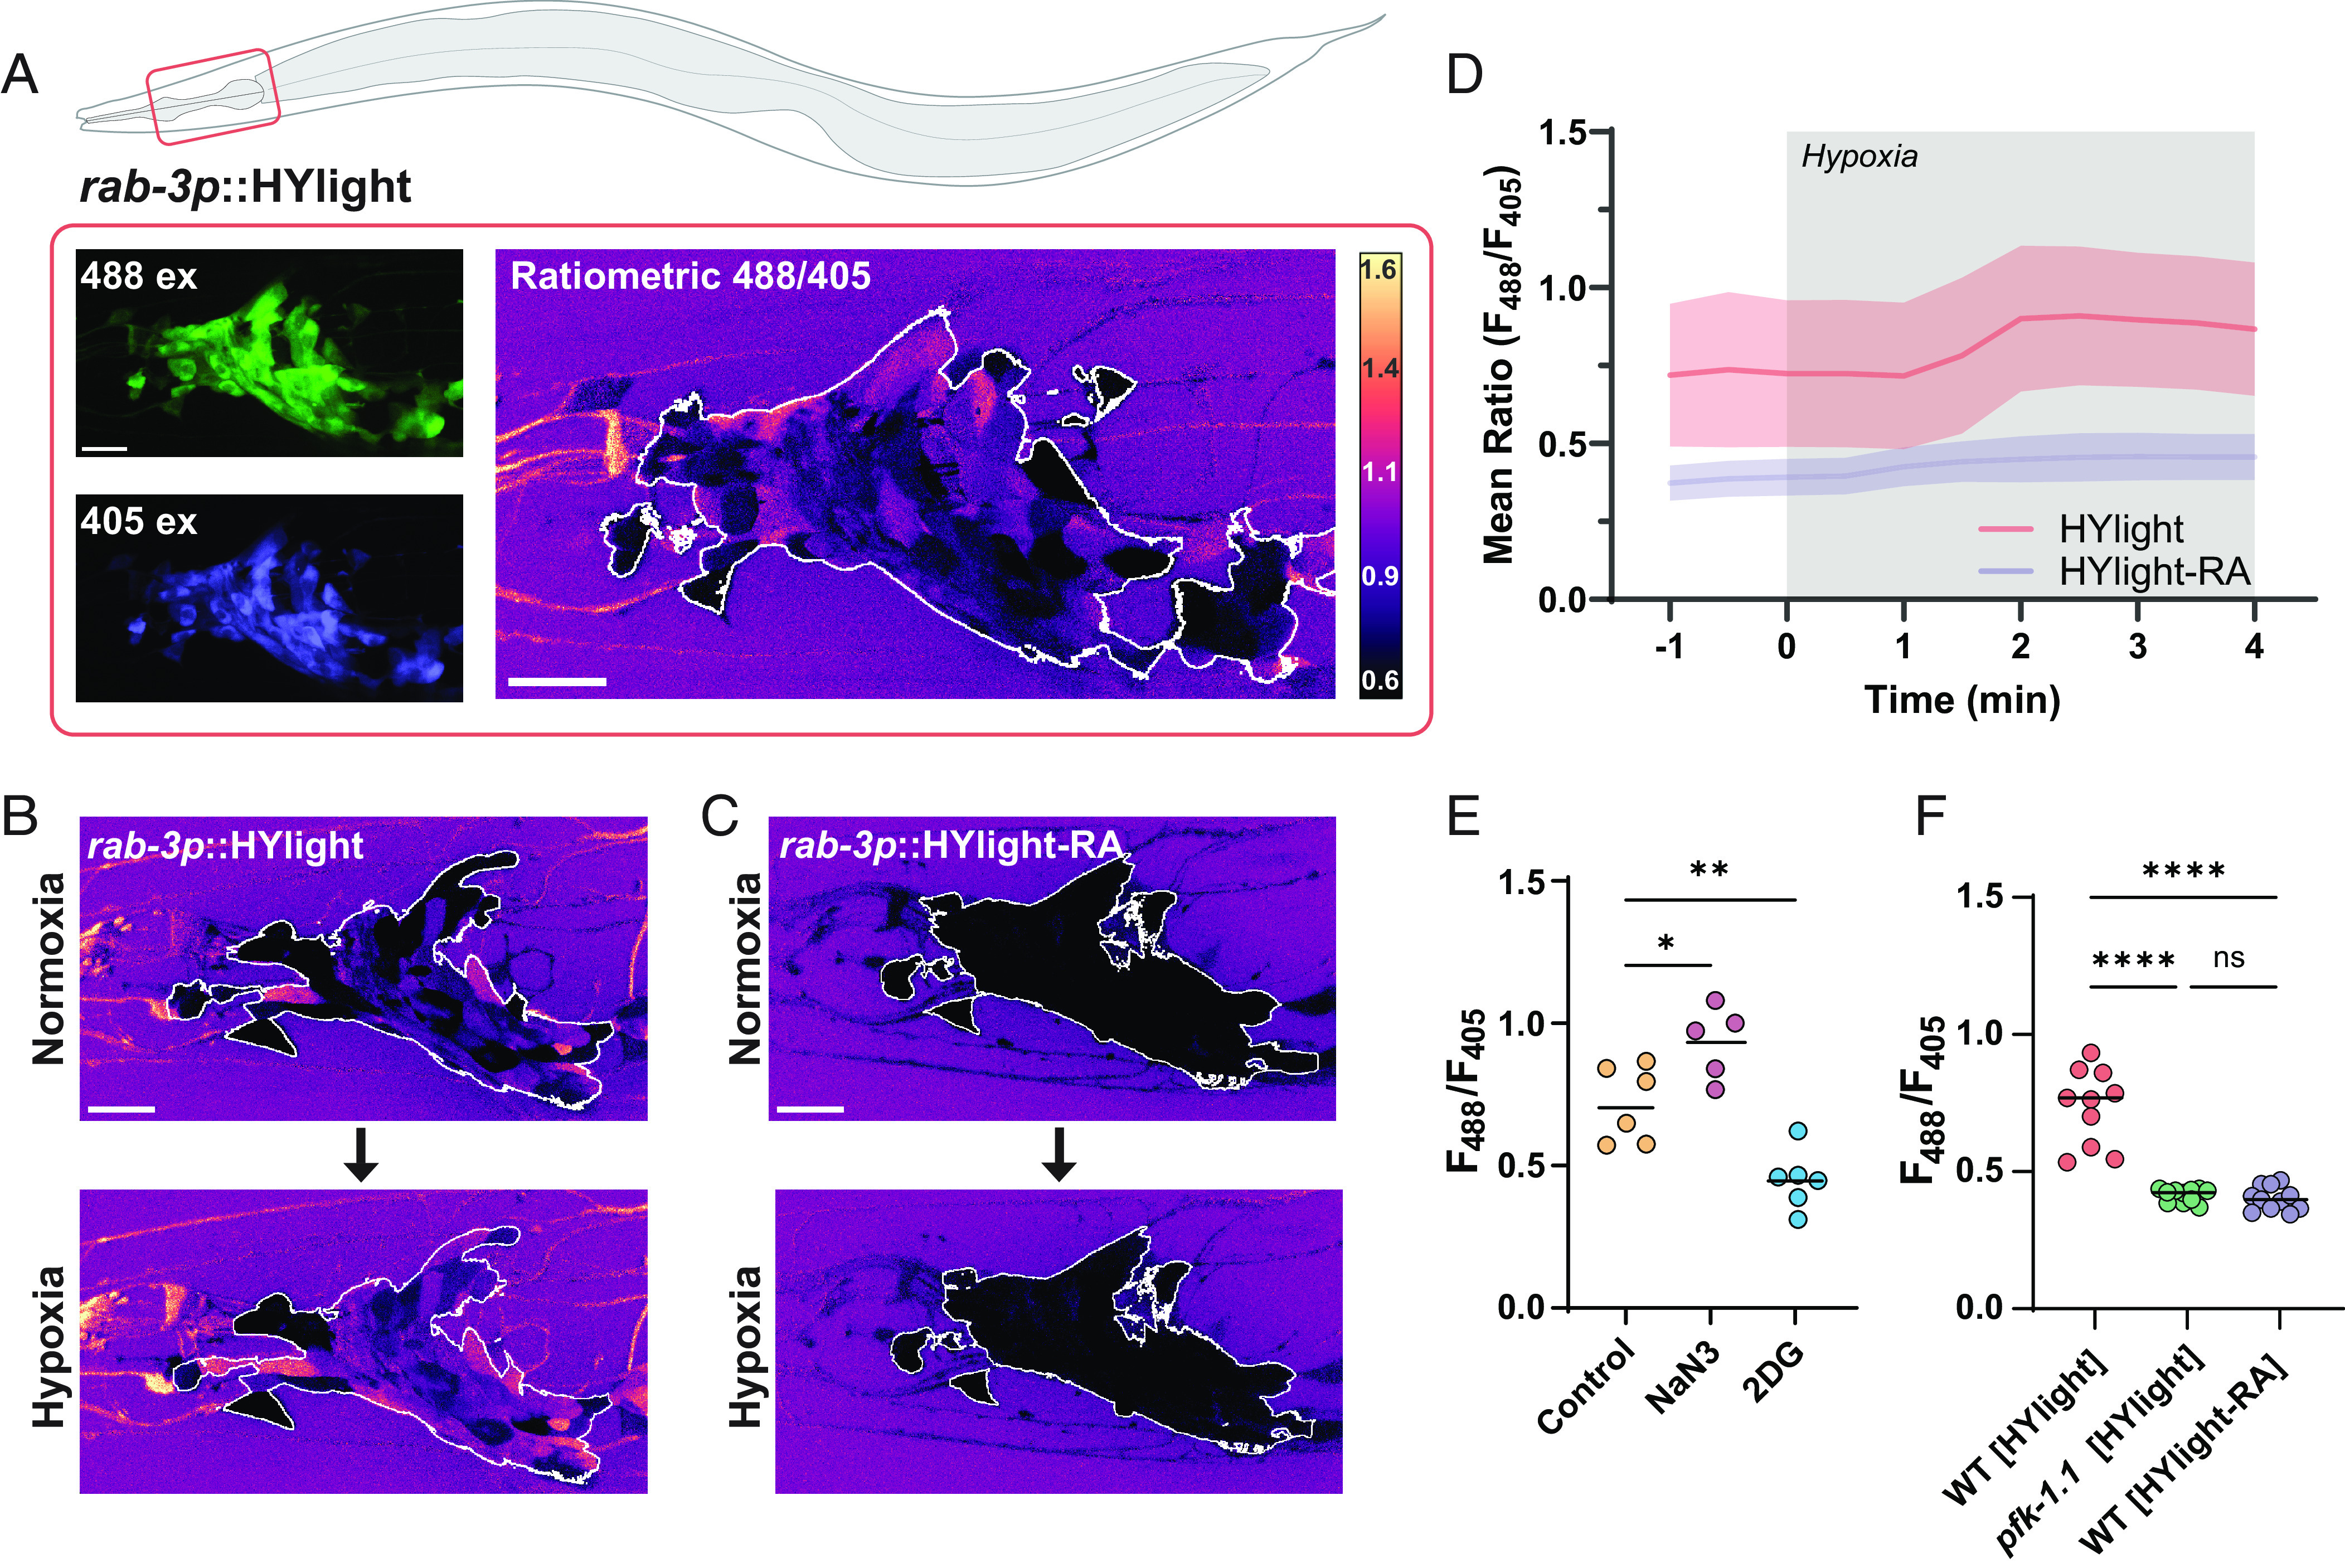
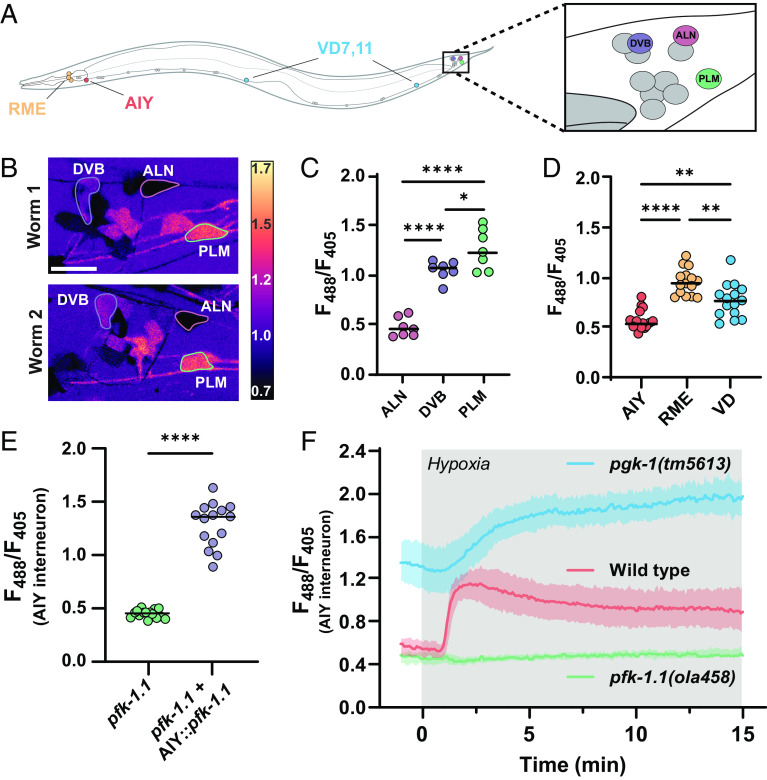
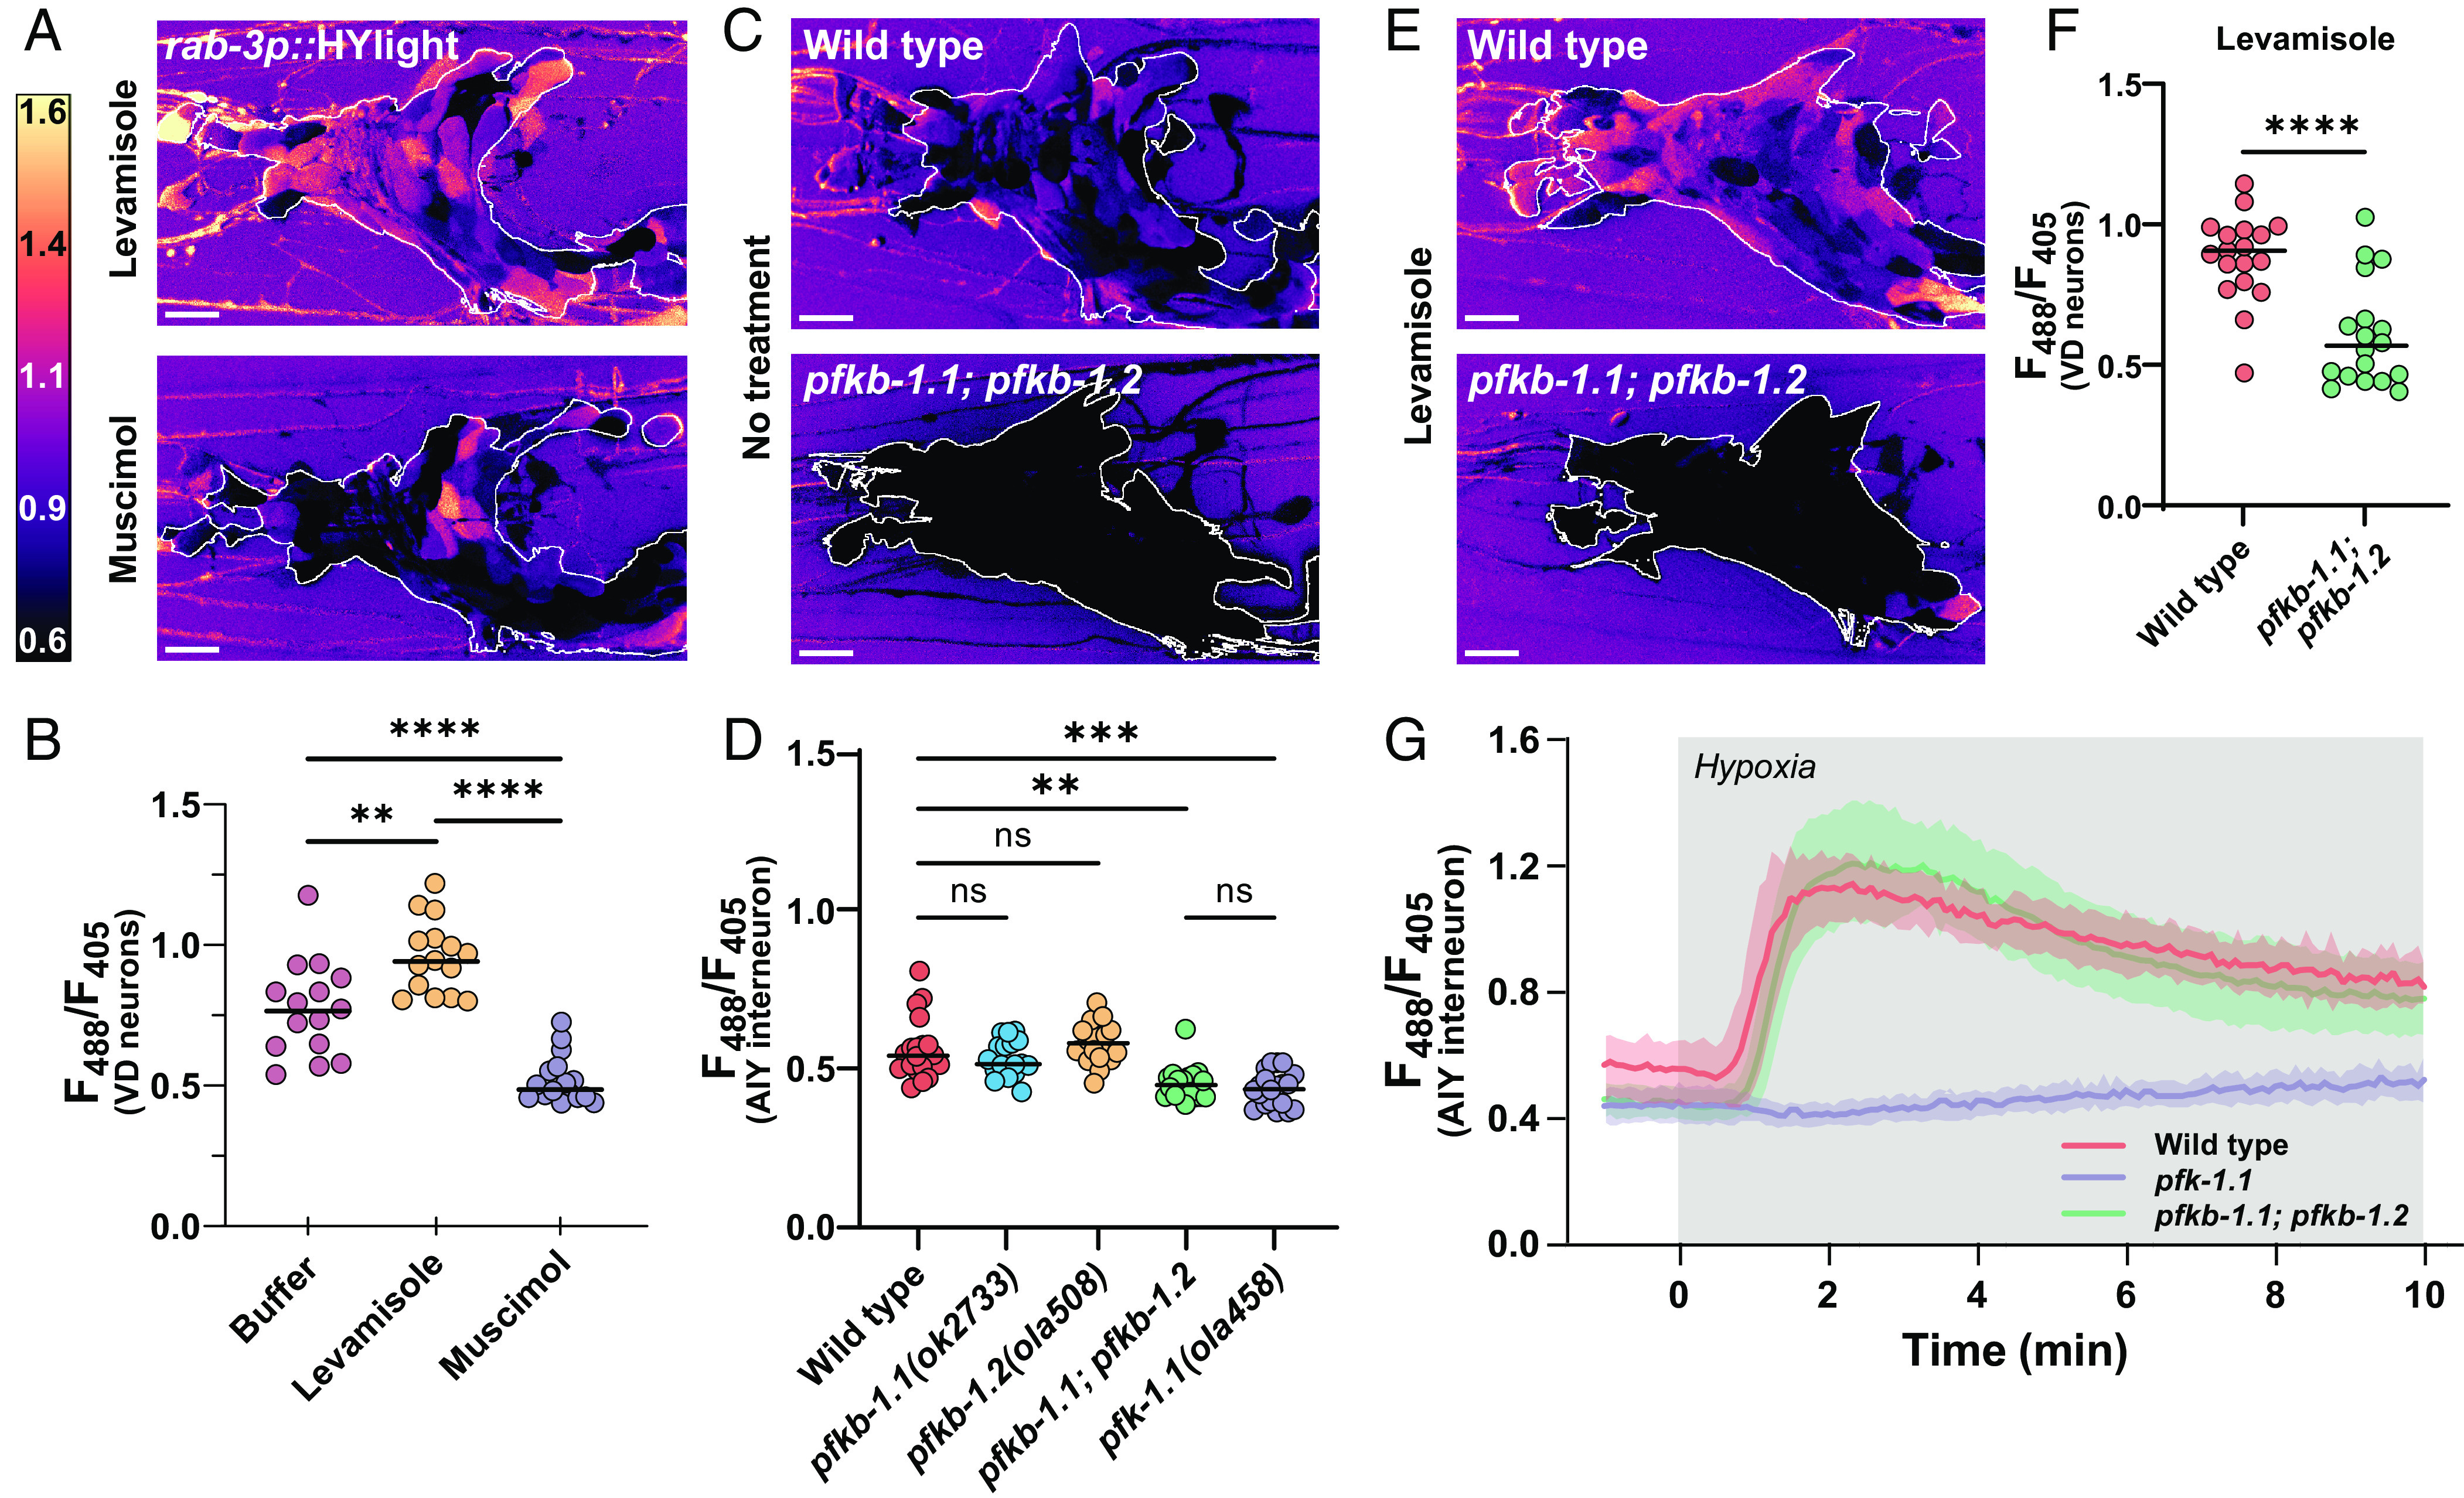
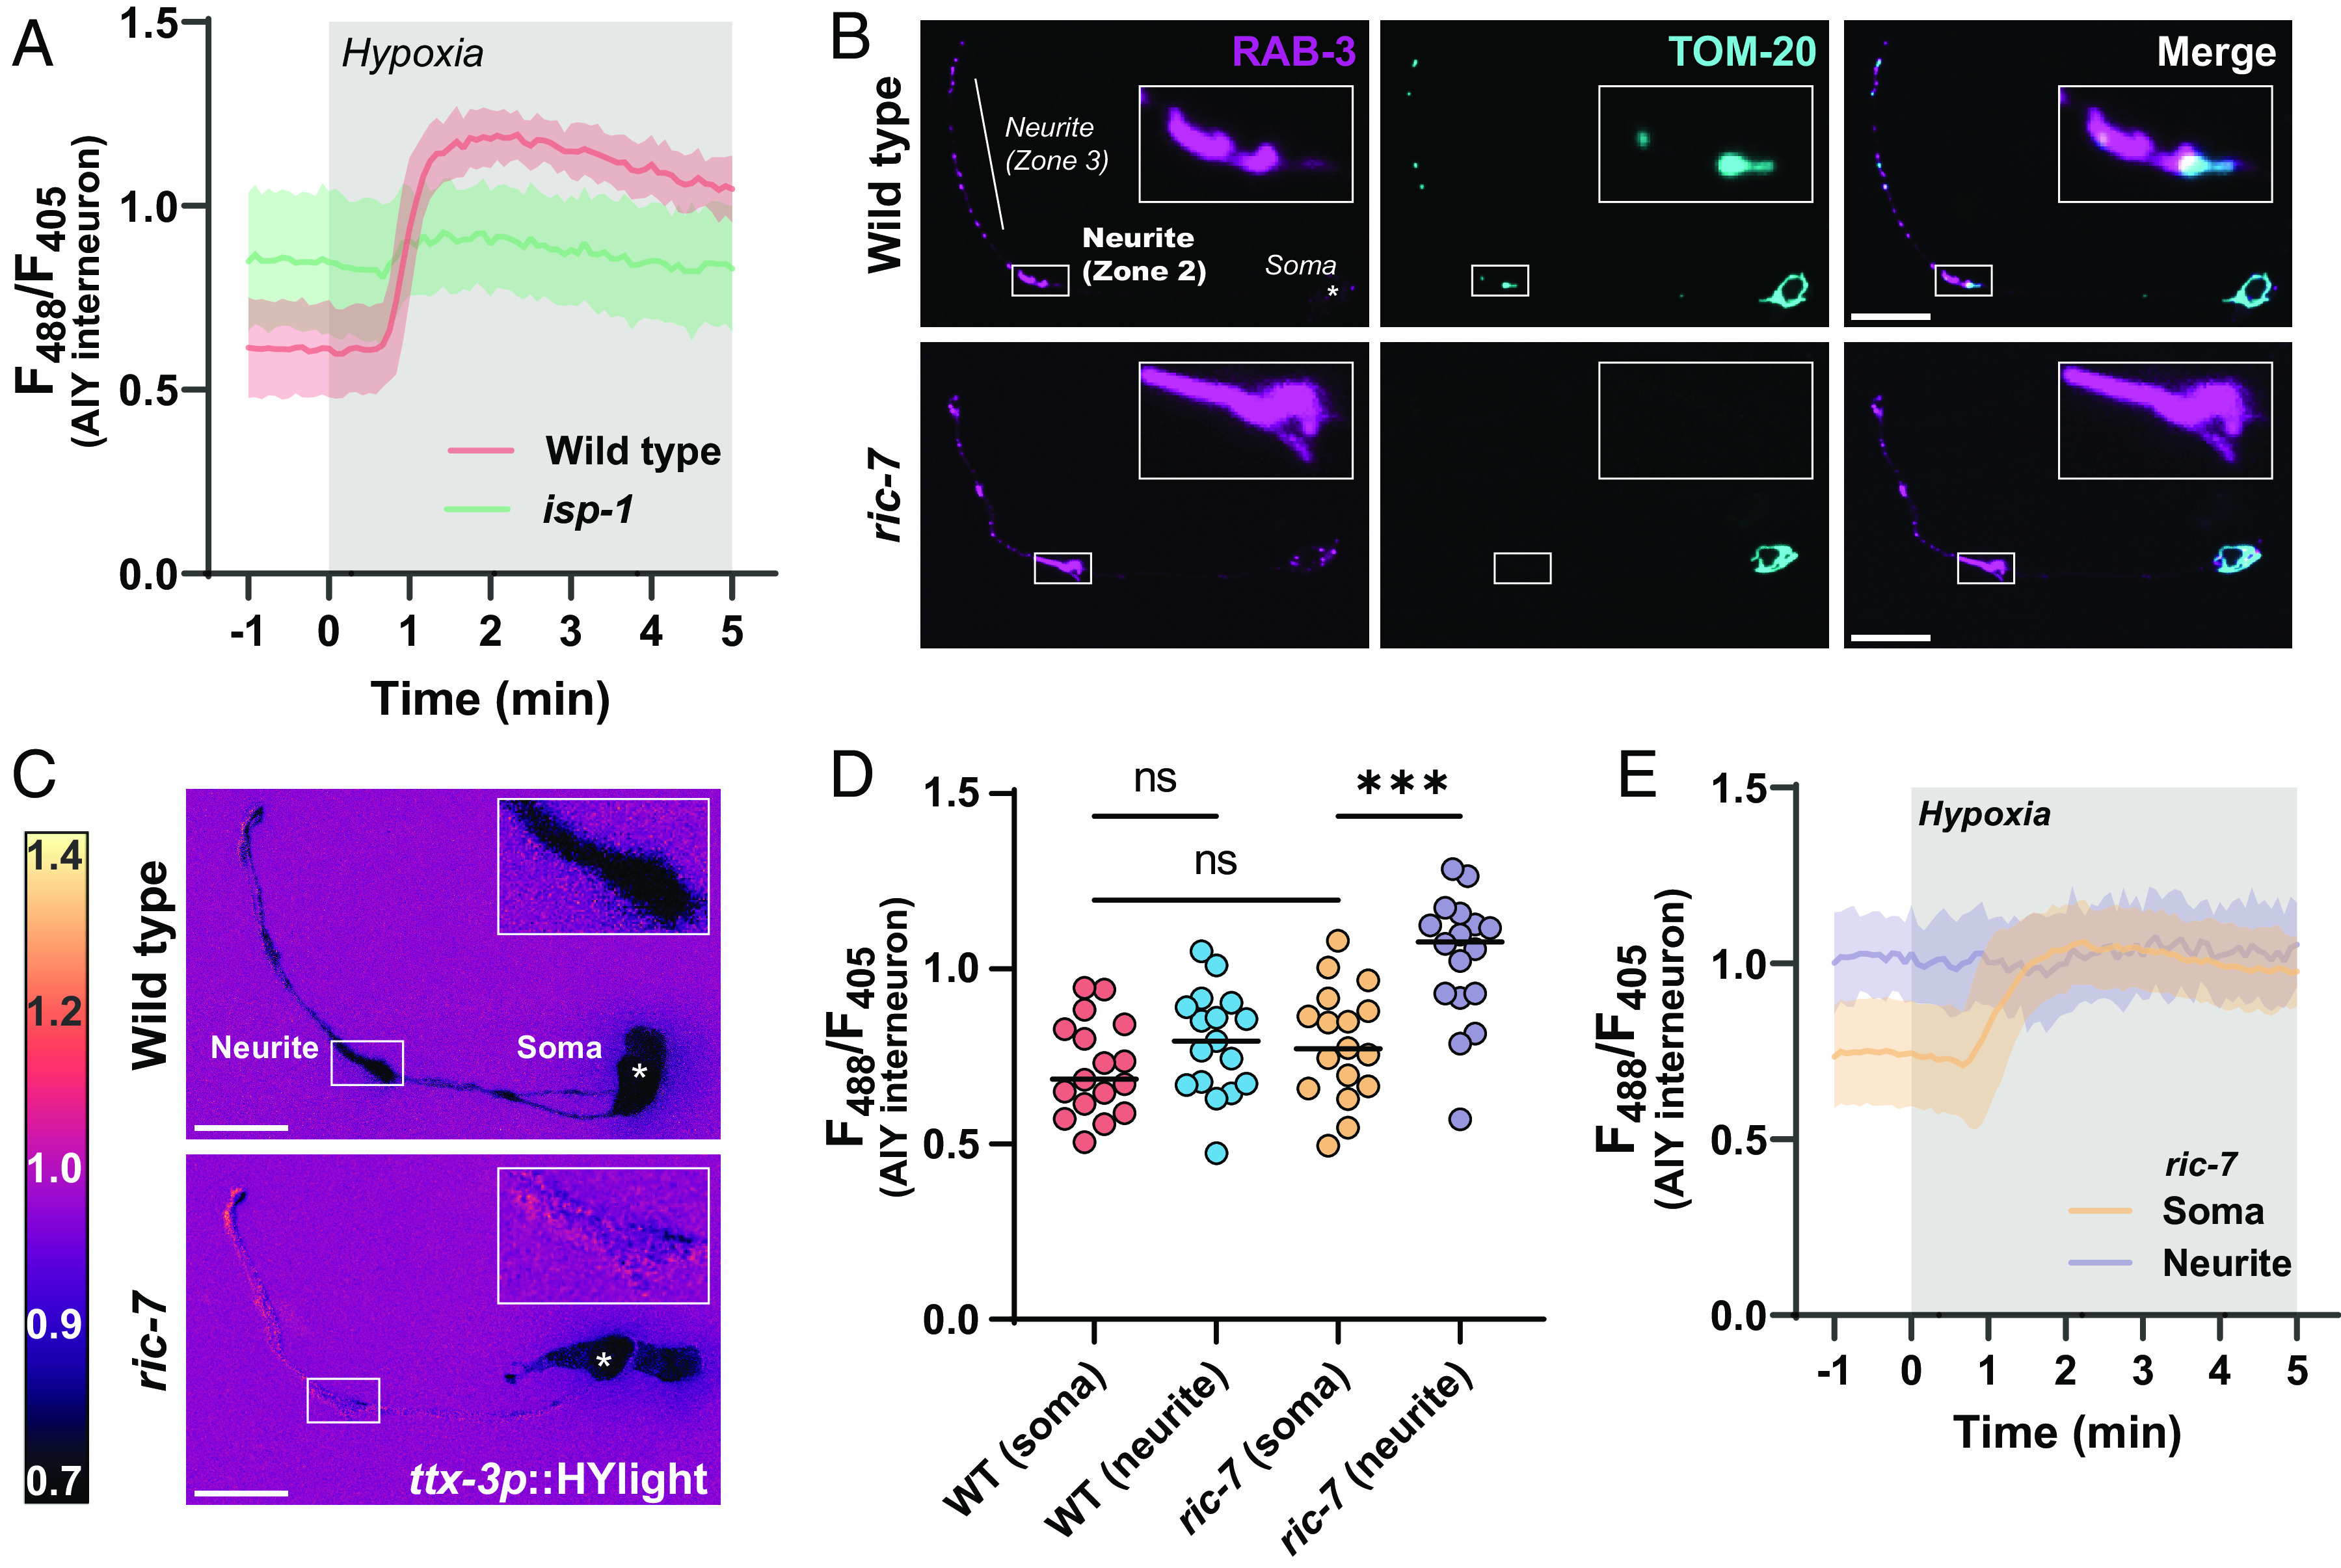
Energy metabolism supports neuronal function. While it is well established that changes in energy metabolism underpin brain plasticity and function, less is known about how individual neurons modulate their metabolic states to meet varying energy demands. This is because most approaches used to examine metabolism in living organisms lack the resolution to visualize energy metabolism within individual circuits, cells, or subcellular regions. Here, we adapted a biosensor for glycolysis, HYlight, for use in Caenorhabditis elegans to image dynamic changes in glycolysis within individual neurons and in vivo. We determined that neurons cell-autonomously perform glycolysis and modulate glycolytic states upon energy stress. By examining glycolysis in specific neurons, we documented a neuronal energy landscape comprising three general observations: 1) glycolytic states in neurons are diverse across individual cell types; 2) for a given condition, glycolytic states within individual neurons are reproducible across animals; and 3) for varying conditions of energy stress, glycolytic states are plastic and adapt to energy demands. Through genetic analyses, we uncovered roles for regulatory enzymes and mitochondrial localization in the cellular and subcellular dynamic regulation of glycolysis. Our study demonstrates the use of a single-cell glycolytic biosensor to examine how energy metabolism is distributed across cells and coupled to dynamic states of neuronal function and uncovers unique relationships between neuronal identities and metabolic landscapes in vivo.

Keywords: C. elegans; biosensor; energy metabolism; glycolysis; neurons.


Conflict of interest statement

Competing interests statement:The authors declare no competing interest.

Figures

Fig. 1.
Fig. 1.
Measurements of glycolytic dynamics in vivo in C. elegans neurons. (A) Schematic of C. elegans, with imaged region highlighted by red box. The imaged area corresponds to the nerve ring (brain) of the nematode. HYlight and HYlight-RA have two excitation wavelengths that vary according to the level of FBP (20). Ratiometric images depict the ratio of 488- to 405-nm excitation of the biosensor. (Scale bars, 10 μm.) The white outline depicts the ROI used for quantification. (B) Neuronal expression of HYlight (strain DCR8881) under normoxic (Top) conditions or after 2 min of hypoxic (Bottom) conditions. (C) As in (B), but expressing HYlight-RA, a variant with reduced affinity for FBP used as a control. (D) Quantification of the mean ratio for the nerve ring of each worm shown in (B) and (C). The gray region of the graph denotes the period in which the worms were exposed to hypoxic conditions, and the shaded region around graphed lines denotes the SD of the mean ratio at each time point. (E) Quantification of the HYlight ratio for worms treated with glucose (control), sodium azide (NaN3), or 2-deoxy-2-glucose (2DG) as described in Methods. Each dot corresponds to one worm; significance of * or ** denotes P values of 0.028 and 0.0051, respectively, as calculated by ANOVA with Tukey post hoc test. The horizontal bar corresponds to the mean. (F) Quantification of HYlight or HYlight-RA ratios in wild-type and pfk-1.1(ola458) mutant animals; significance represents P values < 0.0001 (WT vs. pfk-1.1 and WT [HYlight] vs. WT [HYlight-RA]), and 0.9481 (pfk-1.1 vs. WT [HYlight-RA]), as calculated by ANOVA with Tukey post hoc test.
Fig. 2.
Fig. 2.
Glycolytic profiles map onto neuronal identities in vivo. (A) Schematic of C. elegans with positions of individual, identifiable neurons characterized in this study labeled, including tail ganglia (highlighted with box on the Right) corresponding to images in (B). VD neurons were quantified using VD7 and VD11. (B) Pan-neuronally expressed HYlight, showing 488/405 nm ratio of excitation for neurons in the tail ganglia of two representative worms (worm 1, Top; worm 2, Bottom) under normoxic conditions, with identifiable neurons (DVB, ALN, and PLM) labeled. (Scale bar, 10 μm.) (C) As (B), but quantified for seven individual worms. Significance values of * or **** represent P values of 0.0299 or <0.0001, respectively, as calculated by ANOVA with Tukey post hoc test. (D) HYlight expressed via cell-specific promoters in either AIY (ttx-3p), or RME and VD neurons (unc-47p), with ratios quantified under normoxic conditions in 15 animals. Significance values are 0.0012 (AIY vs. VD), <0.0001 (AIY vs. RME), and 0.0018 (RME vs. VD) via ANOVA with Tukey post hoc test. (E) HYlight examined in AIY interneurons of pfk-1.1(ola458) mutant animals or with cell-specific expression of wild-type PFK in AIY in this same mutant. Significance values indicate P values of <0.0001 (****) as calculated by the unpaired t test for 15 animals. (F) HYlight responses in varying genetic backgrounds under transient hypoxia. There is an increase in glycolysis in wild-type worms within 2 min of hypoxia treatment (Movie S2). pfk-1.1(ola458) mutant animals start at lowered levels of HYlight signal (as compared to wild type) and fail to increase upon hypoxia. The loss-of-function mutation pgk-1(tm5613), an enzyme downstream in the glycolytic pathway (SI Appendix, Fig. S2), starts at an elevated level of FBP and increases further upon transient hypoxia. Shading represents the SD around mean values for 15 worms per treatment. Application of hypoxia treatment represented by gray box. Statistical analysis of hypoxia response is shown in SI Appendix, Fig. S2.
Fig. 3.
Fig. 3.
Neurons depend on PFKFB enzymes to modulate rates of glycolysis. (A) HYlight ratio of 488/405 nm excitation in the nerve ring of worms mounted in 10 mM levamisole (Top) or 50 mM muscimol (Bottom). The white outline depicts the ROI used for quantification. (Scale bar, 10 μm.) (B) Quantification of HYlight ratios in the VD neurons when worms are mounted in either M9 buffer, 10 mM levamisole, or 50 mM muscimol. Significance represents P values of 0.0013 (**) or <0.0001 (****), as calculated by ANOVA with Tukey post hoc test, for 15 animals. (C) HYlight ratios in the nerve ring of wild type (Top) or pfkb-1.1(ok2733); pfkb-1.2(ola508) double mutants (Bottom) mounted in M9 buffer. The quantified ROI is indicated by the white outline. Images of the single-mutant strains and quantification shown in SI Appendix, Fig. S3. (D) Quantification of HYlight responses for indicated genotypes in the AIY interneuron. Significance represents P values of 0.512 (WT vs. pfkb-1.1), >0.999 (WT vs. pfkb-1.2), 0.927 (WT vs. pfkb-1.1; pfkb-1.2), or <0.0001 (**), as calculated with ANOVA/Tukey post hoc test across 18 animals. (E) HYlight ratio in the nerve ring of wild-type and pfkb-1.1(ok2733); pfkb-1.2(ola508) double mutant animals exposed to 10 mM levamisole. The region used for quantification is indicated by the white outline. (F) HYlight ratios quantified for indicated genotypes in VD motor neurons in the presence of 10 mM levamisole. A P value of <0.0001 (****) is shown as calculated by the unpaired t test across 18 animals. (G) HYlight responses in the AIY interneuron for the indicated genotypes under transient hypoxia. The pfk-1.1(ola458) mutant animals do not increase upon hypoxia, whereas pfkb-1.1(ok2733); pfkb-1.2(ola508) double mutant animals, which start at a similar mean ratio as shown in (D), display responses to transient hypoxia that are indistinguishable from wild type. Shading represents the SD around mean values for 18 worms per treatment. Timing of hypoxia treatment represented by gray box. Significance of hypoxia response is shown in SI Appendix, Fig. S3.
Fig. 4.
Fig. 4.
Local regulation of glycolysis in neurons upon disruptions of mitochondria localization. (A) HYlight responses in a mutant of mitochondrial complex III, isp-1(qm150), and wild-type animals upon transient hypoxia in the AIY interneuron. There is elevated glycolysis in isp-1 mutant animals prior to hypoxia treatment, and these animals have reduced changes to glycolysis upon hypoxia compared to wild-type worms. The shaded region per each graphed line represents the SD of the mean of 11 animals; hypoxia treatment is highlighted in gray. Significance of hypoxia response is quantified in SI Appendix, Fig. S4. (B) Localization of synaptic vesicles (first column) and mitochondria (second column) in the AIY interneurons of wild-type (first row) and ric-7(n2657) mutants (second row). AIY has distinct synaptic regions in the neurite (19, 26), labeled as zone 2 (Inset) and zone 3, near which mitochondria localize in wild-type animals. In a mutant of the kinesin adapter protein ric-7, mitochondria are incapable of localizing to synapses and are only found within the cell body, consistent with prior work (27, 28). (Scale bar, 10 μm.) (C) HYlight responses in wild-type (Top) and ric-7(n2657) mutant animals (Bottom) in the AIY interneurons under normoxic conditions. In ric-7 mutants, zone 2 of the neurite (Inset) has a distinctly higher ratio compared to the cell soma, whereas these two regions are similar in wild-type worms. (D) Quantification of the HYlight ratio in different subcellular regions of AIY interneurons of wild-type and ric-7(n2657) mutant animals. P values shown are 0.5568 (WT soma vs. neurite), 0.5835 (WT soma vs. ric-7 soma), and 0.0002 (ric-7 soma vs. neurite) as calculated by ANOVA with Tukey post hoc test for 17 animals. (E) Subcellular responses to transient hypoxia in AIY interneurons in ric-7(n2657) mutant animals. The synaptic regions of AIY have elevated glycolysis prior to hypoxic treatment and do not respond upon treatment; the cell soma responds to hypoxia. Shading on each graphed line represents the SD of the mean for 13 animals; timing of hypoxia treatment is shown as the gray box. Significance comparisons are shown in SI Appendix, Fig. S4.

Update of

References

    1. Fox P. T., Raichle M. E., Mintun M. A., Dence C., Nonoxidative glucose consumption during focal physiologic neural activity. Science 241, 462–464 (1988). - PubMed
    1. Kwong K. K., et al. , Dynamic magnetic resonance imaging of human brain activity during primary sensory stimulation. Proc. Natl. Acad. Sci. U.S.A. 89, 5675–5679 (1992). - PMC - PubMed
    1. Phelps M. E., et al. , Tomographic measurement of local cerebral glucose metabolic rate in humans with (F-18)2-fluoro-2-deoxy-D-glucose: Validation of method. Ann. Neurol. 6, 371–388 (1979). - PubMed
    1. Logothetis N. K., Pauls J., Augath M., Trinath T., Oeltermann A., Neurophysiological investigation of the basis of the fMRI signal. Nature 412, 150–157 (2001). - PubMed
    1. Hahn A., et al. , Reconfiguration of functional brain networks and metabolic cost converge during task performance. eLife 9, e52443 (2020). - PMC - PubMed