. 2024 Jan 16;121(3):e2311885121.
doi: 10.1073/pnas.2311885121. Epub 2024 Jan 10.

Neural heterogeneity controls computations in spiking neural networks

Affiliations

Neural heterogeneity controls computations in spiking neural networks

Richard Gast et al. Proc Natl Acad Sci U S A. .

Abstract

The brain is composed of complex networks of interacting neurons that express considerable heterogeneity in their physiology and spiking characteristics. How does this neural heterogeneity influence macroscopic neural dynamics, and how might it contribute to neural computation? In this work, we use a mean-field model to investigate computation in heterogeneous neural networks, by studying how the heterogeneity of cell spiking thresholds affects three key computational functions of a neural population: the gating, encoding, and decoding of neural signals. Our results suggest that heterogeneity serves different computational functions in different cell types. In inhibitory interneurons, varying the degree of spike threshold heterogeneity allows them to gate the propagation of neural signals in a reciprocally coupled excitatory population. Whereas homogeneous interneurons impose synchronized dynamics that narrow the dynamic repertoire of the excitatory neurons, heterogeneous interneurons act as an inhibitory offset while preserving excitatory neuron function. Spike threshold heterogeneity also controls the entrainment properties of neural networks to periodic input, thus affecting the temporal gating of synaptic inputs. Among excitatory neurons, heterogeneity increases the dimensionality of neural dynamics, improving the network's capacity to perform decoding tasks. Conversely, homogeneous networks suffer in their capacity for function generation, but excel at encoding signals via multistable dynamic regimes. Drawing from these findings, we propose intra-cell-type heterogeneity as a mechanism for sculpting the computational properties of local circuits of excitatory and inhibitory spiking neurons, permitting the same canonical microcircuit to be tuned for diverse computational tasks.

Keywords: heterogeneity; mean-field models; neural computation; neural dynamics; recurrent neural networks.


Conflict of interest statement

Competing interests statement:The authors declare no competing interest.

Figures

Fig. 1.
Fig. 1.
Heterogeneity linearizes neural population dynamics. (AD) Two-dimensional (2D) bifurcation diagrams are depicted for different cell types. Regions colored in gray and green depict bistable and oscillatory regimes, respectively. The black and orange crosses depict approximate bifurcation points, estimated from the dynamics of simulated SNNs with a Lorentzian and a Gaussian distribution of the spiking thresholds, respectively. Spiking neural network dynamics were obtained from simulating networks of N = 1,000 neurons connected by sparse, random couplings (coupling probability of 20%) The y-axis on the Left (Right) depicts the width of the Lorentzian (Gaussian) distribution used to generate the SNNs that result on the bifurcation points shown by the black (orange) crosses. (A) Excitatory regular-spiking neurons with low spike-frequency adaptation (κrs=10 pA). (B) Excitatory regular-spiking neurons with high spike-frequency adaptation (κrs=100 pA). (C) Inhibitory fast-spiking neurons. (D) Inhibitory low-threshold-spiking neurons.
Fig. 2.
Fig. 2.
Homogeneous inhibitory interneurons overwrite the bifurcation structure of excitatory neurons. 2D bifurcation diagrams: Regions colored in gray and green depict bistable and oscillatory regimes, respectively. The black and red stars indicate the value of the input current used during low input (white, t<750 ms and t>2,000 ms) and high input (gray-blue, 750 ms <t<2,000 ms) regimes, respectively. The effect of low and high inputs in the firing dynamics is shown in the third column. (A and B) 2D bifurcation diagrams for a single population of regular-spiking neurons (RS) with weak (κrs=10 pA) and strong (κrs=100 pA) spike frequency adaptation, respectively. (C and D) Firing dynamics of the RS population with weak (C) vs strong (D) spike frequency adaptation. Spiking dynamics were obtained from a network with N = 2,000 neurons with sparse, random coupling (coupling probability of 20%). (E and F) 2D bifurcation diagrams for a two-population network of regular-spiking and fast-spiking (FS) neurons with high FS neuron heterogeneity. The bifurcation diagrams resemble those of the one-population model (compare to A and B). Note that the direction of the x-axis is flipped in comparison to A and B, to account for the fact that increases in Irs excite the RS population, whereas increases in Ifs cause inhibition of the RS population due to the inhibitory nature of the FS-to-RS projection. The input to the RS population was fixed at Irs=60 pA. (G and H) RS firing dynamics in the two-population model with high FS neuron heterogeneity, which closely resembles that of the single population model (compare to C and D). Spiking dynamics were obtained from simulations of a network of N = 2,000 RS neurons and N = 2,000 FS neurons with sparse, random coupling (coupling probability of 20%). (I and J) Same as E and F but for low FS neuron heterogeneity. (K and L) Same as G and H but for low FS neuron heterogeneity.
Fig. 3.
Fig. 3.
Spike threshold heterogeneity impairs the retention of spatially localized activity in a ring network. (A) 2D bifurcation diagram of the regular-spiking neuron population (same as in Fig. 2A). Vertical lines indicate the input drive to the network at baseline (gray, Irs=30 pA) and during extrinsic stimulation (blue, Irs=60 pA). The inset shows the structure of the ring network; the stimulated section of the ring is shown in blue. (B and C) Spiking activity as a function of time for an homogeneous and an heterogeneous network, respectively; the simulated networks consist of N = 2,000 neurons with sparse coupling (20%). The blue-shaded regions show the application of a rectangular pulse of extrinsic stimulation to a ring segment whose width is pin=0.25 of the length of the ring. The orange-shaded region depicts the asymptotic time interval used to compute the average neural activity shown in (DG). (D and E) Persistent activity of each neuron along the ring during the orange-shaded test interval depicted in (B and C). Results are shown as a function of the width pin of the input stimulation. The neural activity is normalized to the maximum observed spike rate and averaged over 10 random initializations of the network. The blue vertical lines in each row delimit the section of the network that received extrinsic input. (F) Root mean squared error between the activity of the network during the application of the extrinsic input and the activity of the network during the test interval, as a function of both input width pin and degree of population heterogeneity Δrs. (G) Normalized spiking activity during the test interval, averaged over the neurons that did not receive extrinsic stimulation.
Fig. 4.
Fig. 4.
Spike threshold heterogeneity affects the function generation properties of spiking neural networks. (A) Reservoir computing architecture used for function generation. A pulse is fed into a recurrent neural network and a linear readout is trained to minimize the mean squared error between a target time-dependent function and a network output obtained as a linear combination of the stimulus-evoked neural dynamics within the network. (B) 2D bifurcation diagram of the regular-spiking neuron population (same as in Fig. 2B). The vertical dashed lines mark the three different dynamical regimes for which the results in (CE) are depicted: Irs=45 pA, Irs=55 pA, and Irs=70 pA. The height of these lines indicates the range of values of Δrs for which the results in (CE) were obtained. (C) Mean squared error between the network readout signal and the target signal, averaged over time and across all trials of the test dataset. (D) Dimensionality d of the network dynamics, calculated from spike train correlations between neurons in the network. (E) Normalized variance of the network response kernel averaged over trials indicates the reliability of the function generation capacities of the network. See the Materials and Methods, Section D for a detailed explanation of how the quantities depicted in (CE) were calculated. Vertical lines shown in (CE) depict the SD across trials.
Fig. 5.
Fig. 5.
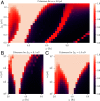
Spike threshold heterogeneity affects the entrainment properties of a network of spiking neurons. (A) Coherence between a sinusoidal driving signal of strength α=4 pA and the fluctuations in the average firing activity r of the network as a function of the driving frequency ω and the neural heterogeneity Δrs. (B) Coherence between a sinusoidal driving signal and the fluctuations of the average firing activity r for an homogeneous network (Δrs=0.1 mV) as a function of the driving frequency ω and driving strength α. (C) Same as B but for a heterogeneous network (Δrs=1.0 mV).

References

    1. Abbott L. F., Sejnowski T. J., Neural Codes and Distributed Representations: Foundations of Neural Computation (MIT Press, 1999).
    1. Krishnamurthy K., Can T., Schwab D. J., Theory of gating in recurrent neural networks. Phys. Rev. X 12, 011011 (2022). - PMC - PubMed
    1. H. Jaeger, B. Noheda, W. G. van der Wiel, Toward a formal theory for computing machines made out of whatever physics offers. Nat. Commun. 14, 4911 (2023). - PMC - PubMed
    1. Izhikevich E., Simple model of spiking neurons. IEEE Trans. Neural Netw. 14, 1569–1572 (2003). - PubMed
    1. K. D. Harris, G. M. G. Shepherd, The neocortical circuit: Themes and variations. Nat. Neurosci. 18, 170–181 (2015). - PMC - PubMed

LinkOut - more resources