Molecular profiling of human substantia nigra identifies diverse neuron types associated with vulnerability in Parkinson's disease
- PMID: 38198537
- PMCID: PMC10780895
- DOI: 10.1126/sciadv.adi8287
Molecular profiling of human substantia nigra identifies diverse neuron types associated with vulnerability in Parkinson's disease
Abstract
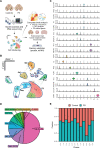
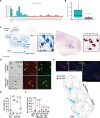
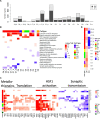
Parkinson's disease (PD) is characterized pathologically by the loss of dopaminergic (DA) neurons in the substantia nigra (SN). Whether cell types beyond DA neurons in the SN show vulnerability in PD remains unclear. Through transcriptomic profiling of 315,867 high-quality single nuclei in the SN from individuals with and without PD, we identified cell clusters representing various neuron types, glia, endothelial cells, pericytes, fibroblasts, and T cells and investigated cell type-dependent alterations in gene expression in PD. Notably, a unique neuron cluster marked by the expression of RIT2, a PD risk gene, also displayed vulnerability in PD. We validated RIT2-enriched neurons in midbrain organoids and the mouse SN. Our results demonstrated distinct transcriptomic signatures of the RIT2-enriched neurons in the human SN and implicated reduced RIT2 expression in the pathogenesis of PD. Our study sheds light on the diversity of cell types, including DA neurons, in the SN and the complexity of molecular and cellular changes associated with PD pathogenesis.
Figures


Similar articles
-
Cav1.3 channels control D2-autoreceptor responses via NCS-1 in substantia nigra dopamine neurons.Brain. 2014 Aug;137(Pt 8):2287-302. doi: 10.1093/brain/awu131. Epub 2014 Jun 16. Brain. 2014. PMID: 24934288 Free PMC article.
-
Lower Affinity of Isradipine for L-Type Ca2+ Channels during Substantia Nigra Dopamine Neuron-Like Activity: Implications for Neuroprotection in Parkinson's Disease.J Neurosci. 2017 Jul 12;37(28):6761-6777. doi: 10.1523/JNEUROSCI.2946-16.2017. Epub 2017 Jun 7. J Neurosci. 2017. PMID: 28592699 Free PMC article.
-
Repulsive Guidance Molecule a (RGMa) Induces Neuropathological and Behavioral Changes That Closely Resemble Parkinson's Disease.J Neurosci. 2017 Sep 27;37(39):9361-9379. doi: 10.1523/JNEUROSCI.0084-17.2017. Epub 2017 Aug 21. J Neurosci. 2017. PMID: 28842419 Free PMC article.
-
Converging roles of ion channels, calcium, metabolic stress, and activity pattern of Substantia nigra dopaminergic neurons in health and Parkinson's disease.J Neurochem. 2016 Oct;139 Suppl 1(Suppl Suppl 1):156-178. doi: 10.1111/jnc.13572. Epub 2016 Mar 23. J Neurochem. 2016. PMID: 26865375 Free PMC article. Review.
-
[Altered dopamine metabolism and its role in pathogenesis of Parkinson's disease].Sheng Li Xue Bao. 2021 Feb 25;73(1):89-102. Sheng Li Xue Bao. 2021. PMID: 33665664 Review. Chinese.
Cited by
-
Are oligodendrocytes bystanders or drivers of Parkinson's disease pathology?PLoS Biol. 2025 Jan 8;23(1):e3002977. doi: 10.1371/journal.pbio.3002977. eCollection 2025 Jan. PLoS Biol. 2025. PMID: 39777410 Free PMC article.
-
Microglia: roles and genetic risk in Parkinson's disease.Front Neurosci. 2024 Nov 1;18:1506358. doi: 10.3389/fnins.2024.1506358. eCollection 2024. Front Neurosci. 2024. PMID: 39554849 Free PMC article. Review.
-
Knowledge-guided Contextual Gene Set Analysis Using Large Language Models.ArXiv [Preprint]. 2025 Jun 4:arXiv:2506.04303v1. ArXiv. 2025. PMID: 40503027 Free PMC article. Preprint.
-
A Reproducibility Focused Meta-Analysis Method for Single-Cell Transcriptomic Case-Control Studies Uncovers Robust Differentially Expressed Genes.bioRxiv [Preprint]. 2025 Jun 11:2024.10.15.618577. doi: 10.1101/2024.10.15.618577. bioRxiv. 2025. PMID: 39463993 Free PMC article. Preprint.
-
Interactions of Oligodendrocyte Precursor Cells and Dopaminergic Neurons in the Mouse Substantia Nigra.J Neurochem. 2025 Jan;169(1):e16298. doi: 10.1111/jnc.16298. J Neurochem. 2025. PMID: 39871627 Free PMC article.
References
-
- Nalls M. A., Blauwendraat C., Vallerga C. L., Heilbron K., Bandres-Ciga S., Chang D., Tan M., Kia D. A., Noyce A. J., Xue A., Bras J., Young E., von Coelln R., Simón-Sánchez J., Schulte C., Sharma M., Krohn L., Pihlstrøm L., Siitonen A., Iwaki H., Leonard H., Faghri F., Gibbs J. R., Hernandez D. G., Scholz S. W., Botia J. A., Martinez M., Corvol J.-C., Lesage S., Jankovic J., Shulman L. M., Sutherland M., Tienari P., Majamaa K., Toft M., Andreassen O. A., Bangale T., Brice A., Yang J., Gan-Or Z., Gasser T., Heutink P., Shulman J. M., Wood N. W., Hinds D. A., Hardy J. A., Morris H. R., Gratten J., Visscher P. M., Graham R. R., Singleton A. B.; 23andMe Research Team; System Genomics of Parkinson’s Disease Consortium; International Parkinson’s Disease Genomics Consortium , Identification of novel risk loci, causal insights, and heritable risk for Parkinson’s disease: A meta-analysis of genome-wide association studies. Lancet Neurol. 18, 1091–1102 (2019). - PMC - PubMed
-
- Chang D., Nalls M. A., Hallgrímsdóttir I. B., Hunkapiller J., van der Brug M., Cai F., Kerchner G. A., Ayalon G., Bingol B., Sheng M., Hinds D., Behrens T. W., Singleton A. B., Bhangale T. R., Graham R. R., A meta-analysis of genome-wide association studies identifies 17 new Parkinson’s disease risk loci. Nat. Genet. 49, 1511–1516 (2017). - PMC - PubMed
Publication types
MeSH terms
Grants and funding
- P20 NS123220/NS/NINDS NIH HHS/United States
- T32 AG049688/AG/NIA NIH HHS/United States
- U01 AG046170/AG/NIA NIH HHS/United States
- R01 NS114239/NS/NINDS NIH HHS/United States
- K01 AG078442/AG/NIA NIH HHS/United States
- R01 NS086736/NS/NINDS NIH HHS/United States
- K01 AG070326/AG/NIA NIH HHS/United States
- R21 NS109895/NS/NINDS NIH HHS/United States
- R01 NS060123/NS/NINDS NIH HHS/United States
- R01 NS095252/NS/NINDS NIH HHS/United States
- T32 MH087004/MH/NIMH NIH HHS/United States
- R01 AG072520/AG/NIA NIH HHS/United States
- R01 AG054008/AG/NIA NIH HHS/United States
- MRC_/Medical Research Council/United Kingdom
LinkOut - more resources
Full Text Sources
Medical
Molecular Biology Databases

