. 2024 Jan 12;10(2):eadh3929.
doi: 10.1126/sciadv.adh3929. Epub 2024 Jan 10.

RREB1 regulates neuronal proteostasis and the microtubule network

Affiliations

RREB1 regulates neuronal proteostasis and the microtubule network

Emily N Griffin et al. Sci Adv. .

Abstract

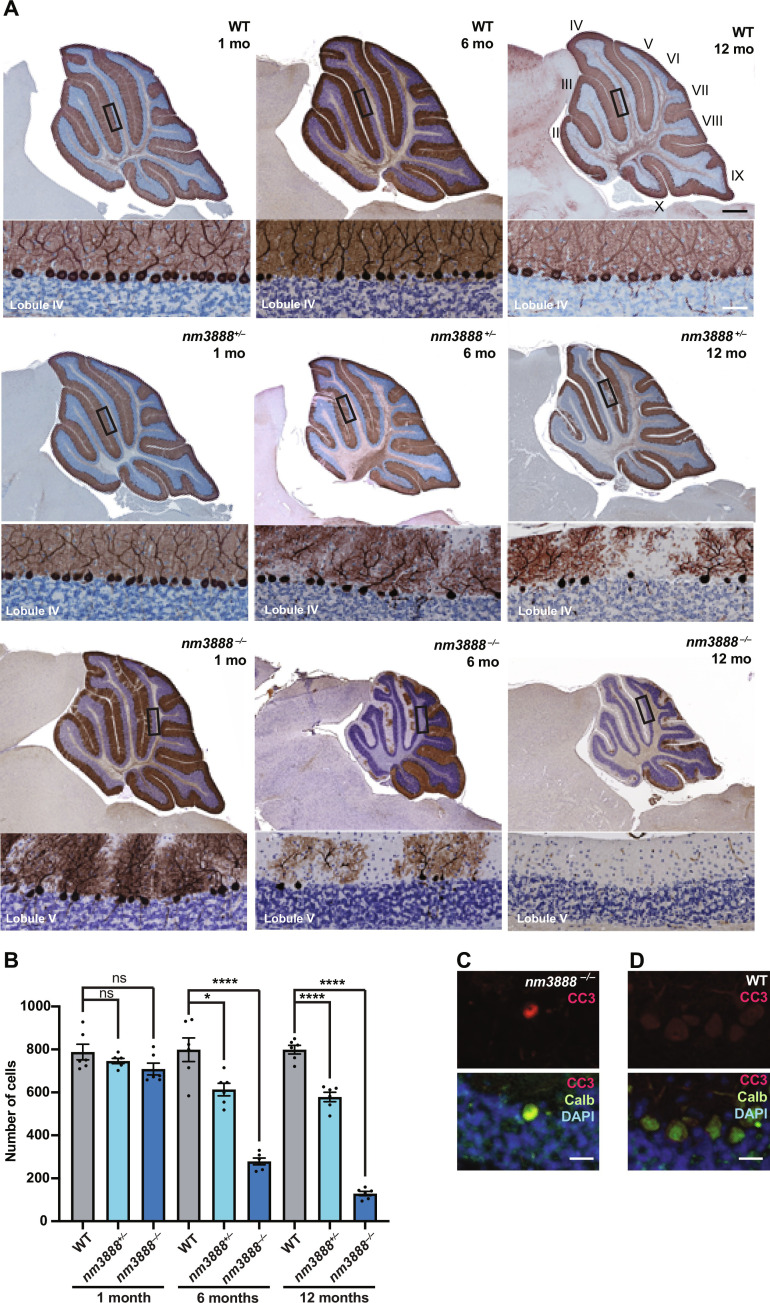
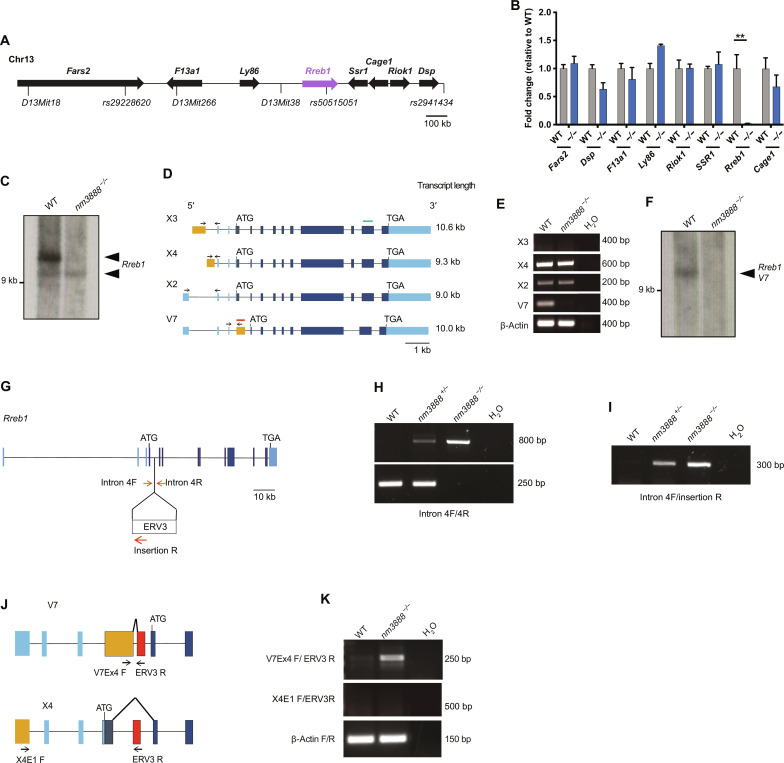
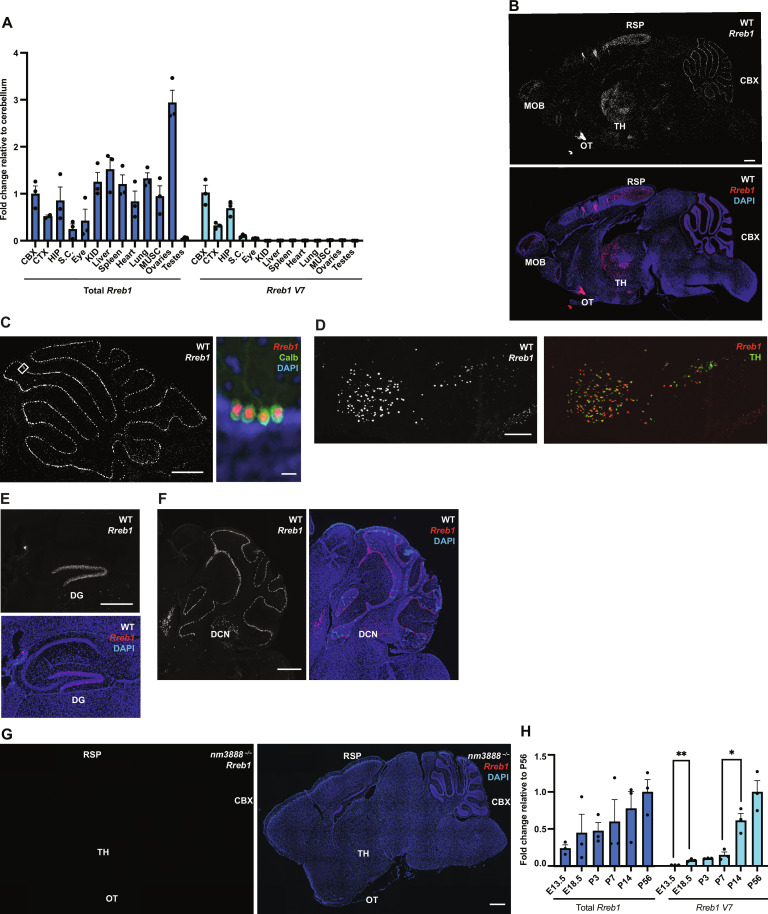
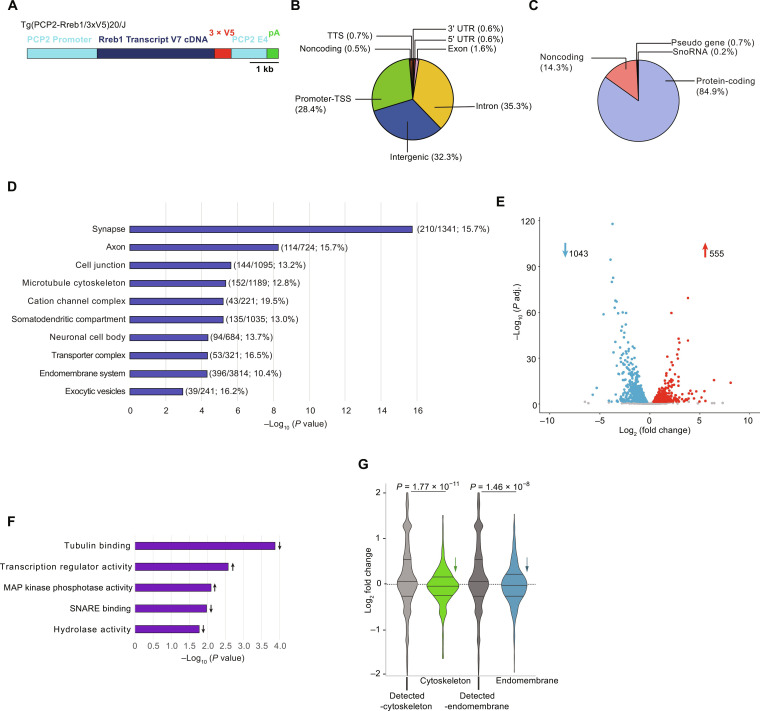
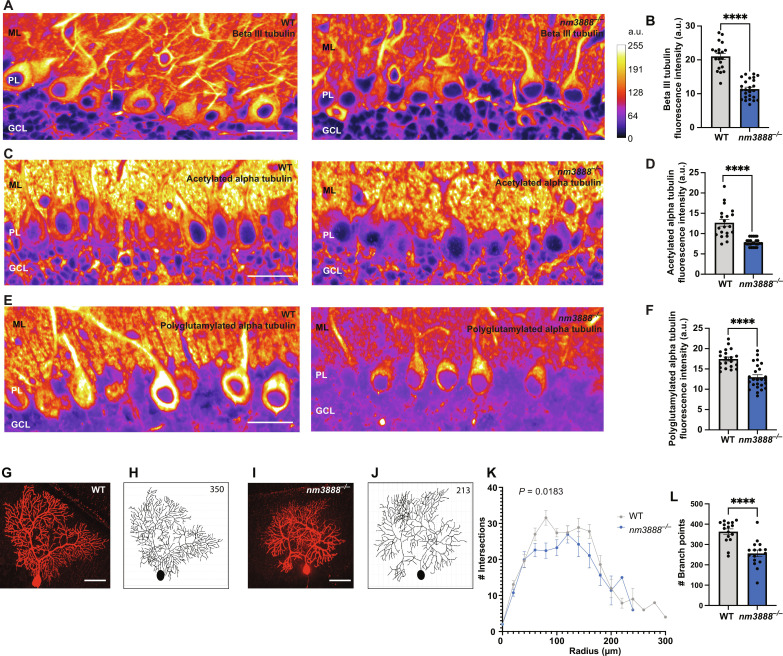
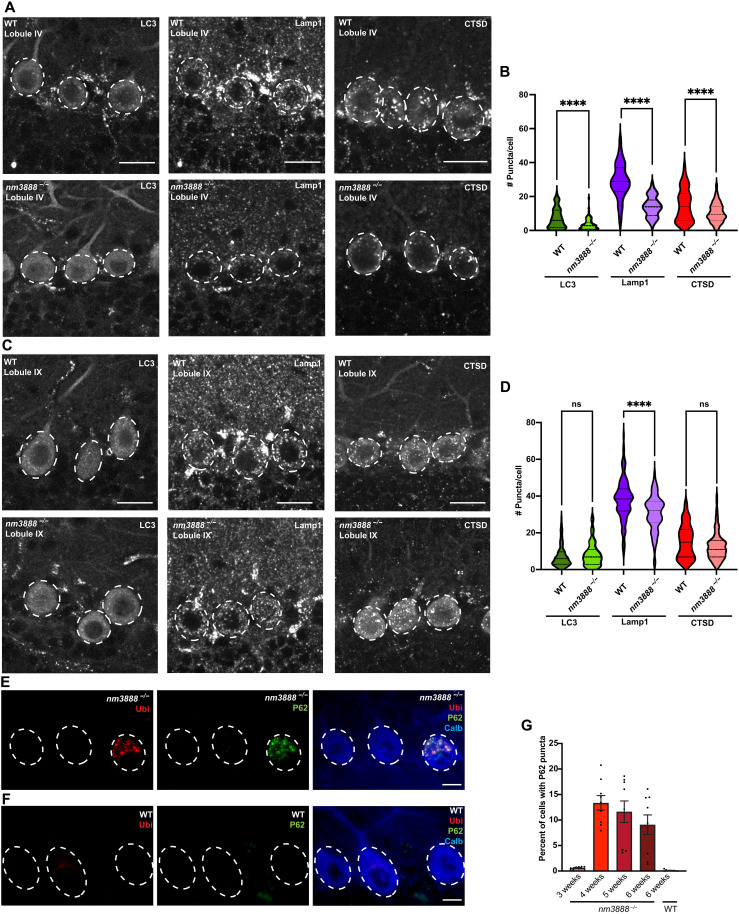
Transcription factors play vital roles in neuron development; however, little is known about the role of these proteins in maintaining neuronal homeostasis. Here, we show that the transcription factor RREB1 (Ras-responsive element-binding protein 1) is essential for neuron survival in the mammalian brain. A spontaneous mouse mutation causing loss of a nervous system-enriched Rreb1 transcript is associated with progressive loss of cerebellar Purkinje cells and ataxia. Analysis of chromatin immunoprecipitation and sequencing, along with RNA sequencing data revealed dysregulation of RREB1 targets associated with the microtubule cytoskeleton. In agreement with the known role of microtubules in dendritic development, dendritic complexity was disrupted in Rreb1-deficient neurons. Analysis of sequencing data also suggested that RREB1 plays a role in the endomembrane system. Mutant Purkinje cells had fewer numbers of autophagosomes and lysosomes and contained P62- and ubiquitin-positive inclusions. Together, these studies demonstrate that RREB1 functions to maintain the microtubule network and proteostasis in mammalian neurons.


Figures

Fig. 1.
Fig. 1.. Purkinje cell degeneration occurs in nm3888 mutant mice.
(A) Calbindin D-28 immunohistochemistry and hematoxylin staining of sagittal sections of cerebella from nm3888−/−, nm3888+/−, and wild-type (WT) mice at ages indicated. High-magnification images of boxed regions are shown below. (B) Average number of Purkinje cells per section for mice at indicated time points; SEM indicated. (C and D) Cleaved caspase 3 (CC3) immunostaining and merged CC3 and immunofluorescence with DAPI counterstain in the cerebellum of 5-week-old nm3888−/− (C) and WT (D) mice. Scale bars, 500 and 50 μm (low magnification and high magnification, respectively) (A) and 20 μm [(C) and (D)]. Multiple t tests were performed (B). ****P ≤ 0.0001, *P ≤ 0.05.
Fig. 2.
Fig. 2.. The nm3888 mutation results in loss of Rreb1.
(A) Schematic of the nm3888 critical region including protein-coding genes and polymorphisms used for genetic mapping. (B) RT-qPCR analysis of protein-coding genes in the critical region from wild-type (WT) and nm3888−/− (−/−) cerebella. Mean and SEM are graphed. Only Rreb1 expression was significantly different between genotypes, **P ≤ 0.001 (multiple t tests with Benjamini and Hochberg correction). (C) Northern blot analysis of total Rreb1 from WT and nm3888−/− cerebella. (D) Schematics of Rreb1 transcripts that are 9 kb or greater in length. Coding exons are indicated in dark blue, noncoding exons are in light blue, and transcript-specific exons are in orange. Arrows indicate primers used to amplify transcripts shown in (E). Northern probes used for total Rreb1 and Rreb1 V7 are indicated by a green line and red line, respectively. (E) RT-PCR of Rreb1 transcripts shown in (D) from WT and nm3888−/− cerebella. (F) Northern blot analysis of Rreb1 V7 from WT and nm3888−/− cerebella. (G) Schematic of Rreb1 with coding exons in dark blue and noncoding exons in light blue. Arrows indicate primers used to amplify around and within the nm3888 insertion. Introns not drawn to scale. (H and I) PCR analysis of genomic DNA from WT, nm3888+/−, and nm3888−/− mice with primers in Rreb1 intron 4 (primer pair Intron 4F/Intron 4R). (J) Schematic showing splicing of Rreb1 V7 and Rreb1 X4 into nm3888 insertion (red) along with primers used for RT-PCR (arrows). (K) RT-PCR for chimeric transcripts containing Rreb1 and the nm3888 insertion, performed with cerebellar cDNA from 3-week-old WT and nm3888−/− mice. Primers used are indicated on the left.
Fig. 3.
Fig. 3.. Rreb1 variant 7 (V7) is a spatially and temporally regulated transcript.
(A) RT-qPCR for total Rreb1 and Rreb1 V7 of 3 separate brain regions and 11 tissues from P56 wild-type (WT) mice. Expression is normalized to mean cerebellar (CBX) expression; mean and SEM are graphed. Abbreviations: cerebellum (CBX), cortex (CTX), hippocampus (HIP), spinal cord (S.C.), kidney (KID), and muscle (MUSC). (B) Rreb1 in situ hybridization alone and with DAPI counterstain of WT brain. Abbreviations: olfactory bulb (MOB), olfactory tubercle (OT), thalamus (TH), retrosplenial area (RSP), and cerebellum (CBX). (C) Low magnification: Rreb1 in situ hybridization of WT cerebellum; high magnification: Rreb1 in situ hybridization with coimmunofluorescence for calbindin D-28 (Calb) and DAPI counterstain of WT cerebellum. (D) Rreb1 in situ hybridization with coimmunofluorescence of tyrosine hydroxylase (TH) of the substantia nigra of WT brain. (E) Rreb1 in situ hybridization and DAPI counterstain of dentate gyrus (DG) of WT brain. (F) Rreb1 in situ hybridization and DAPI counterstain of deep cerebellar nuclei (DCN) of WT brain. (G) Rreb1 in situ hybridization alone, and with DAPI counterstain, of nm3888−/− brain. (H) RT-qPCR for total Rreb1 and Rreb1 V7 at pre- and postnatal time points of WT brain (E13.5) and cerebellum (E18.5 to P56). Average expression relative to mean expression at P56 is graphed with SEM indicated by error bars. Multiple t tests were used. **P ≤ 0.01, *P ≤ 0.05. Scale bars, 500 μm [(B), (C) (low magnification), (D), (F), and (G)], 10 μm [(C), high magnification], and 200 μm (E). All in situ hybridization was performed on brains from P21 mice.
Fig. 4.
Fig. 4.. RREB1 regulates genes associated with the endomembrane system and cytoskeletal network.
(A) Schematic representation of Rreb1 variant 7 (V7) cDNA transgene: PCP2 promoter and fourth exon (light blue), Rreb1 V7 cDNA (dark blue), three V5 epitope tags (red), and polyA signal (green). (B) Breakdown of types of genomic regions containing peaks defined by MACS3 and annotated by HOMER. Transcriptional termination sequence (TTS). (C) Breakdown of types of genes associated with MACS3 peaks; gene types annotated by HOMER. (D) Cellular component enrichment of putative ChIP targets performed using ShinyGO, plotted by FDR with fraction of ChIP targets/number of genes in category, and percent enrichment [(number of ChIP targets/number of genes in category) × 100%] indicated. (E) Volcano plot of gene expression in nm3888−/− Purkinje cells relative to wild-type neurons. Up-regulated genes are in red, down-regulated genes are in blue, and genes with a P adj ≥ 0.05 are in gray. Numbers of genes up-regulated and down-regulated are indicated. (F) Molecular pathway enrichment for significantly differentially expressed genes performed with ShinyGO Molecular Pathway Enrichment; arrows indicate directionality of pathway. (G) Violin plot showing differential expression of all cytoskeleton system putative targets (green) compared to all other detected genes (light gray) and differential expression of all endomembrane system putative targets (blue) compared to all other detected genes (dark gray). We determined P values by Wilcoxon rank sum tests.
Fig. 5.
Fig. 5.. Loss of Rreb1 affects the tubulin network and reduces dendritic branching of Purkinje cells.
(A) Immunofluorescence for beta III tubulin in lobule IV and (B) average cell soma fluorescence intensity (a.u., arbitrary units) with SEM represented by error bars. (C) Immunofluorescence for acetylated alpha tubulin in lobule II and (D) average cell soma fluorescence intensity with SEM represented by error bars. (E) Immunofluorescence for polyglutamylated alpha tubulin in lobule II and (F) average cell soma fluorescence intensity with SEM represented by error bars. [(A), (C), and (E)] Molecular layer (ML), Purkinje cell layer (PL), and granule cell layer (GL) are indicated. Images are pseudocolored on the basis of intensity; an 8-bit LUT scale ranging from 0 to 255 was used. [(B), (D), and (F)] Multiple t tests were performed ****P ≤ 0.0001. [(A) to (F)] We used 3-week-old mice for images and quantification. (G) Maximal intensity projection and (H) dendritic branch tracing of biocytin-labeled Purkinje cells from a wild-type (WT) Purkinje cell. (I) Maximal intensity projection and (J) dendritic branch tracing of biocytin-labeled dendrites from an nm3888−/− Purkinje cell. [(H) and (J)] Total branch points for each cell are indicated in the top right corner of tracing. (K) Sholl analysis for wild-type and nm3888−/− Purkinje cells from lobule IV in 3-week-old mice. A two-way analysis of variance (ANOVA) was performed, which showed a significant effect for genotype; P value is indicated on the graph. (L) Graph of average number of branch points for traced dendrites from wild-type and nm3888−/− Purkinje cells; SEM is indicated. ****P ≤ 0.0001 (unpaired t test). Scale bars, 25 μm [(A), (C), and (E)] and 50 μm [(G) and (I)].
Fig. 6.
Fig. 6.. Loss of Rreb1 reduces autophagosome and lysosome abundance and impairs proteostasis.
(A and B) LC3 (RFP-LC3 fluorescence) and immunofluorescence for lamp1 and cathepsin-D (CTSD) in lobules IV (A) and IX (B) in the cerebellum of 3-week-old CAG-RFP-EGFP-LC3Tg and nm3888−/−; CAG-RFP-EGFP-LC3Tg mice. Purkinje cell soma are encircled in dashed white lines. (C and D) Puncta per soma of LC3, lamp1, and cathepsin-D (CTSD) in lobule IV (C) and lobule IX (D). Multiple unpaired t tests were performed ****P ≤ 0.0001. (E and F) Immunofluorescence with antibodies to ubiquitin (Ubi), P62, and calbindin D-28 (Calb) with DAPI in the cerebellum of 4-week-old nm3888−/− (E) and wild-type (F) mice. (G) Percent of Purkinje cells with P62 puncta per section in 3-, 4-, 5-, and 6-week-old nm3888−/− mice, and in 6-week-old wild-type (WT) mice. SEM is indicated by error bars. Scale bars, 20 μm [(A) and (B)] and 10 μm [(E) and (F)].

Similar articles

Cited by

References

    1. Sweeney P., Park H., Baumann M., Dunlop J., Frydman J., Kopito R., McCampbell A., Leblanc G., Venkateswaran A., Nurmi A., Hodgson R., Protein misfolding in neurodegenerative diseases: Implications and strategies. Transl. Neurodegener. 6, 6 (2017). - PMC - PubMed
    1. Cortes C. J., La Spada A. R., TFEB dysregulation as a driver of autophagy dysfunction in neurodegenerative disease: Molecular mechanisms, cellular processes, and emerging therapeutic opportunities. Neurobiol. Dis. 122, 83–93 (2019). - PMC - PubMed
    1. Martini-Stoica H., Cole A. L., Swartzlander D. B., Chen F., Wan Y. W., Bajaj L., Bader D. A., Lee V. M. Y., Trojanowski J. Q., Liu Z., Sardiello M., Zheng H., TFEB enhances astroglial uptake of extracellular tau species and reduces tau spreading. J. Exp. Med. 215, 2355–2377 (2018). - PMC - PubMed
    1. Gu Z., Cao H., Zuo C., Huang Y., Miao J., Song Y., Yang Y., Zhu L., Wang F., TFEB in Alzheimer’s disease: From molecular mechanisms to therapeutic implications. Neurobiol. Dis. 173, 105855 (2022). - PubMed
    1. He X., Xie Y., Zheng Q., Zhang Z., Ma S., Li J., Li M., Huang Q., TFE3-mediated autophagy is involved in dopaminergic neurodegeneration in Parkinson’s disease. Front. Cell Dev. Biol. 9, 761773 (2021). - PMC - PubMed

Publication types