. 2024 Jan 12;10(2):eadk4741.
doi: 10.1126/sciadv.adk4741. Epub 2024 Jan 10.

Silencing dentate newborn neurons alters excitatory/inhibitory balance and impairs behavioral inhibition and flexibility

Affiliations

Silencing dentate newborn neurons alters excitatory/inhibitory balance and impairs behavioral inhibition and flexibility

Haowei Li et al. Sci Adv. .

Abstract

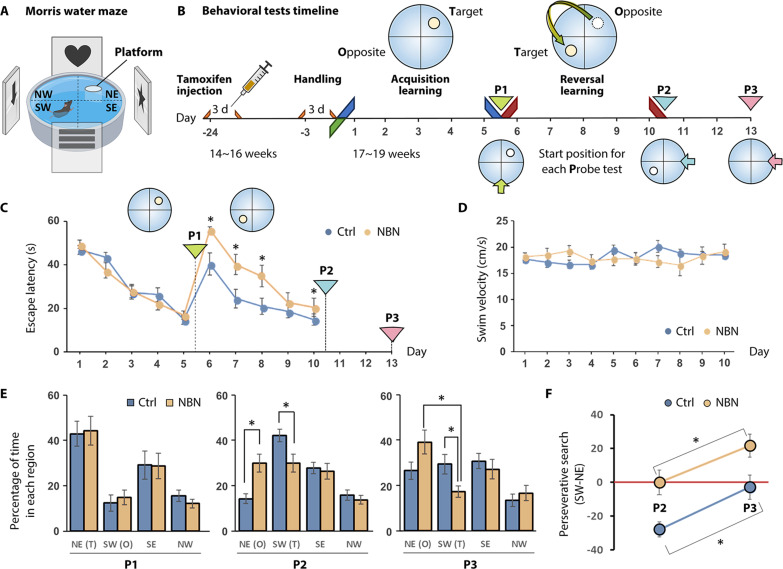
Adult neurogenesis confers the hippocampus with unparalleled neural plasticity, essential for intricate cognitive functions. The specific influence of sparse newborn neurons (NBNs) in modulating neural activities and subsequently steering behavior, however, remains obscure. Using an engineered NBN-tetanus toxin mouse model (NBN-TeTX), we noninvasively silenced NBNs, elucidating their crucial role in impulse inhibition and cognitive flexibility as evidenced through Morris water maze reversal learning and Go/Nogo task in operant learning. Task-based functional MRI (tb-fMRI) paired with operant learning revealed dorsal hippocampal hyperactivation during the Nogo task in male NBN-TeTX mice, suggesting that hippocampal hyperexcitability might underlie the observed behavioral deficits. Additionally, resting-state fMRI (rs-fMRI) exhibited enhanced functional connectivity between the dorsal and ventral dentate gyrus following NBN silencing. Further investigations into the activities of PV+ interneurons and mossy cells highlighted the indispensability of NBNs in maintaining the hippocampal excitation/inhibition balance. Our findings emphasize that the neural plasticity driven by NBNs extensively modulates the hippocampus, sculpting inhibitory control and cognitive flexibility.


Figures

Fig. 1.
Fig. 1.. Characterization of the NBN-TeTX mouse model for noninvasive NBN silencing.
(A) NBN-TeTX mice are transgenic, carrying three recombinant genes. TeTX inhibits NBN functionality by cleaving synaptic vesicle VAMP2 at neural terminals, thus restricting neurotransmitter release. (B) Fluorescent vector viral transfection method to validate the silencing rate. Synaptic vesicles at terminals are labeled with coexpressed Synaptophysin-GFP and mCherry-VAMP2. A week after tamoxifen cessation, retroviral injections are given, with perfusion and staining after 8 weeks. Typically, colocalized VAMP2 and Synaptophysin in virus-transfected terminals display an overall yellow appearance due to combined mCherry (red) and GFP (green). In terminals with TeTX, VAMP2 cleavage separates mCherry from the synaptic vesicle membrane, resulting in only green GFP fluorescence. (C) In the CA3 area of NBN mice, ~40% of NBN synaptic terminals showcase dislodged mCherry, in contrast to nearly none in the control group. Arrows highlight synapses cofluorescing Synaptophysin-GFP and mCherry-VAMP2 (Ctrl: mean = 97.265 ± 1.382, NBN: mean = 58.003 ± 3.366, n = 3 per group; ***P < 0.001, unpaired t test; slice thickness: 40 μm; scale bar, 100 μm). (D) After 8 weeks of tamoxifen administration, BrdU/NBN coimmunofluorescence staining indicates that the mature NBN count in the NBN-TeTX group is not significantly different from the Ctrl group. Arrows pinpoint hippocampal DG NBNs costained with BrdU/NeuN (Ctrl: average = 733 ± 32, NBN: mean = 690 ± 34, n = 5 per group, unpaired t test; slice thickness: 40 μm; scale bar, 50 μm). Panels (A) and (B) were created with BioRender.com.
Fig. 2.
Fig. 2.. Impaired spatial reversal learning during Morris water maze.
(A) Morris water maze (MWM) experimental setup schematic, created with BioRender.com. (B) MWM experiment protocol. Probe tests P1 and P2 occurred immediately after the learning periods on days D5 and D10, respectively. P3 was scheduled for day 13. (C) Escape latency progression (in seconds) over the 10-day training. Significant differences between the groups were observed only during the reversal learning phase (D6 to D10: *P < 0.05, two-way ANOVA; mean ± SEM). (D) No significant difference in movement speed (cm/s) was found throughout the 10-day training (two-way ANOVA). (E) Percentage of time both mouse groups spent exploring each quadrant during the spatial probe trial: At P1, exploration time in each quadrant showed no significant difference between the groups (NE: P = 0.8808, two-way ANOVA). At P2, differences were seen in time spent in the NE and SW quadrants (NE: P = 0.0045, SW: P = 0.0285; *P < 0.05, two-way ANOVA). At P3, only the time in the SW quadrant differed between groups (SW: P = 0.0232, two-way ANOVA). Within the NBN group, significant differences arose between time spent in the NE and SW quadrants (Ctrl: P = 0.6394, NBN: P = 0.0015; *P < 0.05, two-way ANOVA). (F) Changing preference of both groups for the NE and SW quadrants, where the platform was located, from P2 to P3 (Ctrl: P = 0.0099, NBN: P = 0.0465; *P < 0.05, two-way ANOVA).
Fig. 3.
Fig. 3.. Impacted impulse inhibition in the Nogo task of operant learning.
(A) Operant learning protocol based on light cues: 11 NBN and 9 Ctrl mice participated. A 3-day light reflex training preceded tamoxifen administration to ensure consistent light cue water reward conditioning across both groups. (B) Rule setup for the Go and Nogo tasks. (C) Schematic of the operant learning apparatus setup, created with BioRender.com. Mice are secured on a custom operant learning bed via a pre-attached head plate. (D) Each group’s accuracy trend across the 10-day Go task. By day 10, both groups consistently achieved over 95% accuracy, showing no marked intergroup differences (day 9 accuracy: Ctrl: 96.37%, NBN: 94.96%; day 10: Ctrl: 95.72%, NBN: 95.68%; two-way ANOVA; Ctrl: n = 9, NBN: n = 11; mean ± SEM). (E) Accuracy trends for each group during the 10-day Nogo task. The NBN group’s accuracy consistently trailed the Ctrl group throughout (genotype: F1,18 = 16.6545, P = 0.0007; *P < 0.05, two-way ANOVA; Ctrl: n = 9, NBN: n = 11; mean ± SEM).
Fig. 4.
Fig. 4.. Hippocampal activation in Go task via tb-fMRI.
(A) Operant learning protocol with light cues inside fMRI captures 18 trials over 6 min on day 1 of Go and Nogo tasks. The schematic for this protocol was created with BioRender.com. (B) Go and Nogo task rules for fMRI: 20-s trials. In the Nogo task, post-light cue licking grants a reward, countering freezing due to fMRI conditions. Licking within 2 s after the light cue is considered correct and rewarded in the Nogo task. Additionally, brain activity during this period is regarded as the active state corresponding to the baseline in the analysis. A hippocampal anatomical mask was utilized to accurately track activation responses. (C) 3D rendering of hippocampal activity in the Ctrl group’s individual and intra-group Go task (pFDR < 0.05); posterior coronal visualization details section’s bregma relation. Second level: peak T value: 15.25, cluster extent (KE) = 448. (D) 3D rendering of hippocampal activity in the NBN group’s individual and intra-group Go task (pFDR < 0.05); posterior coronal visualization details section’s bregma relation. Second level: peak T value: 14.29, cluster KE = 216. (E) Overlaid second-level intra-group results for Ctrl and NBN during Go task highlight spatial activation differences. (F) Both groups exhibit elevated %BOLD in hippocampus 2 to 4 s after the light cue. No significant difference observed (Ctrl: 2.258, NBN: 2.236; n = 6 per group; two-tailed, unpaired t test). (G) Correct licking rate in fMRI-captured Go task trials: Ctrl: 0.7778, NBN: 0.7500; no significant group difference (n = 6 per group; two-tailed, unpaired t test, mean ± SEM). (H) Ratio of activated to total hippocampal voxels per individual calculated. Ctrl’s Go task activated voxel percentage significantly higher than NBN’s (Ctrl: 8.524%, NBN: 2.456%; **P < 0.005, two-tailed, unpaired t test; n = 6 per group).
Fig. 5.
Fig. 5.. Hippocampal activation in Nogo task via tb-fMRI.
(A) 3D rendering of hippocampal activity in the Ctrl group’s individual and intra-group Nogo task (group: peak T value: 6.11, pFDR < 0.05). (B) 3D rendering of hippocampal activity in the NBN group’s individual and intra-group Nogo task (group: peak T value: 18.41, pFDR < 0.05). (C) Second-level intergroup analysis results for the Nogo task (NBN > Ctrl, peak T value: 5.28, pFDR < 0.05). (D) Hippocampal %BOLD signal changes are plotted over the initial 2-min frame during Nogo task (mean ± SD, n = 6 per group). (E) NBN group exhibit significantly elevated %BOLD in hippocampus against the Ctrl group within 2 to 4 s after the light cue (***P < 0.001, two-tailed, unpaired t test). (F) In the Nogo task, the NBN group’s accuracy rate in the initial 18 trials was significantly lower than that in the Ctrl group (*P < 0.05, two-tailed, unpaired t test, mean ± SEM). (G) Ctrl’s Nogo task activated voxel percentage became significantly lower than that of the NBN group (Ctrl: 3.045%, NBN: 8.776%; **P < 0.005, two-tailed, unpaired t test; n = 6 per group). (H) BOLD signal measurements from various layers of the hippocampus reveal notable intensity changes, especially in the NBN group’s d1 and d2 layers (***P < 0.001, two-way ANOVA). (I) Evaluations of the average BOLD intensity changes between the dorsal and ventral hippocampus indicate predominant dorsal activation in the NBN group during the Nogo task (dorsal: ***P < 0.001, two-way ANOVA). (J) An illustration demarcates the mask used for BOLD signal extraction. The hippocampus is segmented into layers, with a breakdown of the dorsal (d1 to d4) and ventral (v1 to v2) regions. Both sides of the hippocampus are assessed independently.
Fig. 6.
Fig. 6.. Functional connectivity with NBN silencing via rs-fMRI.
(A) Schematic of ROI settings for the rs-fMRI functional connectivity analysis. The bilateral hippocampus is segmented based on anatomy and dorsal-ventral distinctions: dDG (upper two-thirds), vDG (lower one-third), dCA1, vCA1, dCA2&3, and vCA2&3. (B) From left to right: Second-level intra-group functional connectivity for the Ctrl and NBN groups, second-level intergroup analysis, and a chord diagram for NBN > Ctrl (T26 = 2.56, FDR-corrected P < 0.05 ROI-level threshold (ROI mass/intensity), n = 14 per group). (C and D) Comparison of z values (Fisher-transformed) between the groups. A notable difference in functional connectivity between NBN and Ctrl was seen in dDG-vDG (β = 0.16, T26 = 2.56, *P = 0.016, two-sample t test, mean ± SEM; n = 14 per group).
Fig. 7.
Fig. 7.. Dynamic changes in DG E/I components activity.
(A) Immunofluorescence of NBN activity (DCX+/NeuN+/c-Fos+) after Nogo task. The ratio of c-Fos cells to the overall count of relevant cells in the DG of each slice was determined (n = 3 per group; scale bar, 100 μm). (B) Immunofluorescence of parvalbumin-positive GABAergic interneuron (PV+/c-Fos+) and mossy cell (GluR2/3+/c-Fos+) activity after Nogo task (n = 3 per group; scale bar, 100 μm). (C) c-Fos+ NBNs, PV+ interneurons, and mossy cell proportions in the hippocampal DG after Nogo task for both groups (*P < 0.05, **P < 0.01, ***P < 0.001, two-way ANOVA, mean ± SEM). (D) Dorsal-ventral changes and trends in activated NBNs, PV+ interneurons, and mossy cells in the hippocampal DG under each condition (NBN: n = 3; *P < 0.05, **P < 0.01, ***P < 0.001, two-way ANOVA, mean ± SEM; n = 3 per group at each condition).
Fig. 8.
Fig. 8.. E/I imbalance in the DG following NBN silencing.
With functional NBNs, the robust inhibitory input from dorsal DG PV+ cells ensures moderate hippocampal activation during cognitive flexibility tasks. When NBN function is compromised, reduced PV+ cell activity results in hippocampal hyperactivation, accompanied by increased mossy cell activity. The schematic was created with BioRender.com.

References

    1. Anderson M. C., Hanslmayr S., Neural mechanisms of motivated forgetting. Trends Cogn. Sci. 18, 279–292 (2014). - PMC - PubMed
    1. Ryan T. J., Frankland P. W., Forgetting as a form of adaptive engram cell plasticity. Nat. Rev. Neurosci. 23, 173–186 (2022). - PubMed
    1. Miyake A., Friedman N. P., Emerson M. J., Witzki A. H., Howerter A., Wager T. D., The unity and diversity of executive functions and their contributions to complex “Frontal Lobe” tasks: A latent variable analysis. Cogn. Psychol. 41, 49–100 (2000). - PubMed
    1. Collins A., Koechlin E., Reasoning, learning, and creativity: Frontal lobe function and human decision-making. PLOS Biol. 10, e1001293 (2012). - PMC - PubMed
    1. Diamond A., Executive functions. Annu. Rev. Psychol. 64, 135–168 (2013). - PMC - PubMed

Publication types