. 2024 Jan 10;16(729):eadh8335.
doi: 10.1126/scitranslmed.adh8335. Epub 2024 Jan 10.

Deciphering maternal-fetal cross-talk in the human placenta during parturition using single-cell RNA sequencing

Affiliations

Deciphering maternal-fetal cross-talk in the human placenta during parturition using single-cell RNA sequencing

Valeria Garcia-Flores et al. Sci Transl Med. .

Abstract

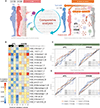
Labor is a complex physiological process requiring a well-orchestrated dialogue between the mother and fetus. However, the cellular contributions and communications that facilitate maternal-fetal cross-talk in labor have not been fully elucidated. Here, single-cell RNA sequencing (scRNA-seq) was applied to decipher maternal-fetal signaling in the human placenta during term labor. First, a single-cell atlas of the human placenta was established, demonstrating that maternal and fetal cell types underwent changes in transcriptomic activity during labor. Cell types most affected by labor were fetal stromal and maternal decidual cells in the chorioamniotic membranes (CAMs) and maternal and fetal myeloid cells in the placenta. Cell-cell interaction analyses showed that CAM and placental cell types participated in labor-driven maternal and fetal signaling, including the collagen, C-X-C motif ligand (CXCL), tumor necrosis factor (TNF), galectin, and interleukin-6 (IL-6) pathways. Integration of scRNA-seq data with publicly available bulk transcriptomic data showed that placenta-derived scRNA-seq signatures could be monitored in the maternal circulation throughout gestation and in labor. Moreover, comparative analysis revealed that placenta-derived signatures in term labor were mirrored by those in spontaneous preterm labor and birth. Furthermore, we demonstrated that early in gestation, labor-specific, placenta-derived signatures could be detected in the circulation of women destined to undergo spontaneous preterm birth, with either intact or prelabor ruptured membranes. Collectively, our findings provide insight into the maternal-fetal cross-talk of human parturition and suggest that placenta-derived single-cell signatures can aid in the development of noninvasive biomarkers for the prediction of preterm birth.


Conflict of interest statement

Competing interests:

The authors declare that they have no competing interests.

Figures
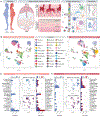
Figure 1.
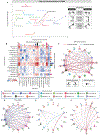
Figure 1.. Single-cell atlas of the maternal-fetal interface in parturition.
(A) Study design showing the collection of placental tissues from women who delivered at term with (TIL, n = 24) or without (TNL, n = 18) labor. Briefly, chorioamniotic membranes (CAM) and basal plate with placental villi (BPPV) were sampled to generate single-cell suspensions for single-cell RNA-sequencing (scRNA-seq). Genotyping of maternal and neonatal tissues was also performed to allow assignment of maternal (M) or fetal (F) origin to cells. (B and C) Uniform manifold approximation and projection (UMAP) plots show all cell types identified in the (B) CAM and (C) BPPV. (D and E) Bar plots represent the total numbers of each maternal (light blue) or fetal (dark blue) cell type in the (D) CAM and (E) BPPV and the numbers of each cell type with labor (red bars) and without labor (blue bars). Corresponding UMAP plots show the cell clusters in the CAM and BPPV according to maternal (light blue) or fetal (dark blue) origin and how each changes with labor (red clusters) and without labor (blue clusters). Abbreviations used: CTB, cytotrophoblast; EVT, extravillous trophoblast; ILC, innate lymphoid cell; npiCTB, non-proliferative interstitial cytotrophoblast; LED, lymphoid endothelial decidual cell; NK cell, natural killer cell; STB, syncytiotrophoblast.
Figure 2.
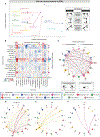
Figure 2.. Parturition induces transcriptomic changes in maternal and fetal cells in the CAM and BPPV.
(A) Bar plots show the numbers of differentially expressed genes (DEGs) associated with labor for each cell type in the CAM and BPPV, where red and pink indicate upregulated or downregulated genes, respectively. (B) Quantile-quantile (Q-Q) plots showing the DEGs for selected enriched cell types of maternal or fetal origin from the CAM and BPPV. Deviation above 1:1 (solid black line) indicates enrichment. (C) Heatmap showing the log2(fold change) correlation among cell types of maternal (M) or fetal (F) origin from the CAM and BPPV, where red represents increasing correlation. (D) ClusterProfiler dot plots showing the Gene Ontology (GO) pathways that are enriched with labor in the fetal Stromal-1, Stromal-2, Stromal-3, and maternal Decidual-1 cell types of the CAM and/or BPPV based on over-representation analysis (ORA). The size and color of dots represent enrichment score and significance level, respectively. Abbreviations used: CTB, cytotrophoblast; EVT, extravillous trophoblast; ILC, innate lymphoid cell; npiCTB, non-proliferative interstitial cytotrophoblast; LED, lymphoid endothelial decidual cell; NK cell, natural killer cell; STB, syncytiotrophoblast.
Figure 3.
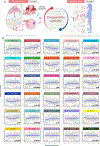
Figure 3.. Maternal-fetal crosstalk in the CAM during parturition.
(A) Arrow plot showing changes in outgoing and incoming interaction strength between the labor (point of the arrow) and no labor (base of the arrow) conditions for specific maternal or fetal cell types in the CAM. F, fetal origin. M, maternal origin. (B) Heatmap showing the differential interaction strength among cell types (as senders or receivers) in the CAM with labor. Red and blue shading indicate increased or decreased signaling, respectively, in labor compared to no labor. (C) Circle plot showing the top 25% increased (red) or decreased (blue) signaling interactions in the CAM with labor compared to no labor among maternal and fetal cells. (D to F) Circle plots representing the top 25% aggregated interactions between maternal and fetal cell types in the CAM for the (D) Collagen, (E) CXCL, and (F) TNF signaling pathways in labor. Cell cluster numbers in bold indicate top participants in labor or in each signaling pathway. Abbreviations used: CTB, cytotrophoblast; EVT, extravillous trophoblast; LED, lymphoid endothelial decidual cell; NK cell, natural killer cell.
Figure 4.
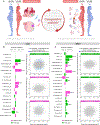
Figure 4.. Maternal-fetal crosstalk in the BPPV during parturition.
(A) Arrow plot showing changes in outgoing and incoming interaction strength between the labor (point of the arrow) and no labor (base of the arrow) conditions for specific maternal or fetal cell types in the BPPV. F, fetal origin. M, maternal origin. (B) Heatmap showing the differential interaction strength among cell types (as senders or receivers) in the BPPV with labor. Red and blue shading indicate increased or decreased signaling, respectively, in labor compared to no labor. (C) Circle plot showing the top 25% increased (red) or decreased (blue) signaling interactions in the BPPV with labor compared to no labor among maternal and fetal cells. (D to F) Circle plots representing the top 25% aggregated interactions between maternal and fetal cell types in the BPPV for the (D) Galectin, (E) TNF, and (F) IL6 signaling pathways in labor. Cell cluster numbers in bold indicate top participants in labor or in each signaling pathway. Abbreviations used: CTB, cytotrophoblast; EVT, extravillous trophoblast; NK cell, natural killer cell.
Figure 5.
Figure 5.. Placental single-cell signatures can be monitored in the maternal circulation during pregnancy.
(A) Experimental design for the comparative analysis between cell type-associated signatures from the CAM and BPPV obtained using scRNA-seq (current study) and bulk transcriptomic data from maternal peripheral blood collected throughout normal pregnancy from women who delivered at term (n = 49) (78). (B) Signature analysis plots based on the top 20 placental cell type markers showing changes in the average expression (blue line) in the maternal peripheral blood throughout gestation. Abbreviations used: CTB, cytotrophoblast; EVT, extravillous trophoblast; ILC, innate lymphoid cell; npiCTB, non-proliferative interstitial cytotrophoblast; LED, lymphoid endothelial decidual cell; NK cell, natural killer cell; STB, syncytiotrophoblast. Significant P values are shown in bold.
Figure 6.
Figure 6.. Single-cell signatures derived from the placental tissues can be monitored in the maternal circulation during labor.
(A) Experimental design for the comparative analysis of labor-associated gene expression changes in maternal (M) and fetal (F) cell types between the placental tissues of women that delivered at term obtained with scRNA-seq (current study) and bulk transcriptomic data of the maternal peripheral blood from women with (n = 21) and without (n = 28) term labor (79). (B) Bar plots showing the correlation between the log2(Fold change) gene expression from CAM single-cell and maternal peripheral blood bulk transcriptomic data (significant with q < 0.1) using the Spearman correlation test. Pink indicates maternal origin, and green indicates fetal origin. Scatter plots showing the log2(Fold change) gene expression associated with labor in bulk microarray (x-axis) and single-cell (y-axis) analyses in the Stromal-2, Macrophage-1 and Decidual-1 cell types from the CAM. Differentially expressed genes (DEGs) shown were obtained using only single-cell analysis (light blue), only bulk analyses (lavender), were shared by both single-cell and bulk analyses (dark blue) or were not differentially expressed between the two contrasts (gray). (C) Bar plots showing the correlation between the log2(Fold change) gene expression from BPPV single-cell and maternal peripheral blood bulk transcriptomic data (significant with q < 0.1) using the Spearman correlation test. Pink indicates maternal origin, and green indicates fetal origin. Scatter plots showing the log2(Fold change) gene expression associated with labor in bulk microarray (x-axis) and single-cell (y-axis) analyses in the EVT-1, CTB-1 and Macrophage-1 cell types from the BPPV. DEGs shown were obtained using only single-cell analysis (light blue), only bulk analyses (lavender), were shared by both single-cell and bulk analyses (dark blue) or were not differentially expressed between the two contrasts (gray). Correlations between data sets were determined using two-sided Spearman’s correlation tests. P values are considered significant when P < 0.05. NS = not significant, * P ≤ 0.05, ** P ≤ 0.01, *** P ≤ 0.001, **** P ≤ 0.0001. Abbreviations used: CTB, cytotrophoblast; EVT, extravillous trophoblast; npiCTB, non-proliferative interstitial cytotrophoblast; LED, lymphoid endothelial decidual cell; NK cell, natural killer cell; STB, syncytiotrophoblast.
Figure 7.
Figure 7.. Term labor-associated single-cell signatures in the CAM partially overlap with those from women with spontaneous preterm labor and birth.
(A) Experimental design for the comparative analysis of term labor-associated gene expression changes in maternal (M) and fetal (F) cell types from the CAM (scRNA-seq, current study) and bulk transcriptomic changes in preterm labor (PTL) of the CAM from women with PTL that delivered at term (n = 15); PTL that delivered preterm without intra-amniotic inflammation (PTL+No Inflammation) (n = 12); PTL with sterile intra-amniotic inflammation (PTL + SIAI) that delivered preterm (n = 17); and PTL with intra-amniotic infection (PTL + IAI) that delivered preterm (n = 11) (84). (B) Heatmap showing the correlations of gene expression between term labor (current study) and PTL, PTL + SIAI, or PTL + IAI, where red and blue indicate increased and decreased correlation, respectively. Gray indicates correlations that are not significantly different from 0. Abbreviations used: CTB, cytotrophoblast; EVT, extravillous trophoblast; LED, lymphoid endothelial decidual cell; NK cell, natural killer cell.
Figure 8.
Figure 8.. Labor-associated single-cell signatures as non-invasive biomarkers of spontaneous preterm birth in two external validation cohorts.
(A) Experimental design for the comparative analysis of term labor-associated gene expression changes in maternal and fetal cell types from the CAM (scRNA-seq, current study) and bulk transcriptomic changes in the peripheral blood of women who ultimately underwent premature prelabor rupture of membranes (PPROM) (n = 63) or spontaneous preterm labor (sPTL) (n = 37), and controls that delivered at term (n = 159). Maternal peripheral blood was collected at two points before delivery: at 17 – 23 weeks of gestation and at 23 – 33 weeks of gestation (94). (B) Heatmap showing the correlation of gene expression according to cell types of fetal (F) or maternal (M) origin between the term CAM and the preterm maternal peripheral blood sampled at 17 – 33 or 27 – 33 weeks of gestation. Red and blue indicate increased and decreased correlation, respectively. Gray indicates correlations that are not significantly different from 0. (C and D) Receiver operating characteristic (ROC) curves showing the value of the (C) maternal Decidual-1 and (D) fetal Stromal-1 single-cell signatures for predicting sPTL or PPROM using the bulk transcriptomes of maternal peripheral blood in two external validation cohorts. Orange ROC lines indicate Cohort 1 and blue ROC lines indicate Cohort 2. Solid and dotted ROC lines represent maternal blood samples collected at 17 – 23 or 27 – 33 weeks of gestation, respectively. Area Under the Curve (AUC) values of the ROC are reported next to its 95% confidence interval in parentheses. A lower bound of the AUC statistics >0.5 represents a significant prediction. Abbreviations used: CTB, cytotrophoblast; EVT, extravillous trophoblast; LED, lymphoid endothelial decidual cell; NK cell, natural killer cell.

Similar articles

Cited by

References

    1. Norwitz ER, Robinson JN, Challis JR, The control of labor. N Engl J Med 341, 660–666 (1999). - PubMed
    1. Challis JR, Bloomfield FH, Bocking AD, Casciani V, Chisaka H, Connor K, Dong X, Gluckman P, Harding JE, Johnstone J, Li W, Lye S, Okamura K, Premyslova M, Fetal signals and parturition. J Obstet Gynaecol Res 31, 492–499 (2005). - PubMed
    1. Romero R, Mazor M, Munoz H, Gomez R, Galasso M, Sherer DM, The preterm labor syndrome. Ann N Y Acad Sci 734, 414–429 (1994). - PubMed
    1. Romero R, Espinoza J, Kusanovic JP, Gotsch F, Hassan S, Erez O, Chaiworapongsa T, Mazor M, The preterm parturition syndrome. BJOG 113 Suppl 3, 17–42 (2006). - PMC - PubMed
    1. Smith R, Parturition. N Engl J Med 356, 271–283 (2007). - PubMed

Publication types