Meta-Analysis
. 2024 Jan 10;16(729):eadd2029.
doi: 10.1126/scitranslmed.add2029. Epub 2024 Jan 10.

Allele-specific control of rodent and human lncRNA KMT2E-AS1 promotes hypoxic endothelial pathology in pulmonary hypertension

Affiliations
Meta-Analysis

Allele-specific control of rodent and human lncRNA KMT2E-AS1 promotes hypoxic endothelial pathology in pulmonary hypertension

Yi-Yin Tai et al. Sci Transl Med. .

Abstract

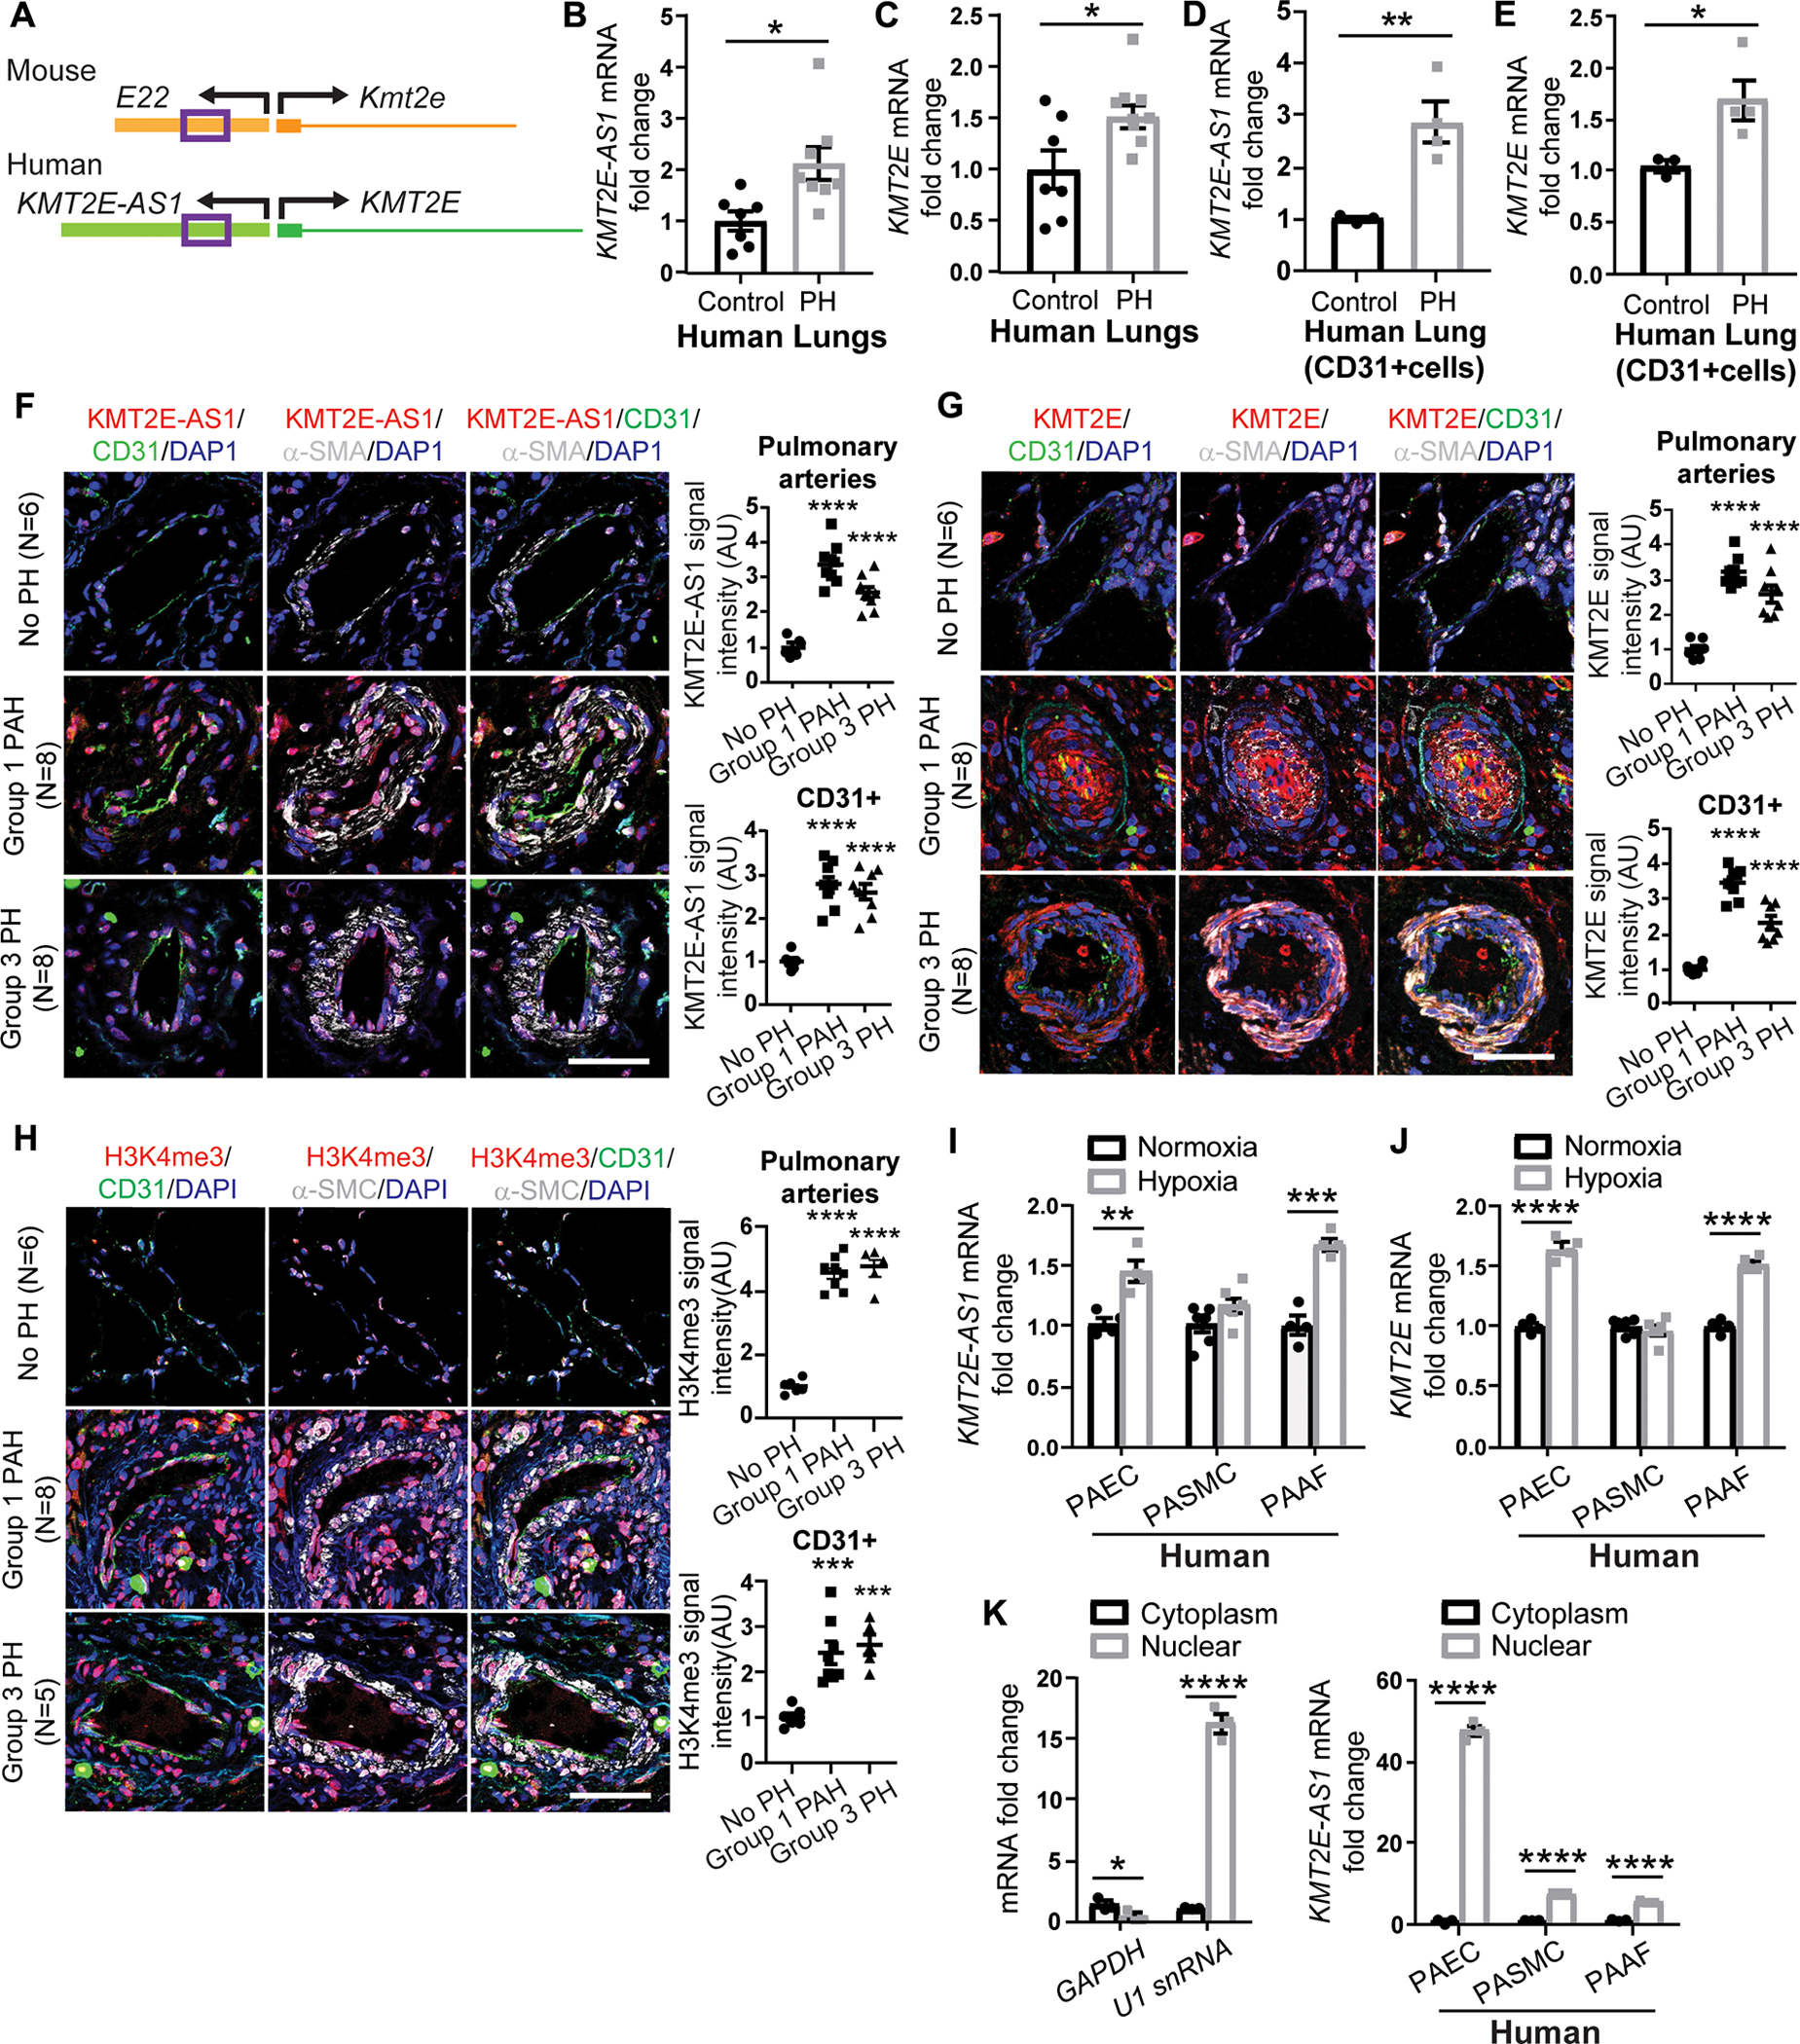
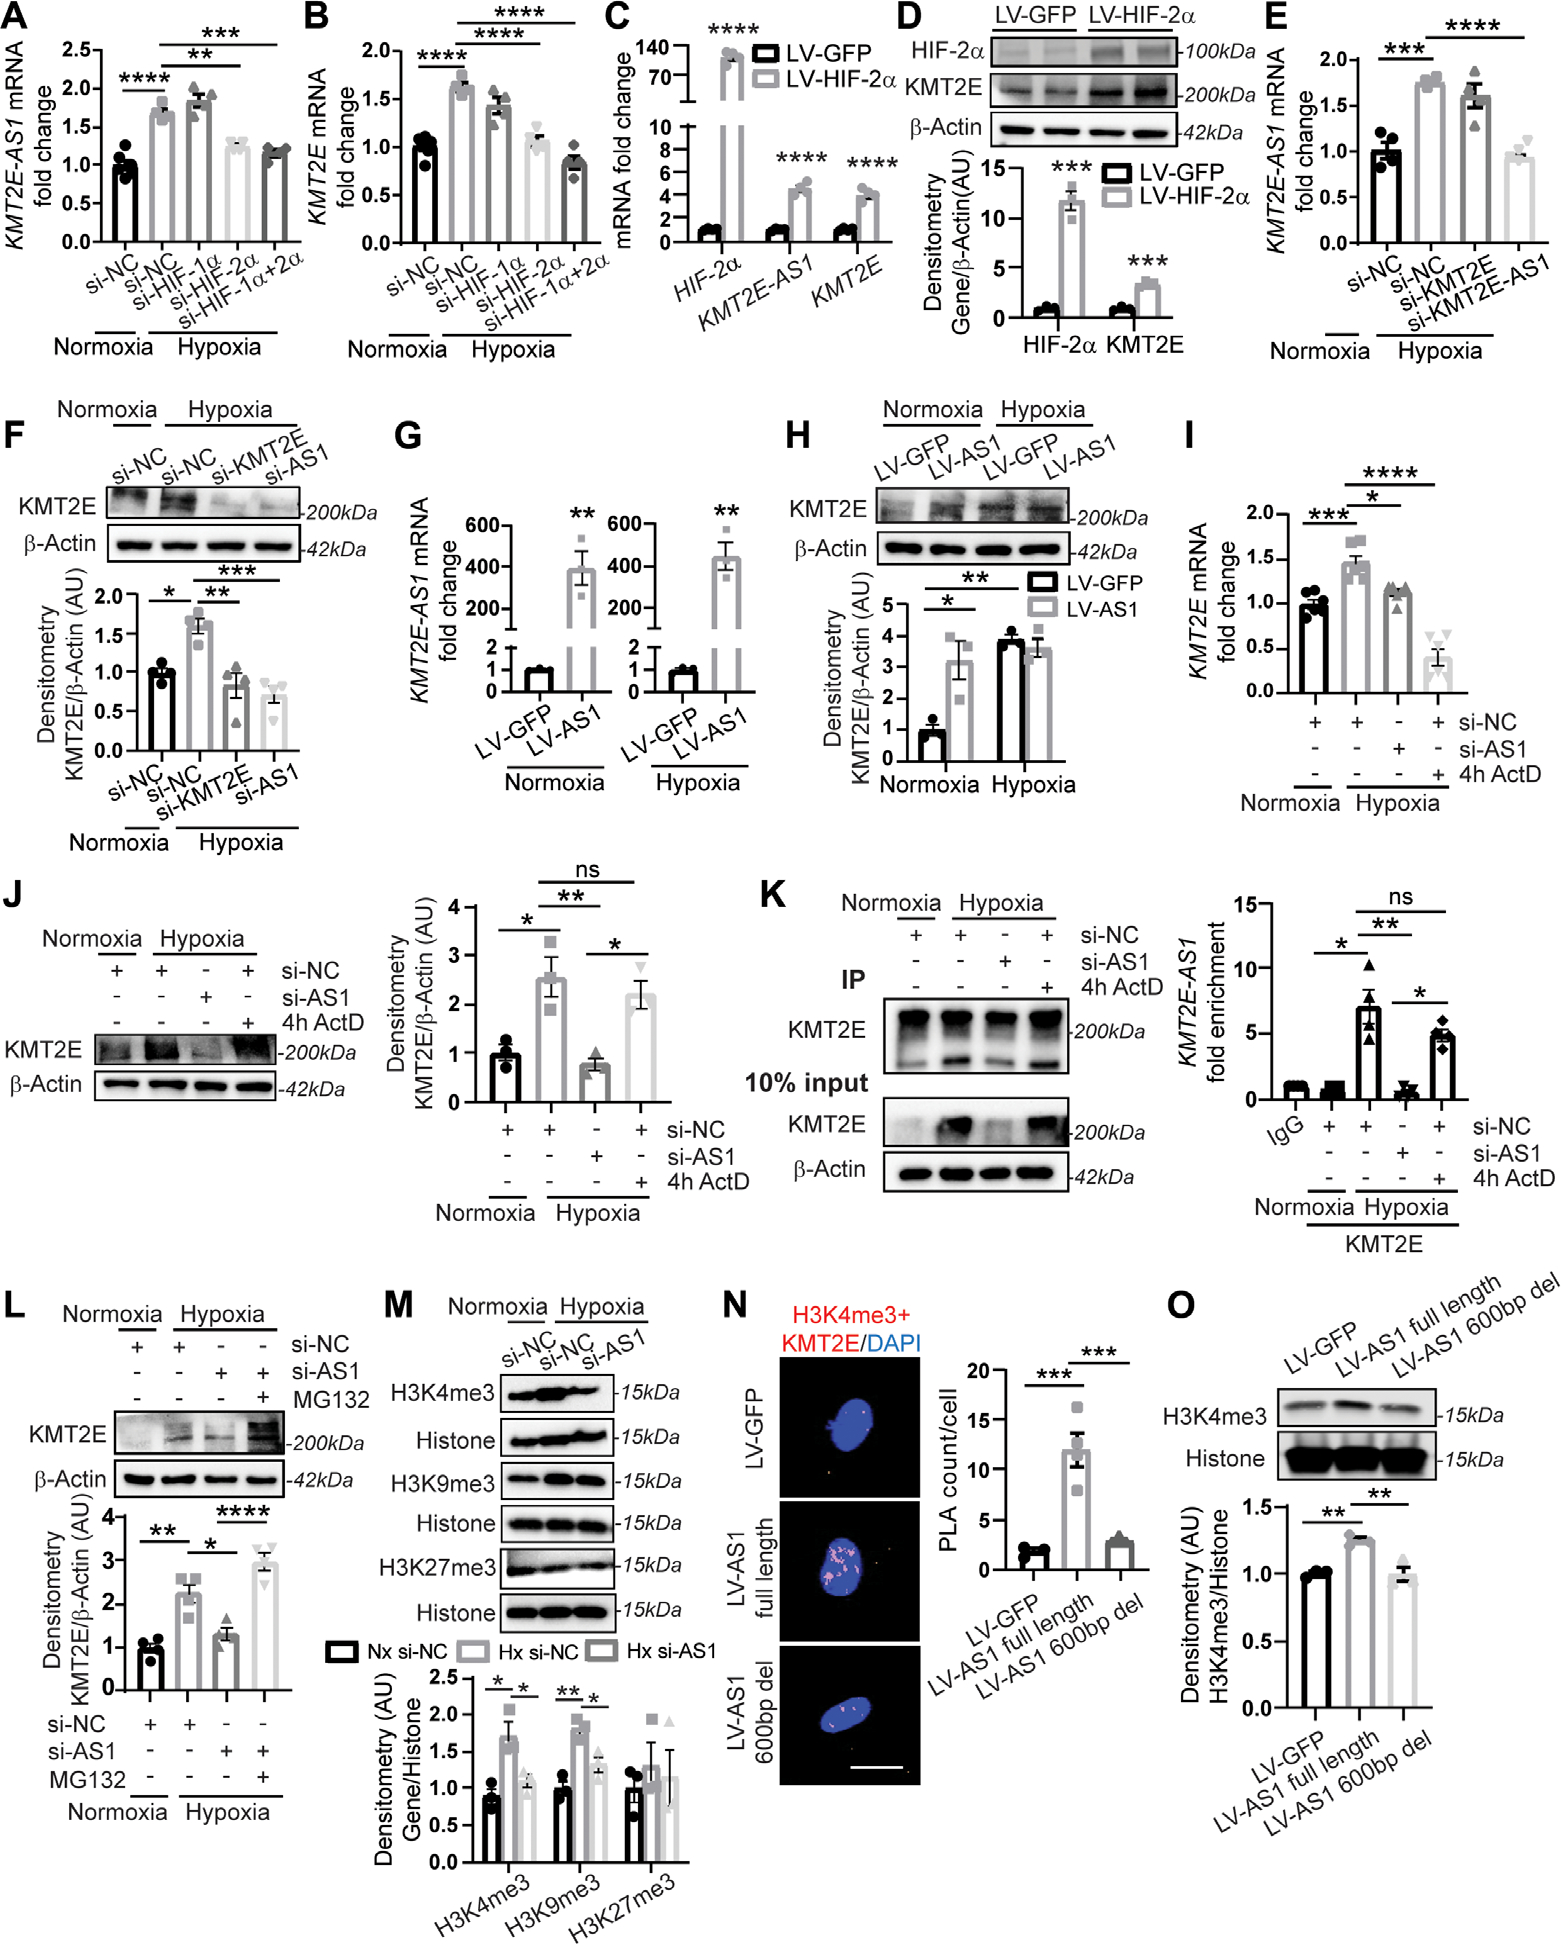
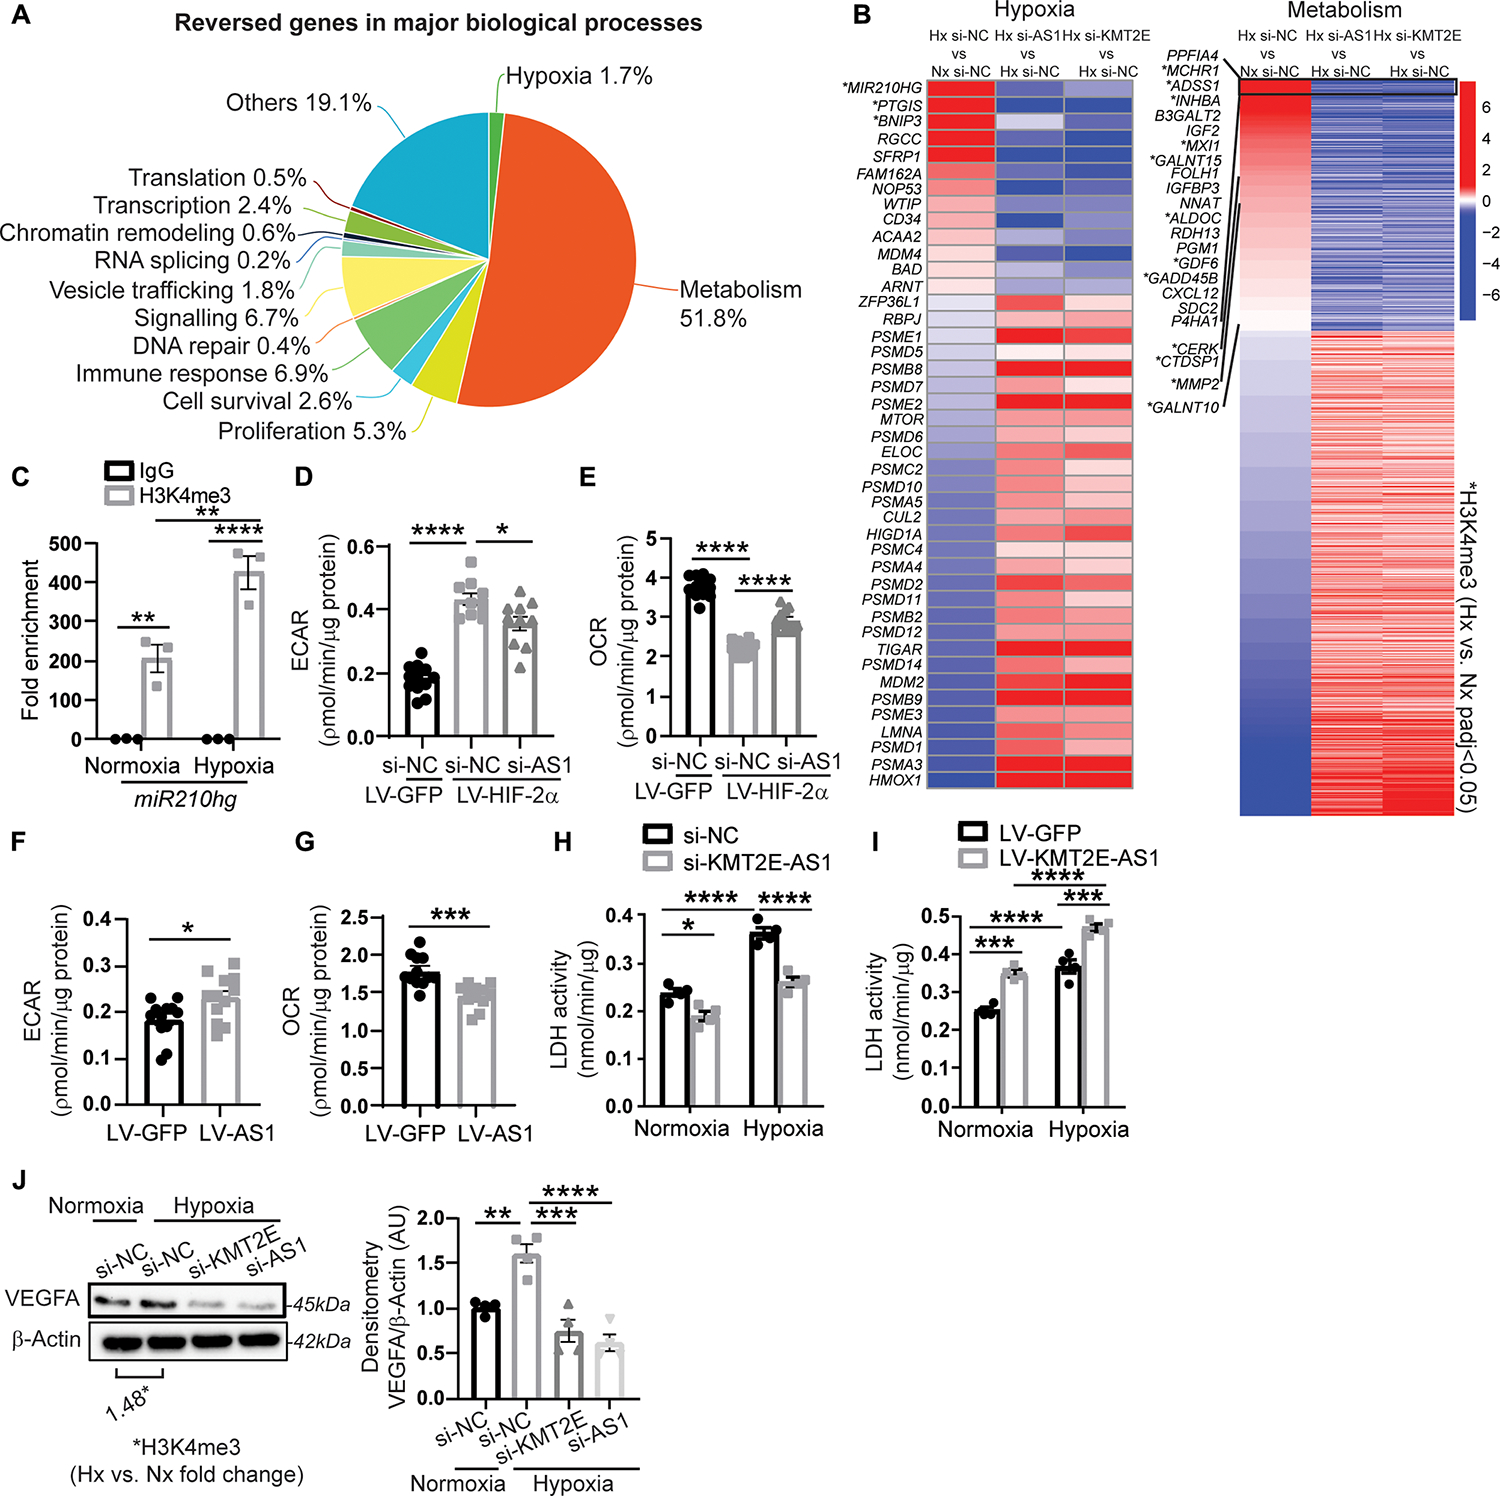
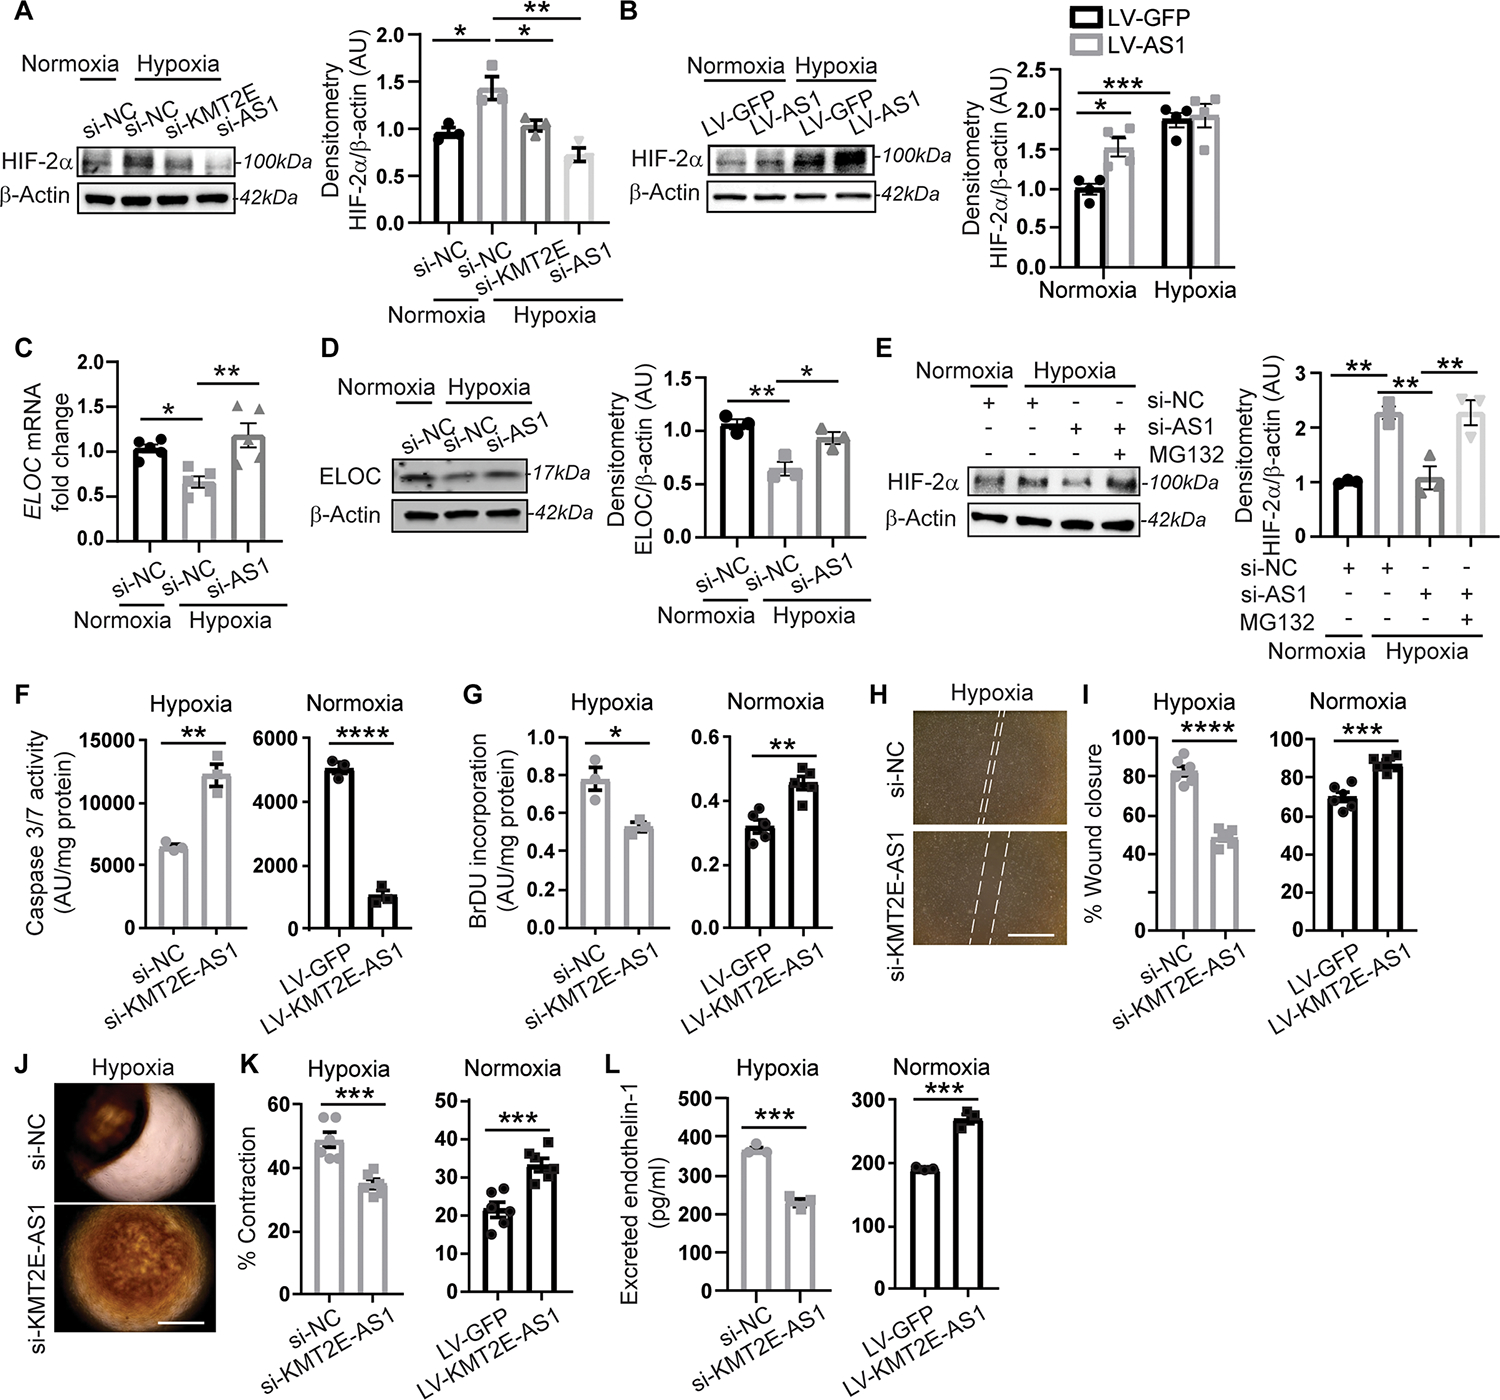
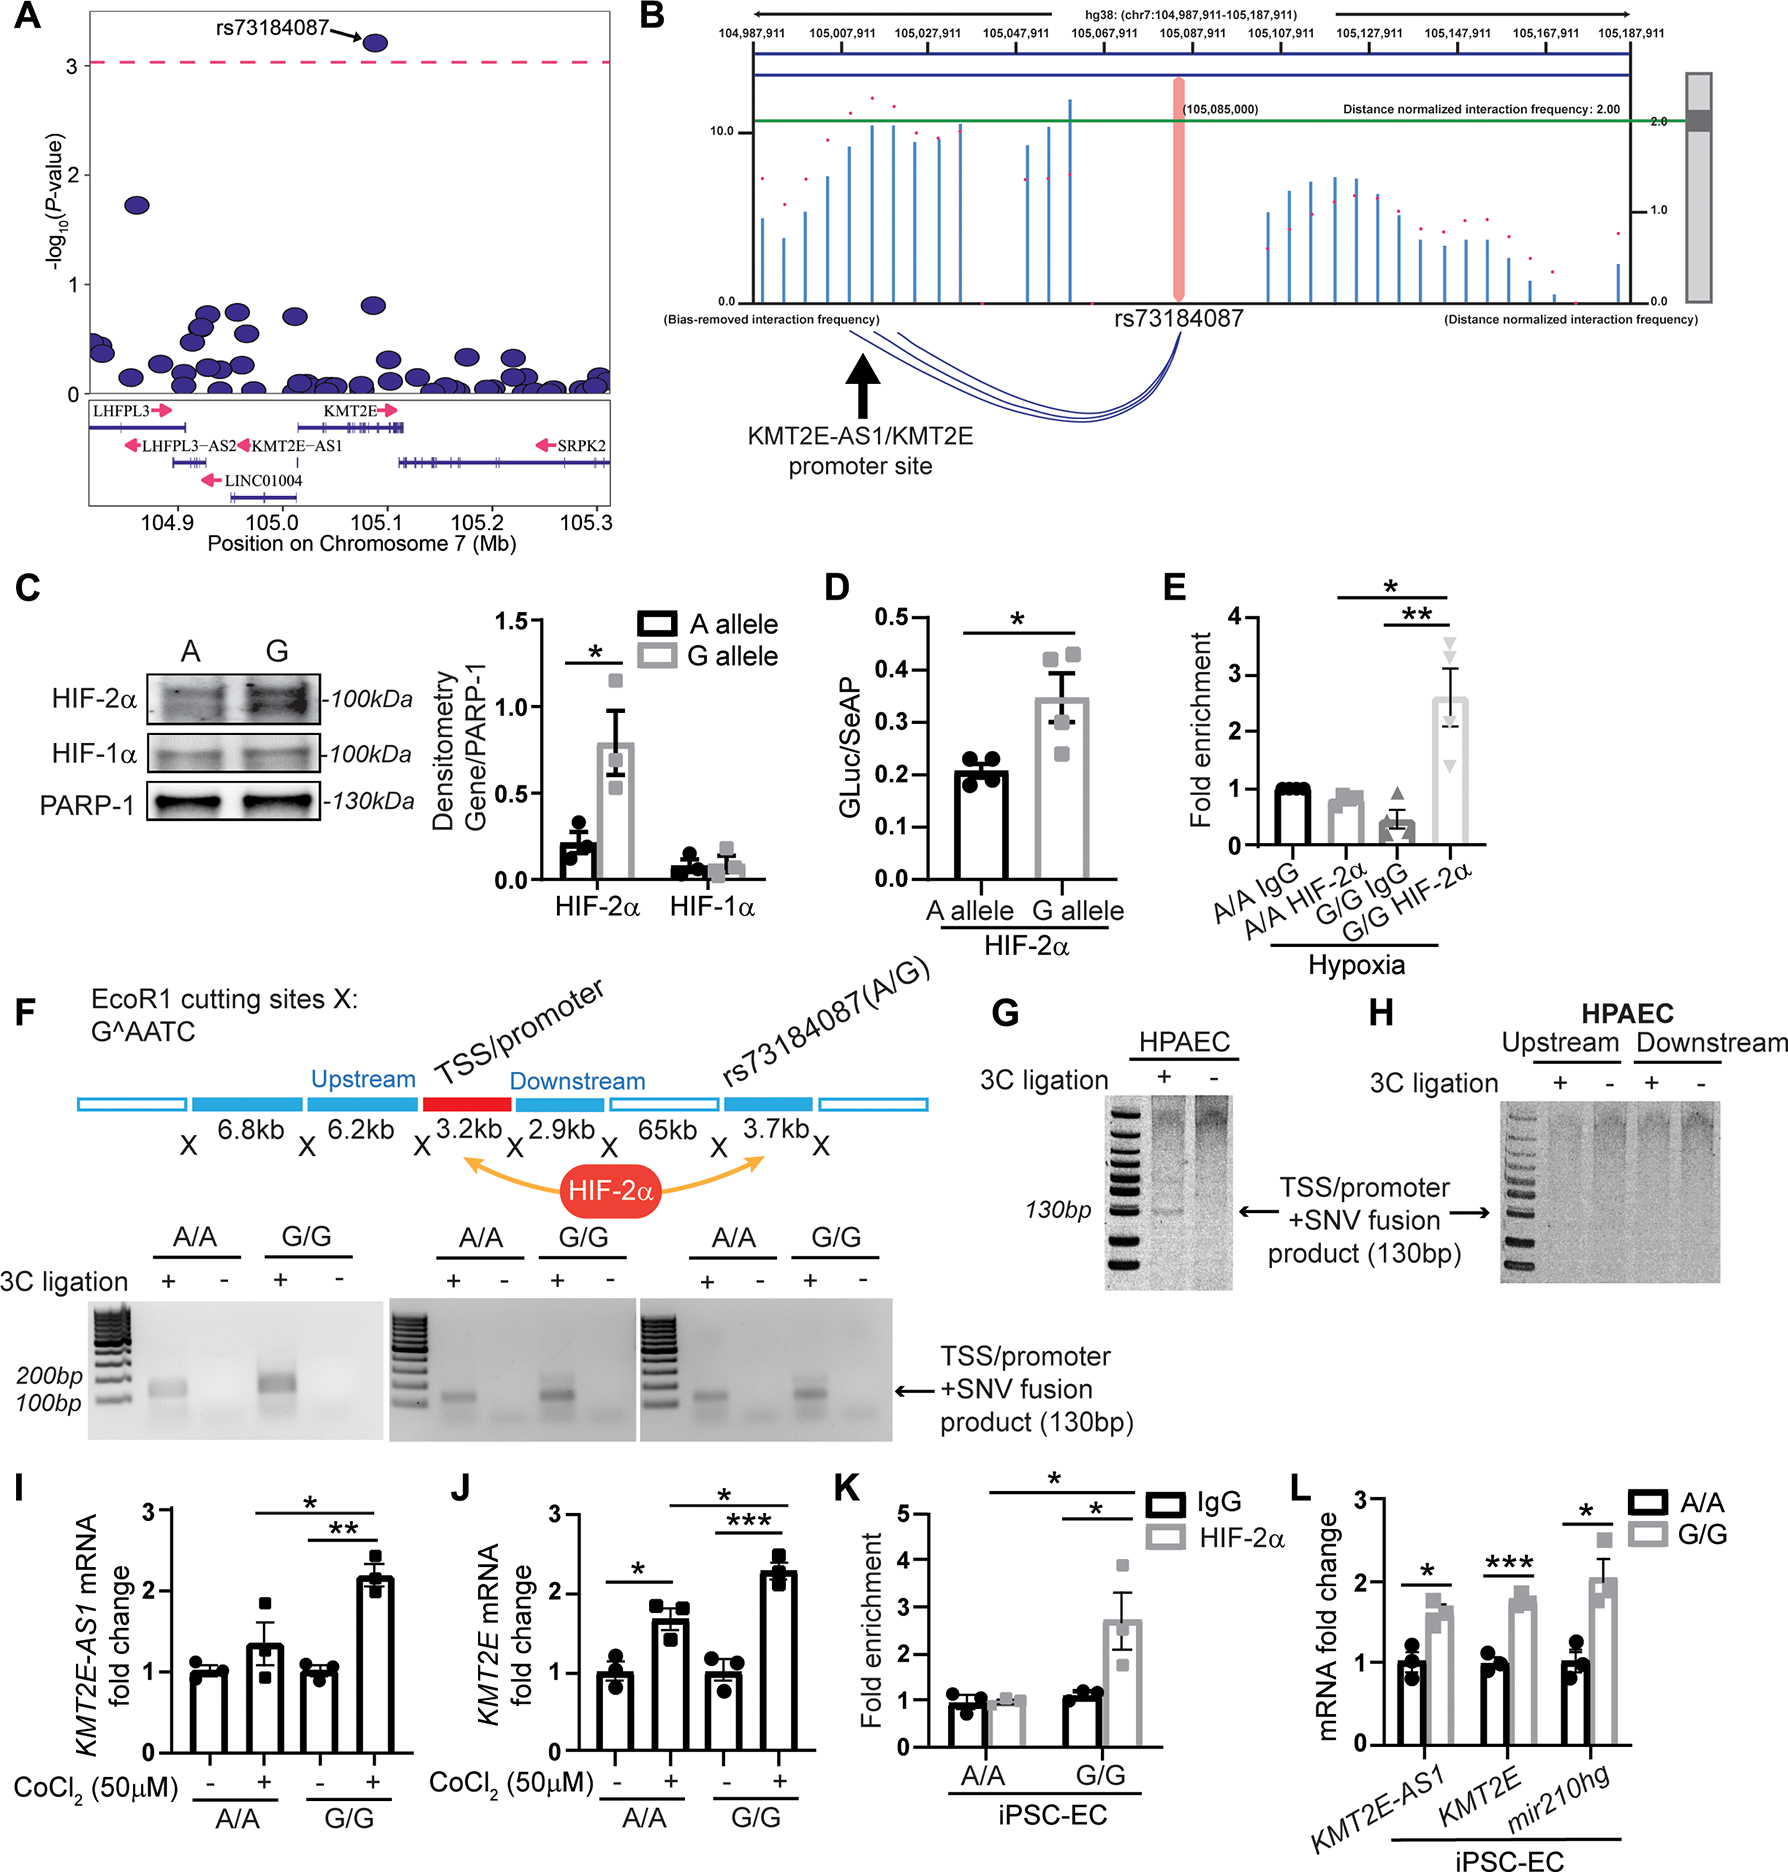
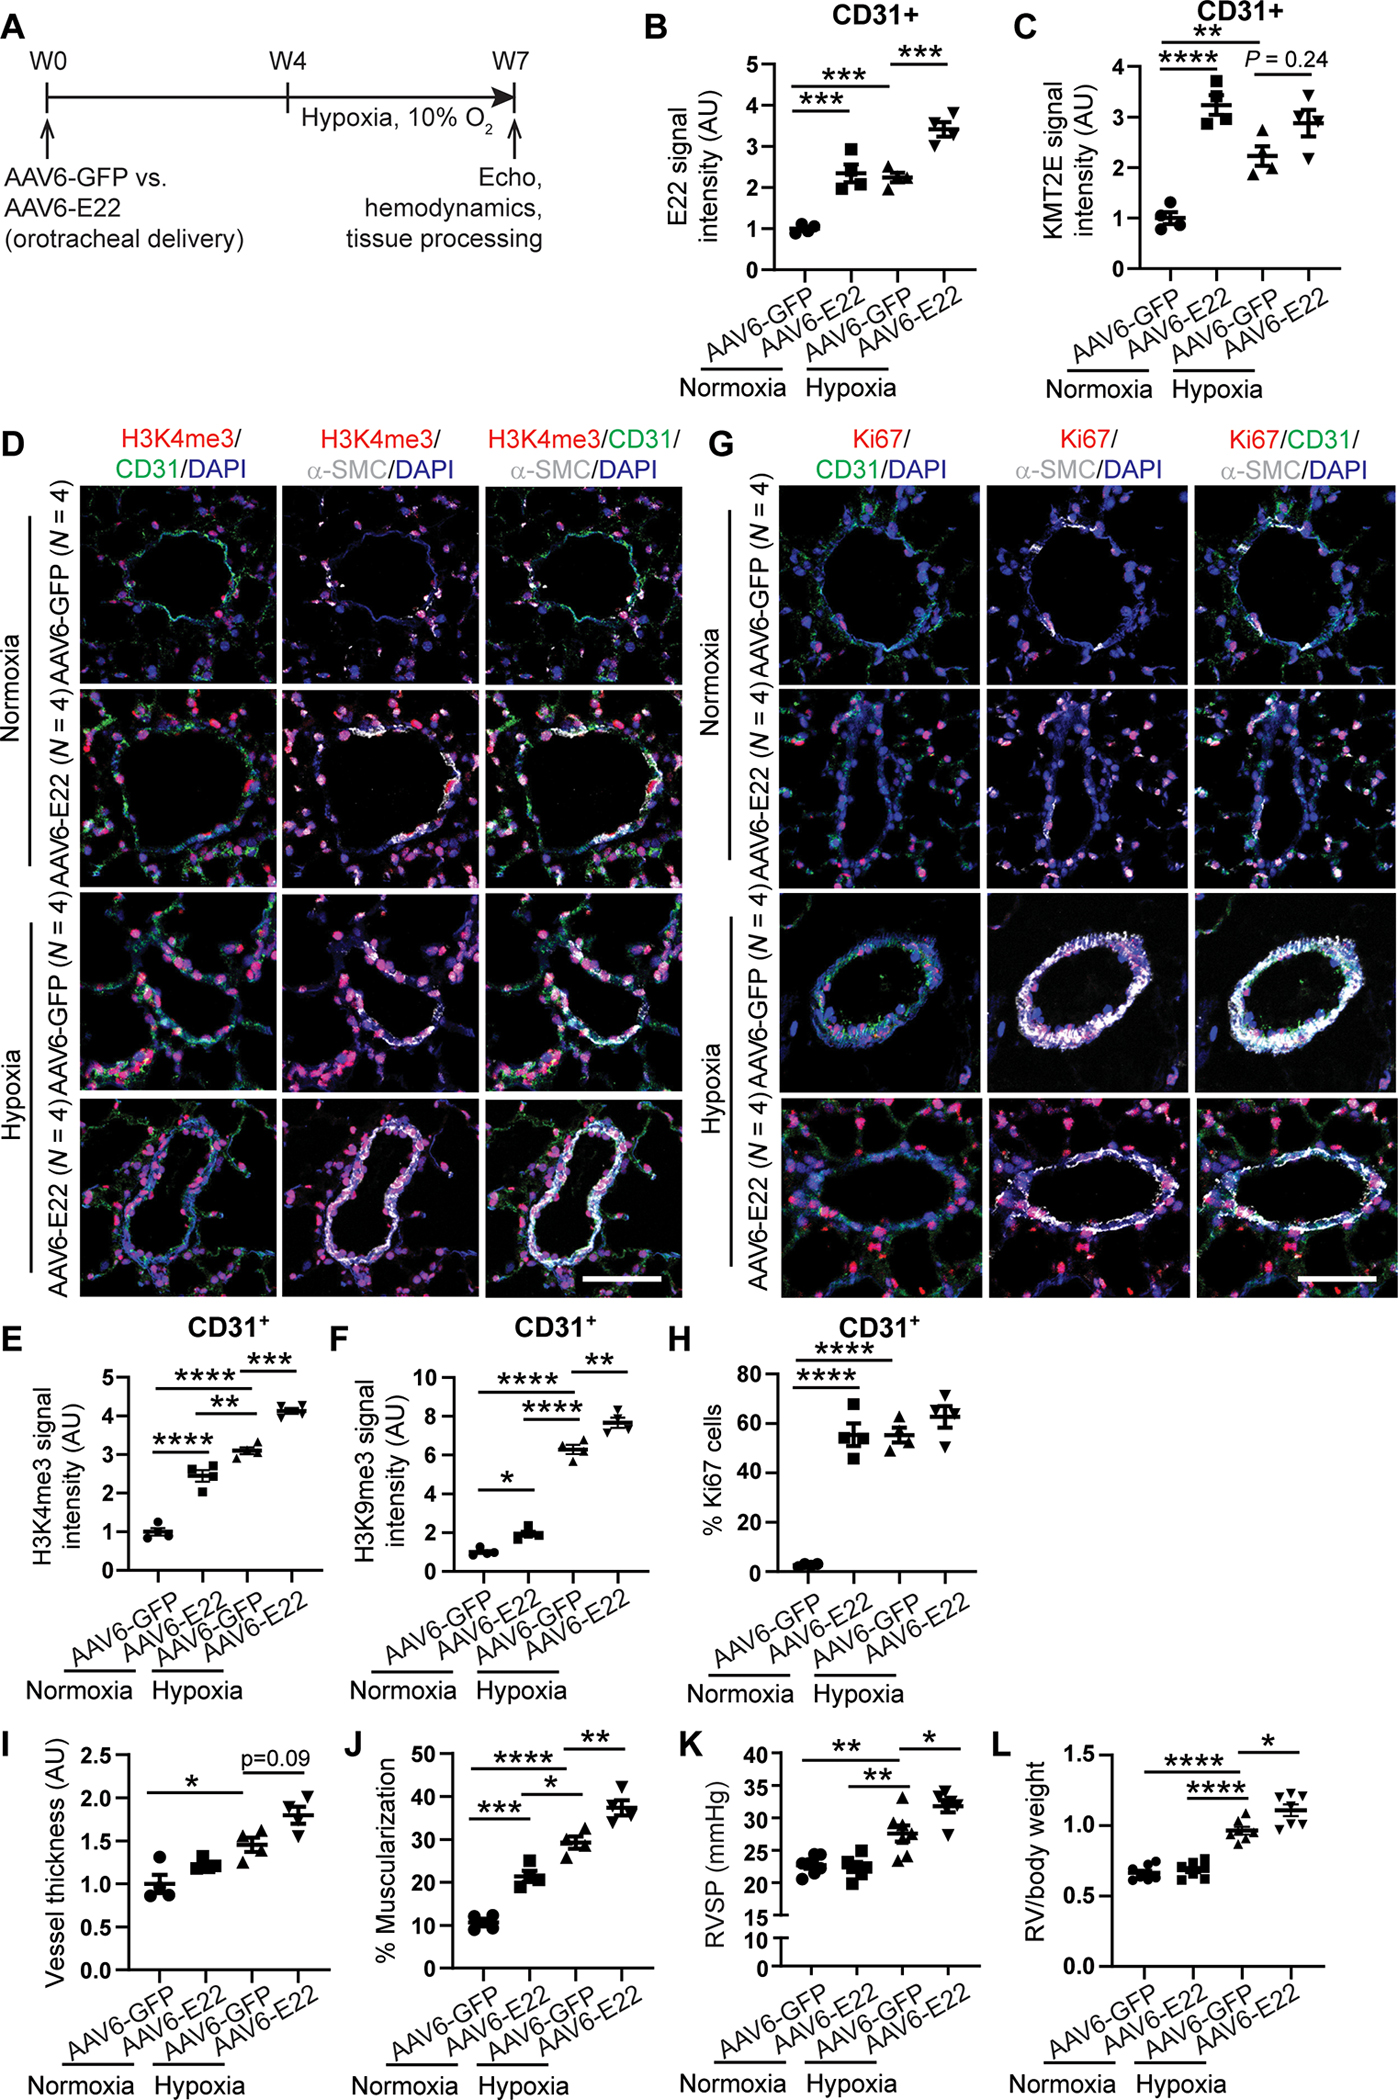
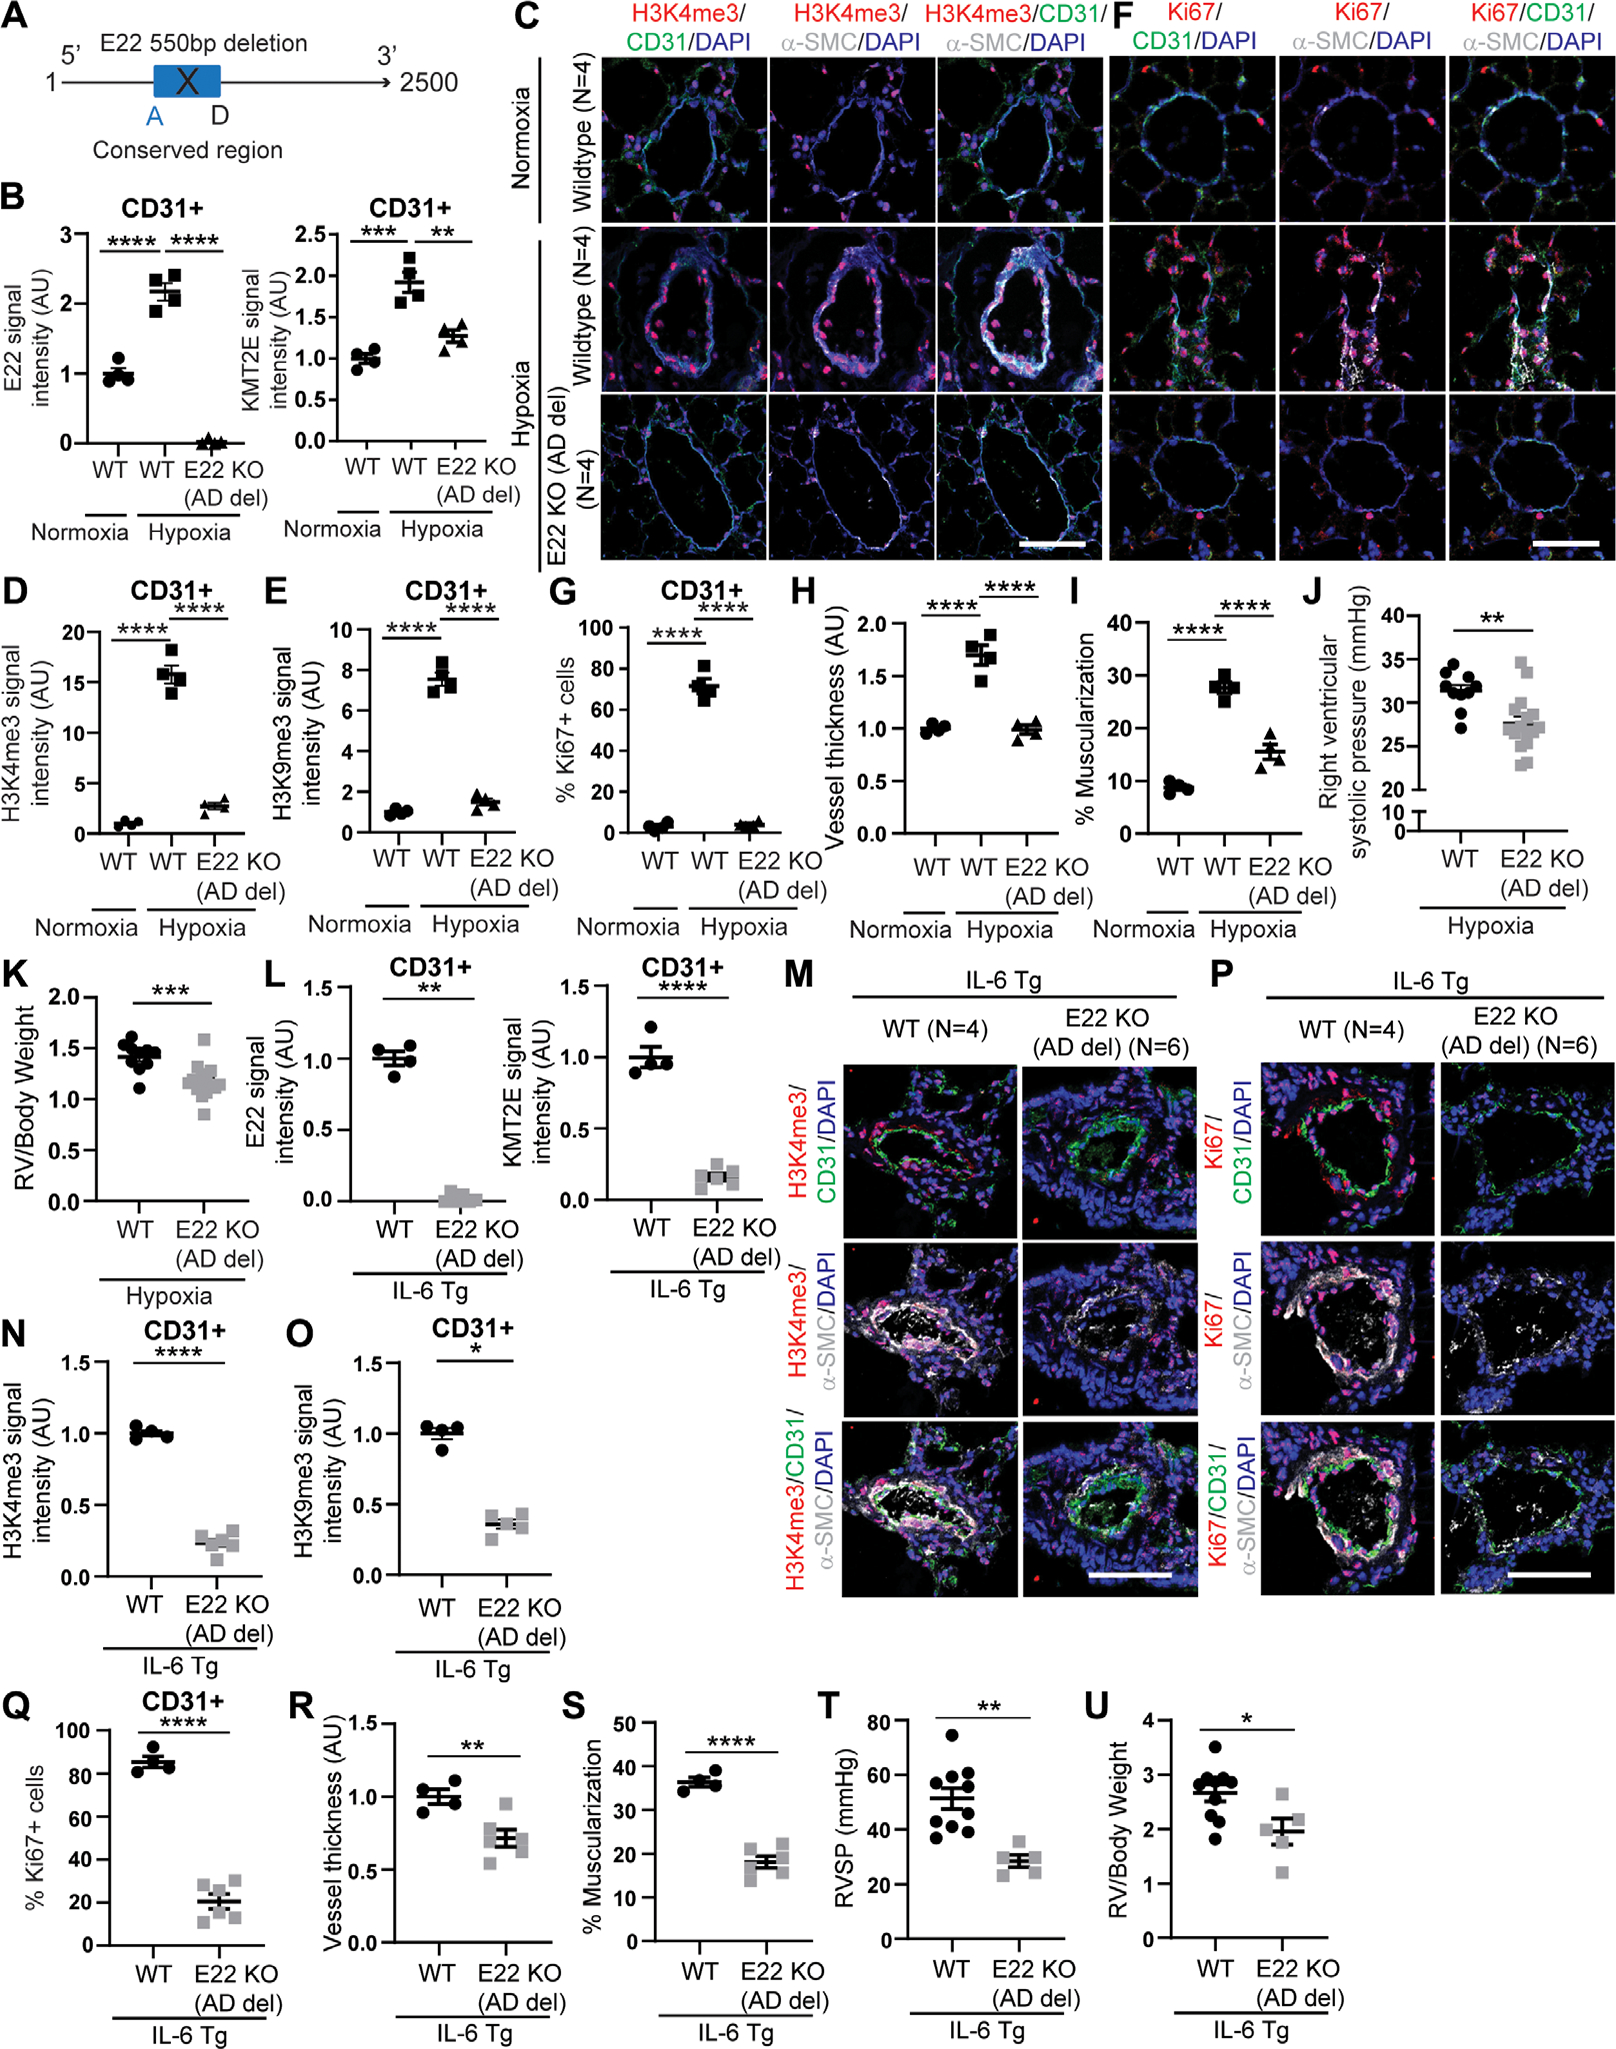
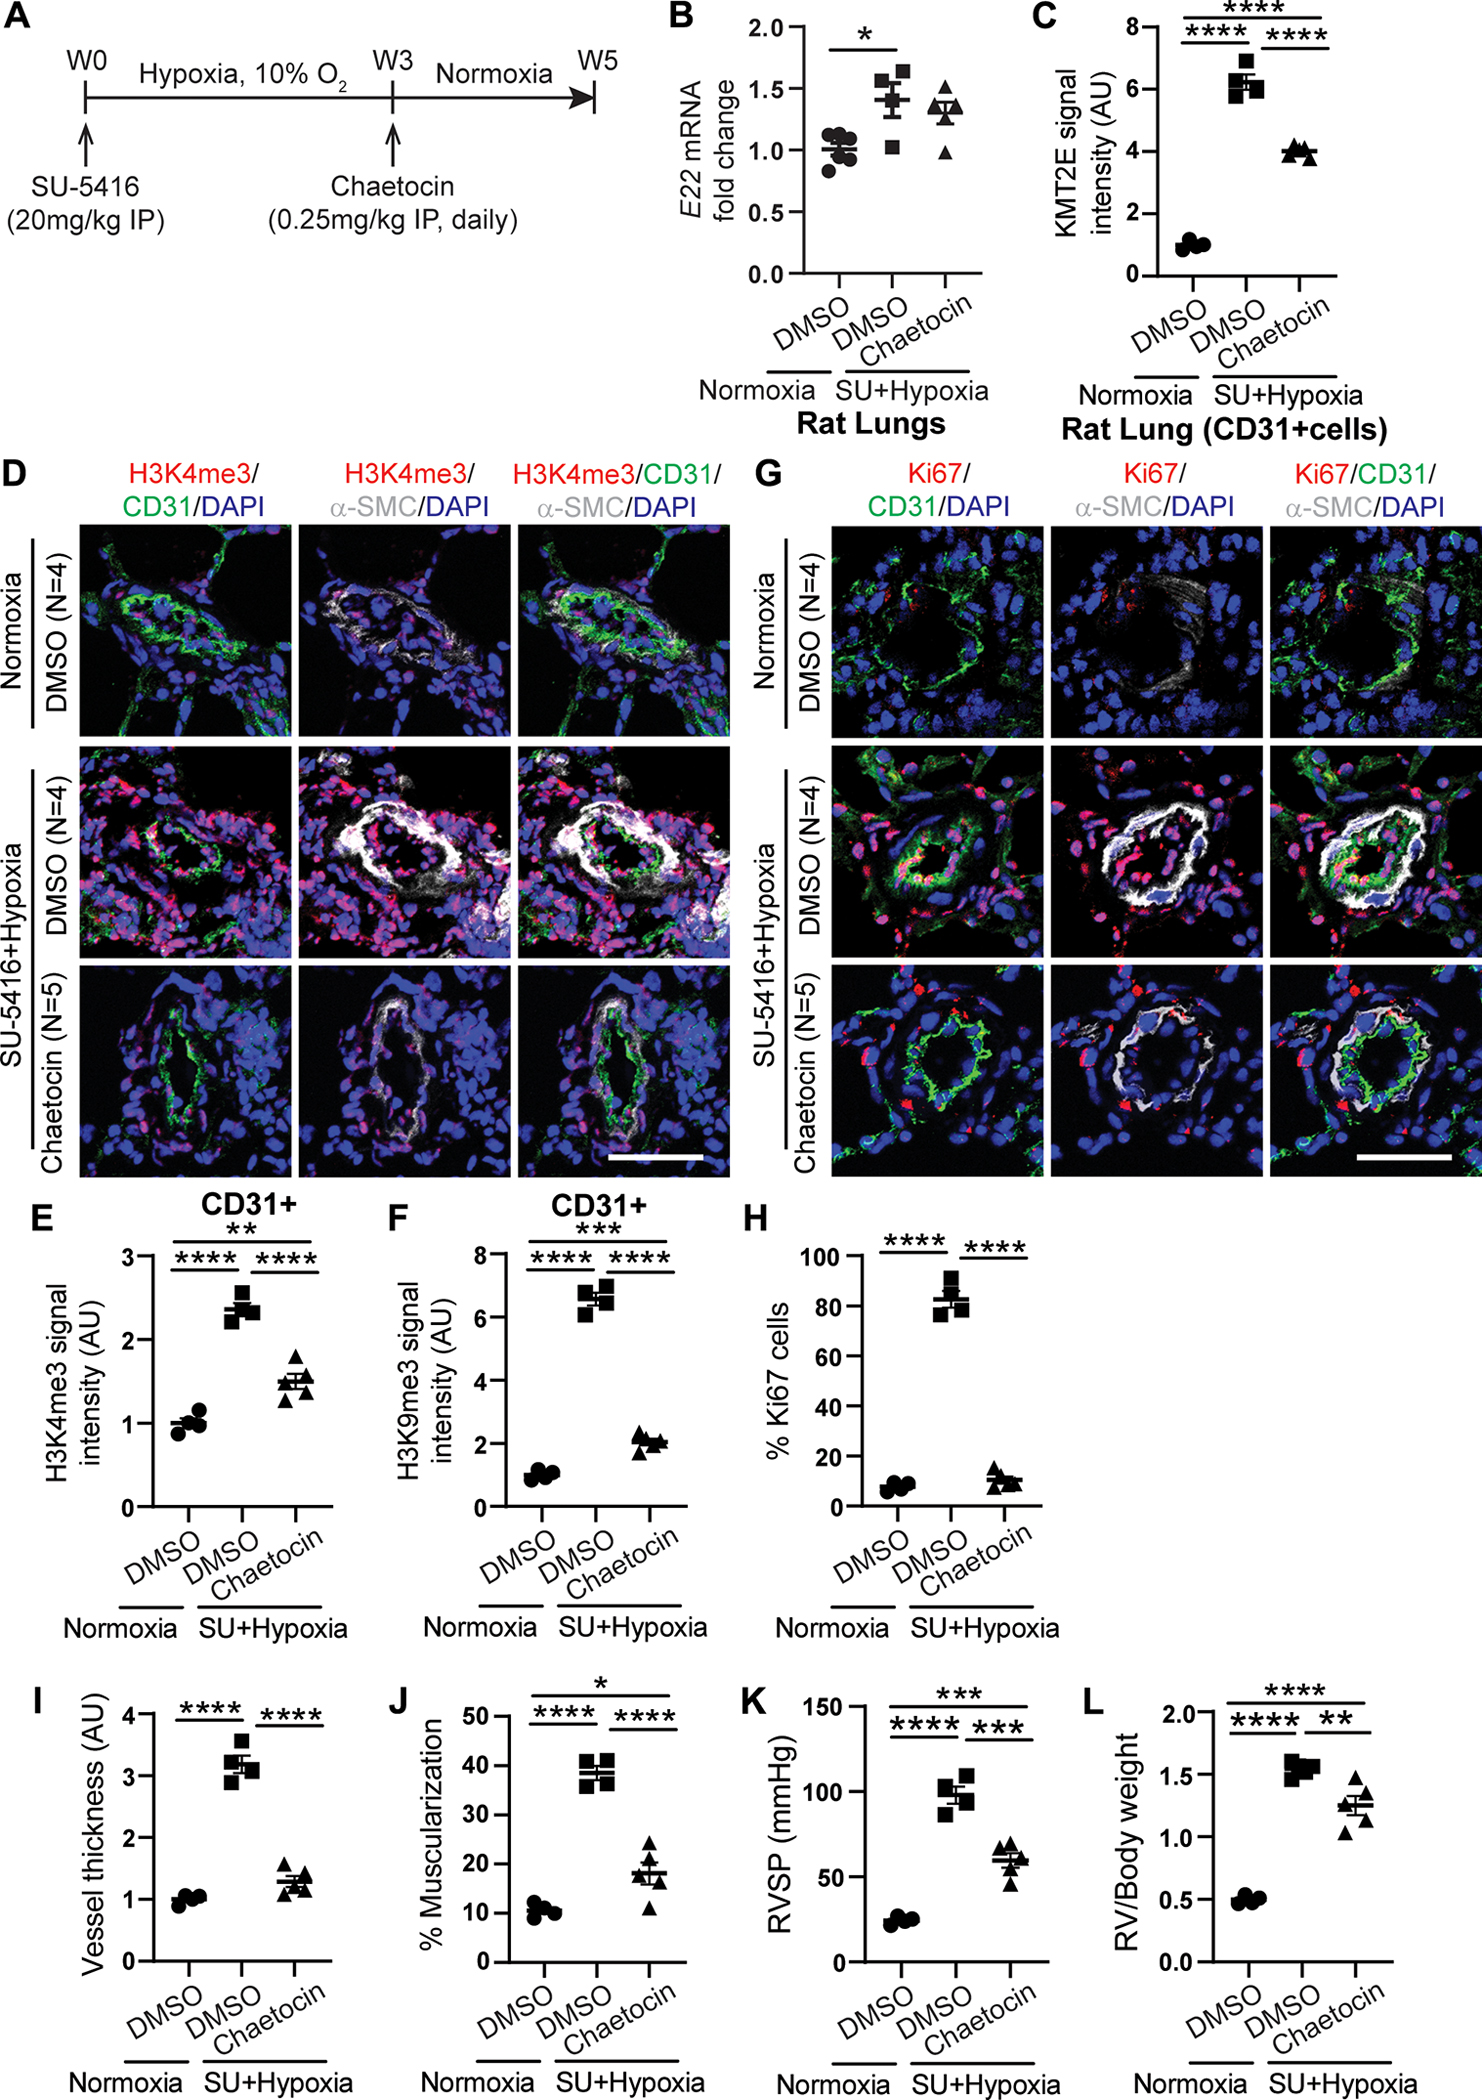
Hypoxic reprogramming of vasculature relies on genetic, epigenetic, and metabolic circuitry, but the control points are unknown. In pulmonary arterial hypertension (PAH), a disease driven by hypoxia inducible factor (HIF)-dependent vascular dysfunction, HIF-2α promoted expression of neighboring genes, long noncoding RNA (lncRNA) histone lysine N-methyltransferase 2E-antisense 1 (KMT2E-AS1) and histone lysine N-methyltransferase 2E (KMT2E). KMT2E-AS1 stabilized KMT2E protein to increase epigenetic histone 3 lysine 4 trimethylation (H3K4me3), driving HIF-2α-dependent metabolic and pathogenic endothelial activity. This lncRNA axis also increased HIF-2α expression across epigenetic, transcriptional, and posttranscriptional contexts, thus promoting a positive feedback loop to further augment HIF-2α activity. We identified a genetic association between rs73184087, a single-nucleotide variant (SNV) within a KMT2E intron, and disease risk in PAH discovery and replication patient cohorts and in a global meta-analysis. This SNV displayed allele (G)-specific association with HIF-2α, engaged in long-range chromatin interactions, and induced the lncRNA-KMT2E tandem in hypoxic (G/G) cells. In vivo, KMT2E-AS1 deficiency protected against PAH in mice, as did pharmacologic inhibition of histone methylation in rats. Conversely, forced lncRNA expression promoted more severe PH. Thus, the KMT2E-AS1/KMT2E pair orchestrates across convergent multi-ome landscapes to mediate HIF-2α pathobiology and represents a key clinical target in pulmonary hypertension.


Figures

Fig. 1.
Fig. 1.. Human KMT2E-AS1 and neighboring KMT2E are up-regulated across in vivo and in vitro models of PH.
(A) Gene structure of mouse lncRNA 5031425E22Rik (E22) located adjacent to protein-coding gene Kmt2e is encoded on the opposite DNA strand and positioned in the opposite transcriptional direction. human lncRNA ortholog KMT2E-AS1 and neighboring gene KMT2E show similar genomic architecture; sequence conservation (purple box 500 bp region) is shown within mouse E22 and human KMT2E-AS1. (B to E) human lncRNA KMT2E-AS1 and KMT2E transcripts in lung tissue (B and C) (n = 7 to 10; *P < 0.05, unpaired Student’s t test; data represent the mean ± SEM) and cd31+ cells (d and e) (n = 3 or 4; *P < 0.05, **P < 0.01, unpaired Student’s t test; data represent the mean ± SEM) of patients with WSPH group 1 PAH (table S1). (F to H) representative FISH and immunofluorescence (IF) staining and quantifications of KMT2E-AS1 (red; F), KMT2e (red; G), and h3K4me3 (red; H) in cd31+ endothelium of human lung from individuals with group 1 and group 3 PH versus non-PH controls (n = 5 to 8; ***P < 0.001, ****P < 0.0001 versus no PH, one-way ANOVA followed by Bonferroni’s post hoc analysis; data represent the mean ± SEM). Scale bars, 50 μm. (I) KMT2E-AS1 transcript in cultured PAECs, adventitial fibroblasts (PAAFs), and PASMCs (n = 4 to 6; **P < 0.01, ***P < 0.001, unpaired Student’s t test; data represent the mean ± SEM). (J) KMT2E transcript in human PAECs, PASMCs, and PAAFs (n = 4 to 6; ****P < 0.0001, unpaired Student’s t test for PAECs and PAAFs, Mann-Whitney test for PASMCs; data represent mean ± SEM). (K) KMT2E-AS1 (right graph) in cytosolic and nucleic fractions of human cell types [glyceraldehyde phosphate dehydrogenase (GAPDH) and U1 small nuclear RNA (snRNA) served as cytoplasmic and nuclear controls, respectively; left graphs] (n = 3; *P < 0.05, ****P < 0.0001, unpaired Student’s t test; data represent mean ± SEM). DAPI, 4′,6-diamidino-2-phenylindole; AU, arbitrary units.
Fig. 2.
Fig. 2.. KMT2E-AS1 interacts with KMT2E to enhance protein stability and increase histone 3 lysine 4 trimethylation (H3K-4me3).
(A and B) KMT2E-AS1 (a) and KMT2E (B) transcripts in hypoxic human PAECs with knockdown (siRNA) of HIF-2α and/or HIF-1α versus normoxic scramble control (NC) (n = 4 to 6; **P < 0.01, ***P < 0.001, ****P < 0.0001, one-way ANOVA followed by Bonferroni’s post hoc analysis; data represent mean ± SEM). (C) KMT2E-AS1, KMT2E, and HIF-2α transcripts in normoxic human PAECs with overexpression of a constitutively active HIF-2α (lV-HIF-2α versus LV-GFP control) (n = 4; ****P < 0.0001, unpaired Student’s t test; data represent mean ± SEM). (D) HIF-2α and KMT2e proteins in normoxic human PAECs transduced with lV-HIF-2α versus LV-GFP control (n = 3; ***P < 0.001, unpaired Student’s t test; data represent mean ± SEM). (E) KMT2E-AS1 transcript in human PAECs under hypoxia and siRNA knockdown of KMT2E or KMT2E-AS1 (n = 4; ***P < 0.001, one-way ANOVA followed by Bonferroni’s post hoc analysis; data represent mean ± SEM). (F) KMT2e protein in human PAECs under hypoxia and knockdown of KMT2E or KMT2E-AS1 (n = 4; *P < 0.05, **P < 0.01, one-way ANOVA followed by Bonferroni’s post hoc analysis; data represent mean ± SEM). (G) KMT2E-AS1 transcript in human PAECs posttransduction with KMT2E-AS1 lentivirus (LV-AS1) versus GFP control (LV-GFP) under normoxia (left) and hypoxia (right) (n = 3; **P < 0.01, unpaired Student’s t test; data represent mean ± SEM). (H) KMT2e protein in human PAECs transduced as in (G) by (n = 3; *P < 0.05, **P < 0.01, two-way ANOVA followed by Bonferroni’s post hoc analysis; data represent mean ± SEM). (I) KMT2E transcript in human PAECs under hypoxia and KMT2E-AS1 knockdown or 4 hour (4h) exposure to the transcriptional inhibitor actinomycin D (ActD) (n = 6; *P < 0.05, **P < 0.01, ****P < 0.0001, one-way ANOVA followed by Bonferroni’s post hoc analysis; data represent mean ± SEM). (J) KMT2e protein in human PAECs after KMT2E-AS1 knockdown or actinomycin d (ActD) exposure under hypoxia (n = 3; *P < 0.05, **P < 0.01, one-way ANOVA followed by Bonferroni’s post hoc analysis; data represent mean ± SEM). ns, not significant. (K) RNA immunoprecipitation (RIP)–qPCR [IP: KMT2e versus immunoglobulin G (IgG) negative control] of KMT2e protein in normoxia and hypoxia (left immunoblot). KMT2E-AS1 transcript in the IP fraction of human PAECs after KMT2E-AS1 knockdown or ActD exposure (4 hours) under hypoxia (right graph) (n = 4; *P < 0.05, **P < 0.01, Kruskal Wallis test followed by dunn’s post hoc analysis; data represent mean ± SEM). (L) KMT2e protein in human PAECs after KMT2E-AS1 knockdown or proteasomal inhibitor MG132 in hypoxia (n = 4; *P < 0.05, **P < 0.01, ****P < 0.0001, one-way ANOVA followed by Bonferroni’s post hoc analysis; data represent mean ± SEM). (M) h3K4me3, h3K9me3, and h3K27me3 in human PAECs after hypoxia and KMT2E-AS1 knockdown (n = 3; *P < 0.05, **P < 0.01, one-way ANOVA followed by Bonferroni’s post hoc analysis for H3K4me3 and H3K9me3, Kruskal-Wallis test followed by dunn’s post hoc analysis for H3K27me3; data represent mean ± SEM). (N) nuclear interaction of H3K4me3 marks and KMT2e protein, measured by proximity ligation assay (PLA; red, left images) and quantified by PLA counts per cell (right graph) in human PAECs after lentiviral expression of KMT2E-AS1 (full length) or KMT2E-AS1 deletion mutant (fig. S8) versus GFP control (n = 3 or 4; ***P < 0.001, one-way ANOVA followed by Bonferroni’s post hoc analysis; data represent mean ± SEM). Scale bar, 20 μm. (O) H3K4me3 in human PAECs under lentiviral expression of KMT2E-AS1 (full length) or KMT2E-AS1 deletion mutant (n = 3; **P < 0.01, one-way ANOVA followed by Bonferroni’s post hoc analysis; data represent mean ± SEM).
Fig. 3.
Fig. 3.. KMT2E-AS1 regulates a gene network driving hypoxic metabolic reprogramming.
(A) RNA sequencing of human PAECs revealed that 2480 genes are altered by hypoxia and reversed by either KMT2E-AS1 or KMT2E in hypoxia. GSEA reveals the major biological processes represented by these reversed genes. (B) heatmaps display genes in hypoxia and metabolism networks that are altered by hypoxia (leftmost column) and are reversed by KMT2E-AS1 (middle column) and KMT2E (rightmost column) knockdown in hypoxia. Adjusted P < 0.05 for each gene shown. H3K4me3 ChIP-Seq was also performed in hypoxic versus normoxic PAECs. A subcohort of these genes displays increased h3K4me3 marks in hypoxia by co-analyzing these ChIP-Seq and RNA sequencing data (* indicates methylated genes with adjusted P < 0.05). (C) ChIP qPCR of h3K4me3 binding at the promoter site of the lncRNA miR210hg (n = 3; **P < 0.01, ****P < 0.0001, two-way ANOVA followed by Bonferroni’s post hoc analysis; data represent mean ± SEM). (D and E) extracellular acidification rate (ECAR) (d) and baseline OCR (E) of human PAECs after KMT2E-AS1 knockdown and HIF-2α overexpression (n = 10 to 12; *P < 0.05, ****P < 0.0001, one-way ANOVA followed by Bonferroni’s post hoc analysis; data represent mean ± SEM). (F and G) ECAR (F) and baseline OCR (G) after KMT2E-AS1 overexpression (n = 12; *P < 0.05, ***P < 0.001, unpaired Student’s t test; data represent mean ± SEM). (H and I) LDH enzymatic activity of human PAECs after KMT2E-AS1 knockdown (H) and KMT2E-AS1 overexpression (I), a representative measure of glycolysis (n = 4; *P < 0.05, ***P < 0.001, ****P < 0.0001, two-way ANOVA followed by Bonferroni’s post hoc analysis; data represent mean ± SEM). (J) VEGF abundance in hypoxic PAECs after knockdown of KMT2E and KMT2E-AS1 (n = 4; **P < 0.01, ***P < 0.001, ****P < 0.0001, one-way ANOVA followed by Bonferroni’s post hoc analysis; data represent mean ± SEM), overlayed with ChIP-seq of h3K4me3 at the VEGFA gene in hypoxia versus normoxia.
Fig. 4.
Fig. 4.. KMT2E-AS1 induces HIF-2α activation and prevents HIF-2α degradation in driving endothelial pathophenotypes.
(A and B) HIF-2α protein in hypoxic human PAECs after knockdown of KMT2E-AS1 (a) and overexpression of KMT2E-AS1 (B) (n = 3 or 4; *P < 0.05, **P < 0.01, ***P < 0.001, one-way (A) or two-way (B) ANOVA followed by Bonferroni’s post hoc analysis; data represent mean ± SEM. (C and D) ELOC RNA (c) and protein (D) expression in human PAECs after hypoxia and KMT2E-AS1 knockdown (Fig. 3B) (n = 3 to 5; *P < 0.05, **P < 0.01, one-way ANOVA followed by Bonferroni’s post hoc analysis; data represent mean ± SEM). (E) HIF-2α protein in human PAECs after KMT2E-AS1 knockdown and MG132 treatment (n = 3; **P < 0.01, one-way ANOVA followed by Bonferroni’s post hoc analysis; data represent mean ± SEM). (F) apoptotic caspase 3/7 activity in human PAECs after KMT2E-AS1 knockdown under hypoxia (left) and KMT2E-AS1 overexpression under normoxia (right) (n = 3; **P < 0.01, ****P < 0.0001, unpaired Student’s t test; data represent mean ± SEM). (G) BrdU proliferative potential after KMT2E-AS1 knockdown in hypoxia (left) and forced KMT2E-AS1 expression in normoxia (right) (n = 3 to 5; *P < 0.05, **P < 0.01, unpaired Student’s t test; data represent mean ± SEM). (H and I) Scratch wound healing assay (h) measures migration of human PAECs after KMT2E-AS1 knockdown under hypoxia (left, I) and KMT2E-AS1 overexpression in normoxia (right, I) (n = 6; ***P < 0.001, ****P < 0.0001, unpaired Student’s t test; data represent mean ± SEM). (J and K) human PASMC contraction in gel matrix (J) with conditioned media from PAECs after knockdown of KMT2E-AS1 under hypoxia (K, left graph) and after forced expression of KMT2E-AS1 under normoxia (K, right graph) (n = 6; ***P < 0.001, unpaired Student’s t test; data represent mean ± SEM). (L) endothelin-1 in conditioned media from human PAECs after KMT2E knockdown under hypoxia (left) and forced KMT2E expression in normoxia (right) by enzyme linked immunosorbent assay (n = 3; ***P < 0.001, unpaired Student’s t test; data represent mean ± SEM).
Fig. 5.
Fig. 5.. G allele of KMT2E SNV rs73184087 binds HIF-2α to control the KMT2E-AS1/KMT2E pair.
(A) among 883 genotyped and imputed SNVs in the PAH discovery cohort (table S5) within and flanking (+/−200 kb) the lncRNA KMT2e locus, SNVs (table S6) are displayed with predicted HIF-2α binding to either the minor or major SNV allele. independent effective SNV test count was calculated at 53.84 (46). Of those, SNV rs73184087 ranks the highest and meets the P value threshold of 0.00093 (as indicated by the dashed line on the plot). (B) high throughput chromatin conformation capture (HI-C) in lung tissue (29) displays long range interactions between SNV rs73184087 and the transcription start site/promoter region of KMT2E-AS1/KMT2e (as indicated by the blue arcs below the graph). A distance-normalized frequency (magenta dots) greater than the threshold of 2.0 by default (green line) defines a significant interaction with a SNV. (C) SNV binding of HIF-2α and HIF-1α is compared across the SNV a versus G allele (n = 3; *P < 0.05, unpaired Student’s t test; data represent mean ± SEM). (D) Luciferase activity in protein lysates of human embryonic kidney 293T cells transfected with a constitutively active HIF-2α plasmid and a luciferase reporter plasmid carrying the lncRNA-KMT2E promoter and SNV rs73184087 (A versus G allele) (n = 4; *P < 0.05, unpaired Student’s t test; data represent mean ± SEM). Luciferase activity is normalized to constitutively secreted alkaline phosphatase (GLuc/SeAP). (E) ChIP qPCR of HIF-2α binding to SNV in hypoxic transformed lymphocytes from patients with WSPH group 1 PAH carrying SNV rs73184087 (G/G) versus (A/A) genotypes (table S2) (n = 4; *P < 0.05, **P < 0.01, Kruskal-Wallis test followed by dunn’s post hoc analysis; data represent mean ± SEM). (F) In a chromatin conformation capture (3c) assay (top diagram) with three pairs of matched transformed lymphocytes (A/A versus G/G) from patients with WSPH group 1 PAH, PCR is used to detect transcription start site (TSS)/promoter + SNV fusion products indicative of an interaction between SNV rs73184087 and the lncRNA KMT2E promoter. (G and H) detection of a lncRNA-KMT2E promoter and SNV fusion product (G) by 3c assay in human PAECs versus detection of negative control ligation products representing SNV interactions upstream or downstream of the promoter (h). (I and J) KMT2E-AS1 (I) and KMT2E (J) transcripts in transformed lymphocytes carrying A/A or G/G genotype with HIF-α induction by cobalt chloride (50 μM) by RT-qPCR (n = 3; *P < 0.05, **P < 0.01, ***P < 0.001, two-way ANOVA followed by Bonferroni’s post hoc analysis; data represent mean ± SEM). (K) ChIP-qPCR of HIF-2α binding with SNV in inducible pluripotent stem cell differentiated endothelial cells (IPSC-ECS) carrying G/G versus A/A genotype (n = 3; *P < 0.05, two-way ANOVA followed by Bonferroni’s post hoc analysis; data represent mean ± SEM). (L) KMT2E-AS1, KMT2E, and miR210hg transcripts in IPSC-ECS carrying A/A versus G/G genotype by RT-qPCR (n = 3; *P < 0.05, ***P < 0.001, unpaired Student’s t test; data represent mean ± SEM).
Fig. 6.
Fig. 6.. Pulmonary vascular delivery of an AAV6-E22 transgene promotes PH in mice.
(A) experimental design for an AAV serotype 6 (AAV6) carrying either GFP or E22 transgene delivered orotracheally to wild type c57Bl6 mice 4 weeks before exposure to 3 weeks of chronic hypoxia. (B and C) E22 (B) and KMT2e (c) expression in mouse AAV6-GFP or AAV6-E22 mouse lung CD31+ endothelial cells by FISH and IF staining (n = 4; ***P < 0.001, two-way ANOVA followed by Bonferroni’s post hoc analysis; data represent mean ± SEM). (D to H) representative IF images for H3K4me3 (red; d) and Ki67 proliferation marker stains (red; G) in AAV6-E22 versus AAV6-GFP mouse lungs. IF quantifications in pulmonary CD31+ vascular endothelium of H3K4me3 (E), H3K9me3 (F), and Ki67 (H) expression (n = 4; *P < 0.05, **P < 0.01, ***P < 0.001, ****P < 0.0001, two-way ANOVA followed by Bonferroni’s post hoc analysis; data represent mean ± SEM). Scale bars, 50 μm. (I and J) Vessel thickness (I) and muscularization (J) for normoxic and hypoxic AAV6 E22 versus AAV6 GFP mouse lungs as indicated by α-S MA staining (white; d, G) (n = 4; *P < 0.05, **P < 0.01, ***P < 0.001, ****P < 0.0001, two-way ANOVA followed by Bonferroni’s post hoc analysis; data represent mean ± SEM). (K and L) right ventricular systolic pressure (RVSP, K) and RV/body weight mass index (l) in AAV6-E22 versus AAV6-GFP mice (n = 6 or 7; *P < 0.05, **P < 0.01, ****P < 0.0001, two-way ANOVA followed by Bonferroni’s post hoc analysis; data represent mean ± SEM).
Fig. 7.
Fig. 7.. E22 knockout mice display decreased KMT2E and H3K4me3 along with disease improvement in mouse models of WSPH groups 1 and 3 PH.
(A) CRISPR-Cas9 edited mice deficient in a conserved 500-bp sequence (denoted a and d) shared between human KMT2E-AS1 and mouse E22. (B) FISH and IF staining for full-length E22 and KMT2e expression in CD31+ lung endothelial cells of hypoxic E22 knockout (KO) mice with ad deletion versus wild-type (WT) controls (n = 4; **P < 0.01, ***P < 0.001, ****P < 0.0001, one-way ANOVA followed by Bonferroni’s post hoc analysis; data represent mean ± SEM). (C to G) representative IF images of H3K4me3 (red; C) and Ki67 (red; F) in hypoxic E22 (KO) mice versus wild-type (WT) controls. IF quantifications in CD31+ PAECs (green) for H3K4me3 (D), H3K9me3 (E), and Ki67 (G) expression (n = 4; ****P < 0.0001, one-way ANOVA followed by Bonferroni’s post hoc analysis; data represent mean ± SEM). Scale bars, 50 μm. (H to I) Vessel thickness (H) and muscularization (I) for E22 ad KO mice versus WT controls as indicated by α-SMA staining (white; C and F) (n = 4; ****P < 0.0001, one-way ANOVA followed by Bonferroni’s post hoc analysis; data represent mean ± SEM). (J and K) RVSP (J) and RV remodeling (RV/body weight ratio, K) in hypoxic E22 KO mice versus WT controls (n = 10 to 16; **P < 0.01, ***P < 0.001, unpaired Student’s t test; data represent mean ± SEM). (L) E22 and KMT2e expression in lung cd31+ endothelium of interleukin 6 transgenic (IL-6 TG) mice crossed onto E22 KO (ad deletion) mice by FISH and IF staining (n = 4 to 6; **P < 0.01, ****P < 0.0001, Mann-Whitney test for E22, unpaired Student’s t test for KMT2e; data represent mean ± SEM). (M to Q) representative IF images of h3K4me3 (red; M) and Ki67 (red; P). IF quantifications of h3K4me3 (N), h3K9me3 (O), and Ki67 (Q) in hypoxic IL-6 TG E22 KO mouse lung endothelium versus hypoxic IL-6 TG PAH mice [n = 4 to 6; *P < 0.05, ****P < 0.0001, unpaired Student’s t test for h3K4em3 (N) and Ki67 (Q), Mann-Whitney test for H3K9me3 (o); data represent mean ± SEM]. Scale bars, 50 μm. (R and S) Vessel thickness (R) and muscularization (S) for IL-6 TG E22 KO mice versus WT controls (n = 4 to 6; **P < 0.01, ****P < 0.0001, unpaired Student’s t test; data represent mean ± SEM). (T and U) RVSP (T) and RV remodeling (U) in IL-6 TG e22 KO mice versus controls (n = 5 to 10; *P < 0.05, **P < 0.01, unpaired Student’s t test; data represent mean ± SEM).
Fig. 8.
Fig. 8.. The histone lysine methyltransferase inhibitor chaetocin alleviates PAH in a disease-reversal dosing protocol for SU5416 hypoxic rats.
(A) experimental design whereby Sprague-Dawley rats were dosed with SU5416 (SU) and exposed to chronic hypoxia for 3 weeks to generate PAH. Subsequently, PAH rats were dosed with chaetocin versus dimethyl sulfoxide (DMSO) vehicle control by intraperitoneal (IP) injection daily for 2 weeks in normoxia. (B) E22 transcript in lungs of DMSO- and chaetocin-treated SU + hypoxic rats compared with normoxic controls (n = 4 to 6; *P < 0.05, one-way ANOVA followed by Bonferroni’s post hoc analysis; data represent mean ± SEM). (C) IF staining quantification of KMT2E expression in CD31+ lung endothelial cells of DMSO and chaetocin-treated SU + hypoxic rats versus normoxic controls (n = 4 or 5; ****P < 0.0001, one-way ANOVA followed by Bonferroni’s post hoc analysis; data represent mean ± SEM). (D to H) representative IF images of H3K4me3 (red; D) and Ki67 (red; G). IF quantifications for h3K4me3 (E), H3K9me3 (F), Ki67 (h) in CD31+ PAECs (green) in SU5415 + hypoxic PAH rats versus controls (n = 4 or 5; **P < 0.01, ***P < 0.001, ****P < 0.0001, one-way ANOVA followed by Bonferroni’s post hoc analysis; data represent mean ± SEM). Scale bars, 50 μm. (I and J) Vascular thickness (I) and muscularization (J) for chaetocin treated SU5415 hypoxic PAH rats versus controls as indicated by α-SMA stain (white, d and e) (n = 4 or 5; *P < 0.05, ****P < 0.0001, one-way ANOVA followed by Bonferroni’s post hoc analysis; data represent mean ± SEM). (K and L) RVSP (K) and RV remodeling (RV/body weight ratio, l) in chaetocin-treated SU5415-hypoxic PAH rats versus controls (n = 4 or 5; **P < 0.01, ***P < 0.001, ****P < 0.0001, one-way ANOVA followed by Bonferroni’s post hoc analysis; data represent mean ± SEM).

Comment in

References

    1. Pullamsetti SS, Mamazhakypov A, Weissmann N, Seeger W, Savai R, Hypoxia-inducible factor signaling in pulmonary hypertension. J. Clin. Invest. 130, 5638–5651 (2020). - PMC - PubMed
    1. Dai Z, Li M, Wharton J, Zhu MM, Zhao YY, Prolyl-4 hydroxylase 2 (PHD2) deficiency in endothelial cells and hematopoietic cells induces obliterative vascular remodeling and severe pulmonary arterial hypertension in mice and humans through hypoxia-inducible factor 2α. Circulation 133, 2447–2458 (2016). - PMC - PubMed
    1. Michelakis ED, Spatio-temporal diversity of apoptosis within the vascular wall in pulmonary arterial hypertension: heterogeneous BMP signaling may have therapeutic implications. Circ Res. 98, 172–175 (2006). - PubMed
    1. culley MK, chan SY, Mitochondrial metabolism in pulmonary hypertension: Beyond mountains there are mountains. J. Clin. Invest. 128, 3704–3715 (2018). - PMC - PubMed
    1. Hemnes AR, Using Omics to Understand and Treat Pulmonary Vascular Disease. Front. Med. 5, 157 (2018). - PMC - PubMed

Publication types

Grants and funding