. 2024 Jan 10;16(729):eadh1334.
doi: 10.1126/scitranslmed.adh1334. Epub 2024 Jan 10.

mRNA therapy corrects defective glutathione metabolism and restores ureagenesis in preclinical argininosuccinic aciduria

Affiliations

mRNA therapy corrects defective glutathione metabolism and restores ureagenesis in preclinical argininosuccinic aciduria

Sonam Gurung et al. Sci Transl Med. .

Abstract

The urea cycle enzyme argininosuccinate lyase (ASL) enables the clearance of neurotoxic ammonia and the biosynthesis of arginine. Patients with ASL deficiency present with argininosuccinic aciduria, an inherited metabolic disease with hyperammonemia and a systemic phenotype coinciding with neurocognitive impairment and chronic liver disease. Here, we describe the dysregulation of glutathione biosynthesis and upstream cysteine utilization in ASL-deficient patients and mice using targeted metabolomics and in vivo positron emission tomography (PET) imaging using (S)-4-(3-18F-fluoropropyl)-l-glutamate ([18F]FSPG). Up-regulation of cysteine metabolism contrasted with glutathione depletion and down-regulated antioxidant pathways. To assess hepatic glutathione dysregulation and liver disease, we present [18F]FSPG PET as a noninvasive diagnostic tool to monitor therapeutic response in argininosuccinic aciduria. Human hASL mRNA encapsulated in lipid nanoparticles improved glutathione metabolism and chronic liver disease. In addition, hASL mRNA therapy corrected and rescued the neonatal and adult Asl-deficient mouse phenotypes, respectively, enhancing ureagenesis. These findings provide mechanistic insights in liver glutathione metabolism and support clinical translation of mRNA therapy for argininosuccinic aciduria.


Conflict of interest statement

Competing interests: JB reports research funding from Moderna Inc. JB, LT, DP, PG and SNW are inventors of patent application no PCT/GB2023/052174 “Gene therapy transgene cassette for the treatment of argininosuccinate lyase deficiency”. PFF, AC, SS, LR, PGVM, AF are employees of Moderna Inc. and may hold equities from the company. AF and LR are inventors of patent application no. PCT/US23/17573 “Lipid nanoparticles and polynucleotides encoding arginosuccinate lyase for the treatment of argininosuccinic aciduria”. The other authors declare no competing interests.

Figures

Figure 1
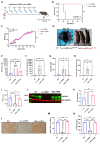
Figure 1. ASL-deficient patients and AslNeo/Neo mice show dysfunction of glutathione metabolism despite limited evidence of oxidative stress.
(A) Glutathione biosynthesis requires precursor metabolites glutamate, glycine, and cysteine, the latter being an intermediary metabolite from the transsulfuration pathway. Glutathione is degraded into cysteine-glycine by γ-glutamyl transferase through the γ-glutamyl cycle. (B) Mean of plasma total homocysteine in patients with OTCD (n=11-13), ASSD (n=10), ASLD (n=13). Plasma (C) total homocysteine, (D) cysteine, (E) γ-glutamyl-cysteine, (F) total glutathione, and liver (G) homocysteine, (H) cysteine, (I) γ-glutamyl-cysteine total thiols, and (J) total glutathione in 2-week old AslNeo/Neo mice and WT littermates. (K) Hepatic GGT activity measured in 2-week-old AslNeo/Neo mice and WT littermates. (L) Lipid peroxidation measured by thiobarbituric acid reactive substances in AslNeo/Neo mice and WT littermates. (M) Nitric oxide metabolites (nitrite and nitrate) in liver samples of AslNeo/Neo mice and WT littermates. (N) Quantification of liver nitrotyrosine by western blot between AslNeo/Neo mice and WT. mRNA expression of GCL subunits (O) GCLC, (P) GCLM, and (Q) GS in liver of AslNeo/Neo mice compared to WT littermates. Urea cycle dysfunction is shown by purple arrows. (R) Ingenuity pathway analysis of liver untargeted proteomics in AslNeo/Neo mice compared to WT littermates, highlighting downregulation of the main glutathione functions, detoxification of xenobiotic and endogenous compounds (black arrows), antioxidant activity (red arrows). (B) One-way ANOVA with Tukey’s post-hoc test. (C) Unpaired two-tailed Student’s t test performed on log-transformed data. Graph displays not transformed data. (D-Q) Unpaired two-tailed Student’s t test; * p<0.05, ** p<0.01, *** p<0.001, ns not significant. ASSD: argininosuccinate synthase deficiency; ASLD: argininosuccinate lyase deficiency; CyS: cysteine; GCLC: glutamylcysteine ligase catalytic subunit; GCLM: glutamylcysteine ligase modifier subunit; GS: glutathione synthase; GGT: Gamma-glutamyl transferase; GSH: glutathione; HcyS: homocysteine; MDA: malondialdehyde; OTCD: ornithine transcarbamylase deficiency. Graphs show means ±SD.
Figure 2
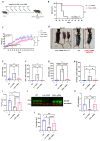
Figure 2. A non-invasive marker confirms the impaired glutathione metabolism in AslNeo/Neo mice.
(A) Schematic overview of system xc function, shuttling cystine, glutamate and [18F]FSPG (red) across the cell membrane. Reduced cystine, cysteine, and glutamate are precursors for glutathione biosynthesis. (B) Representative PET/CT images of [18F]FSPG distribution (%ID/g) in the coronal and axial plane of 2 week old WT littermates and AslNeo/Neo mice. P=pancreas, B=bladder, K=kidney. (C) Quantified [18F]FSPG retention in the liver 60 min post-injection. (D) Western blot of liver xCT expression of WT and AslNeo/Neo mice. (E) Quantified [18F]FSPG retention in the skin of WT and AslNeo/Neo mice 60 min post-injection. (F) H&E stain from skin of AslNeo/Neo and WT mice showing architectural differences highlighting the skin abnormality observed in ASL deficiency. Scale bar is 100 μm. (C, E) Unpaired 2-tailed Student’s t test; **p<0.01. Graphs show mean ±SD.
Figure 3
Figure 3. Single intravenous administration of hASL mRNA corrects ureagenesis up to 7 days in adult AslNeo/Neo mice
(A) Schematic illustration of experimental plan. Three-week old AslNeo/Neo mice received a single intravenous (IV) injection of either hASL or Luc mRNA at 1mg/kg body weight and were sacrificed at 2h, 24h, 72h, or 7 days. (B) Average ammonia concentrations from plasma and average (C) argininosuccinic acid (D) citrulline concentrations from dried blood spots at 2, 24, 72 hours, or 7 days. (E) Urine orotic acid concentrations normalised to creatinine at 24 hours. (F) ASL liver western blot at 24 hours, 72 hours, and 7 days. (G) Quantification of ASL immunoblot normalised to GAPDH (H) Representative images of liver ASL immunostaining at 24 hours post-mRNA administration and (I) Quantification. Scale bar= 100μM. (J) Liver ASL activity at 2, 24, 72 hours, and 7 days. Values normalised against WT control. (B, D, G, J) Two-way ANOVA with Šídák’s post-hoc test per timepoint. Grey dotted line represents mean WT values. (C) Two-way ANOVA with Šídák’s post-hoc test per timepoint post log transformation, (E) One-way ANOVA post Tukey’s post-hoc test comparison post log-transformation (I) One-way ANOVA post Tukey’s post-hoc test comparison, ns=not significant, *p<0.05, **p<0.01, ***p<0.005, ****p<0.0001. Graphs show mean ±SD.
Figure 4
Figure 4. hASL mRNA therapy from birth normalises the phenotype of AslNeo/Neo mice.
(A) Schematic illustration of experiment. AslNeo/Neo mice were given weekly intravenous (IV) dose of 1mg/kg of either hASL or Luc mRNA from birth up to 7 weeks, except for week 1 where the mice were administered intraperitoneally with dose of 2 mg/kg. Harvest was performed 48 hours after the last injection. (B) Kaplan-Meier survival curve of hASL, and Luc mRNA-treated AslNeo/Neo mice. (C) Average growth curve of WT, hASL, and Luc mRNA-treated AslNeo/Neo mice. (D) Representative images of wild-type (blue asterisk), hASL (red asterisk), and Luc mRNA-treated (black asterisk) AslNeo/Neo mice at harvest. Scale bar=2cm. (E) Average plasma ammonia, (F) argininosuccinic acid (G), and citrulline concentrations from dried blood spots, (H) urinary orotic acid, and (I) C13 ureagenesis from WT, hASL, and Luc mRNA-treated AslNeo/Neo mice. (J) ASL western blot of WT, hASL, and Luc mRNA-treated AslNeo/Neo mice and (K) quantification. (L) Representative images of ASL immunostaining in livers of WT, hASL, and Luc mRNA-treated AslNeo/Neo mice (scale bar=100μM) and (M) quantification. (N) Liver ASL activity from WT, hASL, and Luc mRNA-treated AslNeo/Neo mice livers. (B) Log-rank (Mantel-Cox). (C) Simple linear regression analysis comparing average slopes per group. (E, G-I, K, M, N) One-way ANOVA with Tukey’s post-hoc test analysis, (F) One-way ANOVA post Tukey’s post-hoc test comparison on log-transformed values, ns=not significant, *p<0.05, **p<0.01, ***p<0.005, ****p<0.0001. Graphs show mean ±SD.
Figure 5
Figure 5. hASL mRNA therapy partially rescues the adult phenotype in AslNeo/Neo mice.
(A) Schematic illustration of experimental plan. AslNeo/Neo mice were given weekly intravenous (IV) dose of 1mg/kg of either hASL or Luc mRNA from day 21 up to 9 weeks. (B) Kaplan-Meier survival curve of hASL and Luc mRNA-treated AslNeo/Neo mice. (C) Average growth curve of WT, hASL, and Luc mRNA-treated AslNeo/Neo mice. (D) Representative images of WT, hASL, and Luc mRNA-treated AslNeo/Neo mice at harvest. Scale bar=2cm. (E) Average plasma ammonia concentration, (F) argininosuccinic acid, (G) and citrulline concentrations from dried blood spots, (H) urinary orotic acid, and (I) C13 ureagenesis from WT, hASL, and Luc mRNA-treated AslNeo/Neo mice. (J) ASL western blot of WT, hASL, and Luc mRNA- treated AslNeo/Neo mice and (K) quantification. (L) Liver ASL activity from WT, hASL, and Luc mRNA-treated AslNeo/Neo mice livers. (B) Log-rank (Mantel-Cox), p=0.0025. (C) Simple linear regression analysis comparing average slopes per group. (F-I, K, L) One-way ANOVA with Tukey’s post-hoc test analysis. (E) One-way ANOVA with Tukey’s post-hoc test analysis on log-transformed values ns=not significant, *p<0.05, **p<0.01, ****p<0.0001. Graphs show mean ±SD.
Figure 6
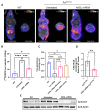
Figure 6. hASL mRNA therapy corrects the dysfunction of glutathione metabolism in AslNeo/Neo mice.
(A) [18F]FSPG distribution (%ID/g) in representative coronal and axial plane PET/CT images of WT, untreated AslNeo/Neo, and hASL mRNA-treated AslNeo/Neo mice. K= Kidney, P= Pancreas. (B) [18F]FSPG quantification of the liver in WT, untreated AslNeo/Neo, and hASL mRNA-treated AslNeo/Neo mice 60 min post-injection. (C) Western blot of xCT expression in untreated AslNeo/Neo liver and liver of hASL mRNA-treated AslNeo/Neo mice. (D) Total glutathione concentrations from liver in WT, Luc mRNA-treated AslNeo/Neo mice, and hASL mRNA-treated AslNeo/Neo mice from neonatal or adulthood. (E) Liver total homocysteine concentrations expressed as ratio relative to WT (shown as dotted line) from untreated versus hASL mRNA-treated AslNeo/Neo adult mice. Graph shows mean ±SD. (B, D) One-way ANOVA with Tukey’s post-hoc test; (E): Unpaired 2-tailed Student’s t test; ns=not significant, **p<0.01, ***p<0.001, ****p<0.0001.
Figure 7
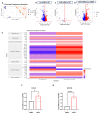
Figure 7. hASL mRNA therapy corrects metabolic dysfunction and liver pathophysiology in AslNeo/Neo mice.
(A) Principal component analysis plots comparing treatment applied (untreated WT, hASL mRNA, or Luc mRNA) and mouse genotype (WT or AslNeo/Neo) with percentage of variance associated with each axis. (B) Volcano plots showing differential gene expression (DEG) analysis of Luc mRNA vs WT, (C) hASL mRNA vs WT, and (D) hASL mRNA vs Luc mRNA. Scatter plots show log-transformed adjusted p-values (<0.05) on the y-axis against log2 fold change (>0.10) values on the x-axis. Blue and red dots represent genes that were significantly (FDR-corrected p-value of <0.05) downregulated and upregulated, respectively, between groups. Grey dots represent genes that were not significantly altered. (E) Pathway analysis highlighting genes of interest significantly altered in DEG analysis organised with their associated pathways when comparing Luc mRNA vs WT and hASL mRNA vs Luc mRNA groups. mRNA expression of (F) GCLC and (G) GCLM with NO donor SNAP at 200μM versus control DMSO in Huh7 cells. (F, G): Unpaired 2-tailed Student’s t test; ns=not significant, ***p<0.001, ****p<0.0001; average values from 3 independent experiments. Each dot represents one experiment.

References

    1. Summar ML, Koelker S, Freedenberg D, Le Mons C, Haberle J, Lee HS, Kirmse B. The incidence of urea cycle disorders. Mol Genet Metab. 2013;110:179–180. - PMC - PubMed
    1. Baruteau J, Diez-Fernandez C, Lerner S, Ranucci G, Gissen P, Dionisi-Vici C, Nagamani S, Erez A, Häberle J. Argininosuccinic aciduria: Recent pathophysiological insights and therapeutic prospects. J Inherit Metab Dis. 2019;42:1147–1161. - PubMed
    1. Erez A. Argininosuccinic aciduria: from a monogenic to a complex disorder. Genet Med. 2013;15:251–257. - PubMed
    1. Erez A, Nagamani SC, Shchelochkov OA, Premkumar MH, Campeau PM, Chen Y, Garg HK, Li L, Mian A, Bertin TK, Black JO, et al. Requirement of argininosuccinate lyase for systemic nitric oxide production. Nat Med. 2011;17:1619–1626. - PMC - PubMed
    1. Nagamani SC, Campeau PM, Shchelochkov OA, Premkumar MH, Guse K, Brunetti-Pierri N, Chen Y, Sun Q, Tang Y, Palmer D, Reddy AK, et al. Nitric-oxide supplementation for treatment of long-term complications in argininosuccinic aciduria. Am J Hum Genet. 2012;90:836–846. - PMC - PubMed

Publication types