. 2024 Feb:69:103025.
doi: 10.1016/j.redox.2024.103025. Epub 2024 Jan 5.

Increased cellular protein modification by methylglyoxal activates endoplasmic reticulum-based sensors of the unfolded protein response

Affiliations

Increased cellular protein modification by methylglyoxal activates endoplasmic reticulum-based sensors of the unfolded protein response

Mingzhan Xue et al. Redox Biol. 2024 Feb.

Abstract

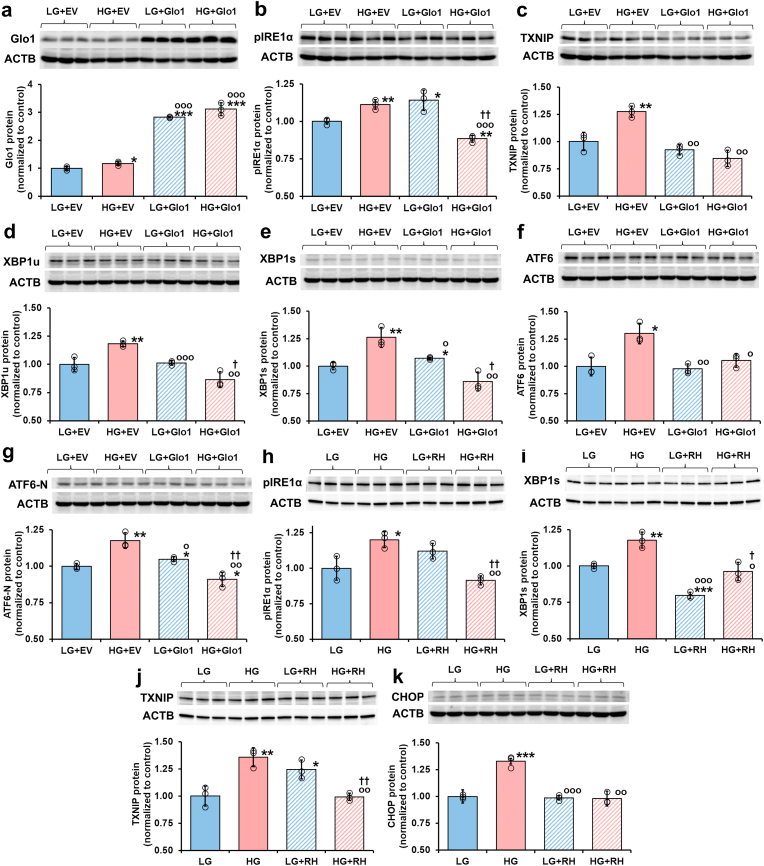
The unfolded protein response (UPR) detects increased misfolded proteins and activates protein refolding, protein degradation and inflammatory responses. UPR sensors in the endoplasmic reticulum, IRE1α and PERK, bind and are activated by proteins with unexpected surface hydrophobicity, whereas sensor ATF6 is activated by proteolytic cleavage when released from complexation with protein disulfide isomerases (PDIs). Metabolic dysfunction leading to the formation of misfolded proteins with surface hydrophobicity and disruption of ATF6-PDI complexes leading to activation of UPR sensors remains unclear. The cellular concentration of reactive dicarbonyl metabolite, methylglyoxal (MG), is increased in impaired metabolic health, producing increased MG-modified cellular proteins. Herein we assessed the effect of high glucose concentration and related increased cellular MG on activation status of IRE1α, PERK and ATF6. Human aortal endothelial cells and HMEC-1 microvascular endothelial cells were incubated in low and high glucose concentration to model blood glucose control, with increase or decrease of MG by silencing or increasing expression of glyoxalase 1 (Glo1), which metabolizes MG. Increased MG induced by high glucose concentration activated IRE1α, PERK and ATF6 and related downstream signalling leading to increased chaperone, apoptotic and inflammatory gene expression. Correction of increased MG by increasing Glo1 expression prevented UPR activation. MG modification of proteins produces surface hydrophobicity through arginine-derived hydroimidazolone MG-H1 formation, with related protein unfolding and preferentially targets PDIs and chaperone pathways for modification. It thereby poses a major challenge to proteostasis and activates UPR sensors. Pharmacological decrease of MG with Glo1 inducer, trans-resveratrol and hesperetin in combination, offers a novel treatment strategy to counter UPR-related cell dysfunction, particularly in hyperglycemia associated with diabetes.

Keywords: ER stress; Glycation; Glycemic disease; Hyperglycemia; Methylglyoxal; Unfolded protein response.


Conflict of interest statement

Declaration of competing interest Mingzhan Xue, Naila Rabbani and Paul J Thornalley are co-inventors in the patent of Glo1 inducer, tRES + HESP. Commercial rights to the patent are owned by Glocentrica Ltd (UK). Naila Rabbani and Paul J Thornalley are founding co-directors of Glocentrica Ltd (UK).

Figures

Fig. 1
Fig. 1
Protein glycation by methylglyoxal and metabolism of methylglyoxal by the glyoxalase pathway. a Protein glycation by methylglyoxal (MG) – formation of hydroimidazolone, Nδ-(5-hydro-5-methyl-4-imidazolon-2-yl)-ornithine (MG-H1). b Metabolism of methylglyoxal by the glyoxalase system.
Fig. 2
Fig. 2
Effect of dicarbonyl stress and high glucose concentration on activation of the IRE1α sensor pathway of the UPR in human aortal endothelial cells in vitro. Effect of Glo1 silencing – Western blotting: a Glo1, b pIRE1α, c total IRE1α, d pIRE1α/total IRE1α ratio (ratio of bands in b and c), e XBP1s, f XBP1u, g XBP1s/XBP1u ratio (ratio of bands in e and f), and h TXNIP. Key: LG + NT, low glucose concentration (4.1 mM) + non-target siRNA; LG + Glo1KD, low glucose concentration + Glo1 siRNA (knockdown); HG + NT, high glucose concentration (20 mM) + non-target siRNA; and HG + Glo1KD, high glucose concentration + Glo1 siRNA. i and j Effect of IRE1α inhibitor, 4μ8C, on XBP1 mRNA splicing and expression of TXNIP, respectively. Effect of miR-17 agonism and inhibition on expression of TXNIP: k TXNIP mRNA with and without miR-17 mimic (miR17m); and l, TXNIP mRNA with and without miR-17 inhibitor (miR17In). Key: LG, low glucose concentration (4.1 mM); LG+4μ8C/miR17m/miR17In, low glucose concentration + 4μ8C, miR-17 mimic or miR-17 inhibitor; HG, high glucose concentration; HG+4μ8C/miR17m/miR17In, high glucose concentration + 4μ8C, miR-17 mimic or miR-17 inhibitor. Data are mean ± SD (n = 3). Significance: *, ** and ***, p < 0.05, p < 0.01 and p < 0.001 with respect to LG or LG + NT control; o, oo and ooo, p < 0.05, p < 0.01 and p < 0.001 with respect to LG + Glo1KD, 4μ8C, miR-17 m or miR-17In; and †, †† and †††, p < 0.05, p < 0.01 and p < 0.001 with respect to HG or HG + NT control (Student's t-test). ANOVA: p < 0.001 except for c (P < 0.05) and f (P < 0.01). Incubations were for 72 h. Key to bar shading: solid pastel blue and red bars, low and high glucose concentration controls, respectively; pastel blue and red bars hatched bars, low and high glucose concentration with further additions, respectively; and grey bars in i, XBP1s mRNA. Abbreviation: ACTB, β-actin housekeeping protein. (For interpretation of the references to colour in this figure legend, the reader is referred to the Web version of this article.)
Fig. 3
Fig. 3
Effect of dicarbonyl stress and high glucose concentration on activation of the PERK and ATF6 sensor pathways of the UPR in human aortal endothelial cells in vitro. Effect of Glo1 silencing – Western blotting: a pPERK, b tPERK, c pPERK/tPERK ratio (ratio of bands in a and b), d pEIF2α, e tEIF2α, f pEIF2α/tEIF2α ratio (ratio of bands in d and e), g CHOP, h ATF6-N, and i ATF6. Key: LG + NT, low glucose concentration (4.1 mM) + non-target siRNA; LG + Glo1KD, Low glucose concentration + Glo1 siRNA (knockdown); HG + NT, high glucose concentration (20 mm) + non-target siRNA; and HG + Glo1KD, high glucose concentration + Glo1 siRNA. Significance: *, ** and ***, p < 0.05, p < 0.01 and p < 0.001 with respect to LG + NT control; o, oo and ooo, p < 0.05, p < 0.01 and p < 0.001 with respect to LG + siRNA; and †, †† and †††, p < 0.05, p < 0.01 and p < 0.001 with respect to HG + NT control (Student's t-test). ANOVA: p < 0.001 except for a and f (p < 0.01) and c (p < 0.05). Key to bar shading: solid pastel blue and red bars, low and high glucose concentration controls, respectively; and pastel blue and red bars hatched bars, low and high glucose concentration with further additions, respectively. Abbreviation: ACTB, β-actin housekeeping protein. (For interpretation of the references to colour in this figure legend, the reader is referred to the Web version of this article.)
Fig. 4
Fig. 4
Effect of glyoxalase 1 overexpression and induction by Glo1 inducer, trans-resveratrol and hesperetin, on activation of IRE1α and signalling in human endothelial cells in vitro. a - g Effect of overexpression of Glo1 on activation of the UPR. Western blotting: a Glo1, b pIRE1α, c TXNIP, d XBP1u, e XBP1s, f ATF6 and g ATF6-N. hk Effect of Glo1 inducer, tRES + HESP, on activation of the UPR. Western blotting: h pIRE1α, i XBP1s, j TXNIP, and k CHOP protein. Key: LG, low glucose concentration; LG + EV, low glucose concentration + empty vector; LG + Glo1, low glucose concentration + Glo1 overexpression vector; LG + RH, low glucose concentration +5 μM tRES + HESP; HG, high glucose concentration; HG + EV, high glucose concentration + empty vector; HG + Glo1, high glucose concentration + Glo1 overexpression vector; and HG + RH, high glucose concentration +5 μM tRES + HESP. Data are mean ± SD (n = 3). Significance: *, ** and ***, p < 0.05, p < 0.01 and p < 0.001 with respect to LG + EV or LG control; o, oo and ooo, p < 0.05, p < 0.01 and p < 0.001 with respect to HG + EV or HG control; and †, ††, and †††, p < 0.05, p < 0.01 and p < 0.001 with respect to HG or HG + EV control; and o and oo, p < 0.05 and p < 0.01 with respect to LG + Glo1 or LG + RH control; (Student's t-test). ANOVA: P < 0.001 except h, p < 0.01. Incubations were for 72 h. Key to bar shading: solid pastel blue and red bars, low and high glucose concentration controls, respectively, with or without empty vector transfection; and pastel blue and red bars hatched bars, low and high glucose concentration, respectively, with further additions (Glo1 overexpression vector or 5 μM tRES + HESP), respectively. Abbreviation: ACTB, β-actin housekeeping protein. (For interpretation of the references to colour in this figure legend, the reader is referred to the Web version of this article.)
Fig. 5
Fig. 5
Increased TXNIP and inflammatory signaling in high glucose concentration-induced ER stress in human aortal endothelial cells in vitro. Effect of XBP1 knockdown: a XBP1 mRNA, b MCP-1 mRNA, c IL-8 mRNA, and d TXNIP mRNA. Key: LG + NT, low glucose concentration + non-target siRNA; LG + XBP1KD, low glucose concentration + XBP1 siRNA; HG + NT, high glucose concentration + non-target siRNA; and HG + XBP1KD, high glucose concentration + XBP1 siRNA. Effect of miR-17 activity on inflammatory signalling: e Effect of miR-17 mimic on TXNIP mRNA; and f miR-17 inhibitor on TXNIP mRNA. Comparison of UPR-linked gene expression induced by high glucose concentration and treatment with Tunicamycin: g TXNIP mRNA, h GRP79 mRNA, and i CHOP mRNA at 24 h and 72 h, as indicated. Key: LG, low glucose concentration control; LG + NT, low glucose concentration + non-target siRNA control; LG + XBP1KD, low glucose concentration + XBP1 siRNA (knockdown); LG + miR17 m or miR17In, low glucose concentration + miR-17 mimic or inhibitor; HG, high glucose concentration; HG + NT, high glucose concentration + non-target siRNA; HG + XBP1KD, high glucose concentration + XBP1 siRNA (knockdown); and HG + miR17 m or miR17In, high glucose concentration + miR-17 mimic or inhibitor. Data are mean ± SD (n = 3). Significance: *, ** and ***, p < 0.05, p < 0.01 and p < 0.001 with respect to LG or LG + NT control; o, oo and ooo, p < 0.05, p < 0.01 and p < 0.001 with respect to LG + XBP1KD, LG + miR17 m or LG + miR17In; and †† and †††, p < 0.01 and p < 0.001 with respect to HG or HG + NT control (Student's t-test). ANOVA: all P < 0.001. Incubations were for 72 h. Key to bar shading: solid pastel blue and red bars, low and high glucose concentration controls; pastel blue and red bars hatched bars, low and high glucose concentration with further additions, respectively; and grey bar, + Tunicamycin. (For interpretation of the references to colour in this figure legend, the reader is referred to the Web version of this article.)
Fig. 6
Fig. 6
Pathways of the UPR – indicating interactions with methylglyoxal and methylglyoxal-modified proteins. Blue arrows are processes of UPR sensor activation and deactivation; yellow arrows are UPR signalling; and red arrows are PDI modification by MG. Abbreviations: ATF3, ATF4, ATF5 and ATF6, activating transcription factor-3, -4, -5 and -6; BH3, proteins with 3 domains homologous to BCL-2; CHOP, C/EBP homologous protein; Dr5, death receptor-5; eIF2α, eukaryotic translation initiation factor-2α; ER, endoplasmic reticulum; ERAD, endoplasmic reticulum-associated protein degradation; Gadd34, growth arrest and DNA damage-inducible protein; GRP78, 78 kDa glucose-regulated protein; ICAM-1, intercellular adhesion molecule-1; IL-1β, −6, −8 and −18; interleukin-1β, −6, −8 and −18; IRE1α, inositol requiring enzyme-1α; MCP-1, monocyte chemoattractant-1; MG, methylglyoxal; MG-H1, methylglyoxal-derived hydroimidazolone; miR-17, microRNA-17; NLRP3, nucleotide-binding domain, leucine-rich–containing family, pyrin domain–containing-3; P, protein phosphorylation; PDI, protein disulfide isomerase; PERK, double-stranded RNA-dependent kinase-like ER kinase; RIDD, regulated IRE1α-dependent decay; S1P/S2P, site-1 protease/site-2 protease; TNFα, tumor necrosis factor-α; TXNIP, thioredoxin interacting protein; VCAM-1, vascular cell adhesion molecule-1; XBP1, X-box binding protein 1 (subscripts u and s indicate unprocessed mRNA and spliced mRNA expression products, respectively). (For interpretation of the references to colour in this figure legend, the reader is referred to the Web version of this article.)

Similar articles

Cited by

References

    1. Walter P., Ron D. The unfolded protein response: from stress pathway to homeostatic regulation. Science. 2011;334:1081–1086. doi: 10.1126/science.1209038. - DOI - PubMed
    1. Ozcan U., Cao Q., Yilmaz E., Lee A.H., Iwakoshi N.N., Ozdelen E., Tuncman G., Görgün C., Glimcher L.H., Hotamisligil G.S. Endoplasmic reticulum stress links obesity, insulin action, and type 2 diabetes. Science. 2004;306:457–461. doi: 10.1126/science.1103160. - DOI - PubMed
    1. Fatima S., Ambreen S., Mathew A., Elwakiel A., Gupta A., Singh K., Krishnan S., Rana R., Khawaja H., Gupta D., Manoharan J., Besler C., Laufs U., Kohli S., Isermann B., Shahzad K. ER-Stress and senescence coordinately promote endothelial barrier dysfunction in diabetes-induced atherosclerosis. Nutrients. 2022;14:2786. doi: 10.3390/nu14142786. - DOI - PMC - PubMed
    1. Quagliaro L., Piconi L., Assaloni R., Da Ros R., Maier A., Zuodar G., Ceriello A. Intermittent high glucose enhances ICAM-1, VCAM-1 and E-selectin expression in human umbilical vein endothelial cells in culture: the distinct role of protein kinase C and mitochondrial superoxide production. Atherosclerosis. 2005;183:259–267. doi: 10.1016/j.atherosclerosis.2005.03.015. - DOI - PubMed
    1. Xue M., Qian Q., Adaikalakoteswari A., Rabbani N., Babaei-Jadidi R., Thornalley P.J. Activation of NF-E2-Related factor-2 reverses biochemical dysfunction of endothelial cells induced by hyperglycemia linked to vascular disease. Diabetes. 2008;57:2809–2817. 0.2337/db06-1003. Epub 2008 Jul 15. - PMC - PubMed

MeSH terms