

Cord blood lipid correlation network profiles are associated with subsequent attention-deficit/hyperactivity disorder and autism spectrum disorder symptoms at 2 years: a prospective birth cohort study
- PMID: 38199043
- PMCID: PMC10825361
- DOI: 10.1016/j.ebiom.2023.104949
Cord blood lipid correlation network profiles are associated with subsequent attention-deficit/hyperactivity disorder and autism spectrum disorder symptoms at 2 years: a prospective birth cohort study
Abstract
Background: Attention-deficit/hyperactivity disorder (ADHD) and autism spectrum disorder (ASD) are neurodevelopmental conditions with early life origins. Alterations in blood lipids have been linked to ADHD and ASD; however, prospective early life data are limited. This study examined (i) associations between the cord blood lipidome and ADHD/ASD symptoms at 2 years of age, (ii) associations between prenatal and perinatal predictors of ADHD/ASD symptoms and cord blood lipidome, and (iii) mediation by the cord blood lipidome.
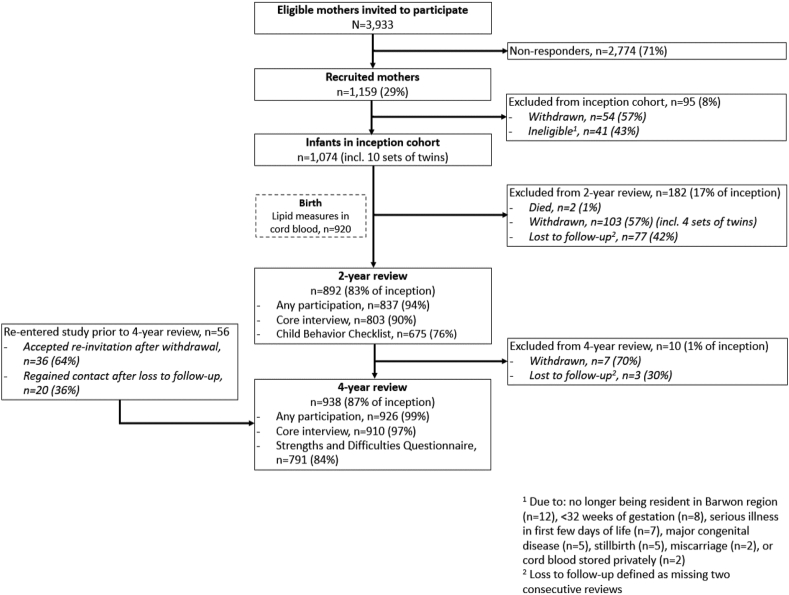
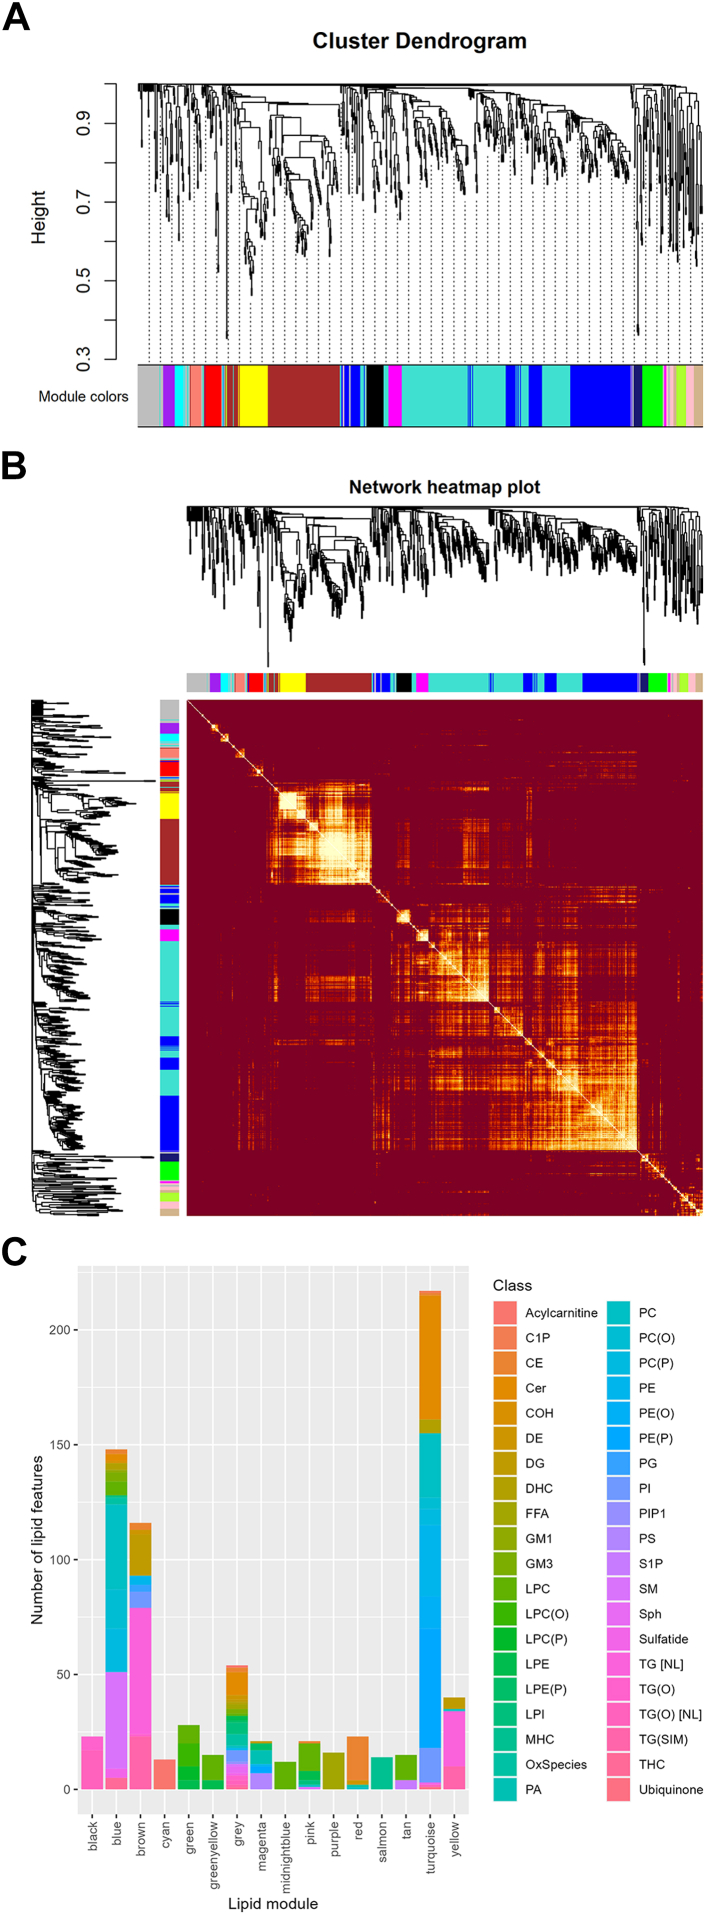
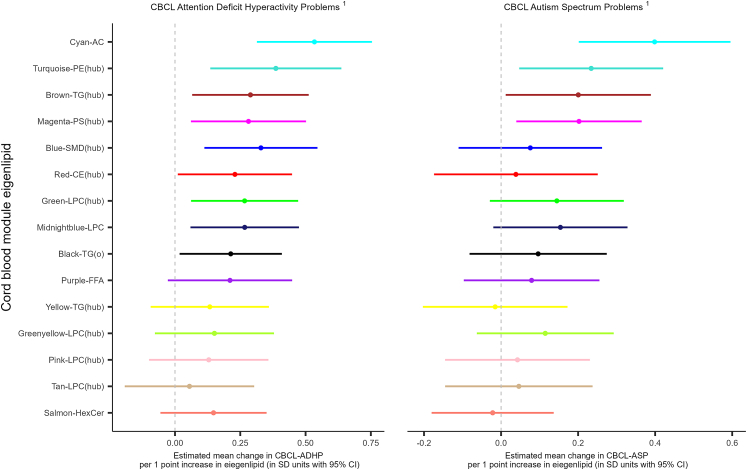
Methods: From the Barwon Infant Study cohort (1074 mother-child pairs, 52.3% male children), child circulating lipid levels at birth were analysed using ultra-high-performance liquid chromatography-tandem mass spectrometry. These were clustered into lipid network modules via Weighted Gene Correlation Network Analysis. Associations between lipid modules and ADHD/ASD symptoms at 2 years, assessed with the Child Behavior Checklist, were explored via linear regression analyses. Mediation analysis identified indirect effects of prenatal and perinatal risk factors on ADHD/ASD symptoms through lipid modules.
Findings: The acylcarnitine lipid module is associated with both ADHD and ASD symptoms at 2 years of age. Risk factors of these outcomes such as low income, Apgar score, and maternal inflammation were partly mediated by higher birth acylcarnitine levels. Other cord blood lipid profiles were also associated with ADHD and ASD symptoms.
Interpretation: This study highlights that elevated cord blood birth acylcarnitine levels, either directly or as a possible marker of disrupted cell energy metabolism, are on the causal pathway of prenatal and perinatal risk factors for ADHD and ASD symptoms in early life.
Funding: The foundational work and infrastructure for the BIS was sponsored by the Murdoch Children's Research Institute, Deakin University, and Barwon Health. Subsequent funding was secured from the Minderoo Foundation, the European Union's Horizon 2020 research and innovation programme (ENDpoiNTs: No 825759), National Health and Medical Research Council of Australia (NHMRC) and Agency for Science, Technology and Research Singapore [APP1149047], The William and Vera Ellen Houston Memorial Trust Fund (via HOMER Hack), The Shepherd Foundation, The Jack Brockhoff Foundation, the Scobie & Claire McKinnon Trust, the Shane O'Brien Memorial Asthma Foundation, the Our Women Our Children's Fund Raising Committee Barwon Health, the Rotary Club of Geelong, the Ilhan Food Allergy Foundation, Geelong Medical and Hospital Benefits Association, Vanguard Investments Australia Ltd, the Percy Baxter Charitable Trust, and Perpetual Trustees.
Keywords: Acylcarnitine; Attention-deficit/hyperactivity disorder symptoms; Autism spectrum disorder symptoms; Cord blood; Fatty acids; Lipidomics.
Copyright © 2024 The Authors. Published by Elsevier B.V. All rights reserved.
Conflict of interest statement
Declaration of interests The authors declare that they have no known competing financial interests or personal relationships that could have appeared to influence the work reported in this paper.
Figures

References
-
- American Psychiatric Association . Diagnostic and statistical manual of mental disorders. 5th ed. American Psychiatric Association; Washington, DC: 2013.
-
- Atladottir H.O., Gyllenberg D., Langridge A., et al. The increasing prevalence of reported diagnoses of childhood psychiatric disorders: a descriptive multinational comparison. Eur Child Adolesc Psychiatry. 2015;24(2):173–183. - PubMed
MeSH terms
Substances
LinkOut - more resources
Full Text Sources
Medical
Miscellaneous
