. 2024 Feb:100:104961.
doi: 10.1016/j.ebiom.2023.104961. Epub 2024 Jan 9.

CRIP1 involves the pathogenesis of multiple myeloma via dual-regulation of proteasome and autophagy

Affiliations

CRIP1 involves the pathogenesis of multiple myeloma via dual-regulation of proteasome and autophagy

Peixia Tang et al. EBioMedicine. 2024 Feb.

Abstract

Background: Multiple myeloma (MM) is an incurable hematological malignancy of the plasma cells. The maintenance of protein homeostasis is critical for MM cell survival. Elevated levels of paraproteins in MM cells are cleared by proteasomes or lysosomes, which are independent but inter-connected with each other. Proteasome inhibitors (PIs) work as a backbone agent and successfully improved the outcome of patients; however, the increasing activity of autophagy suppresses the sensitivity to PIs treatment.

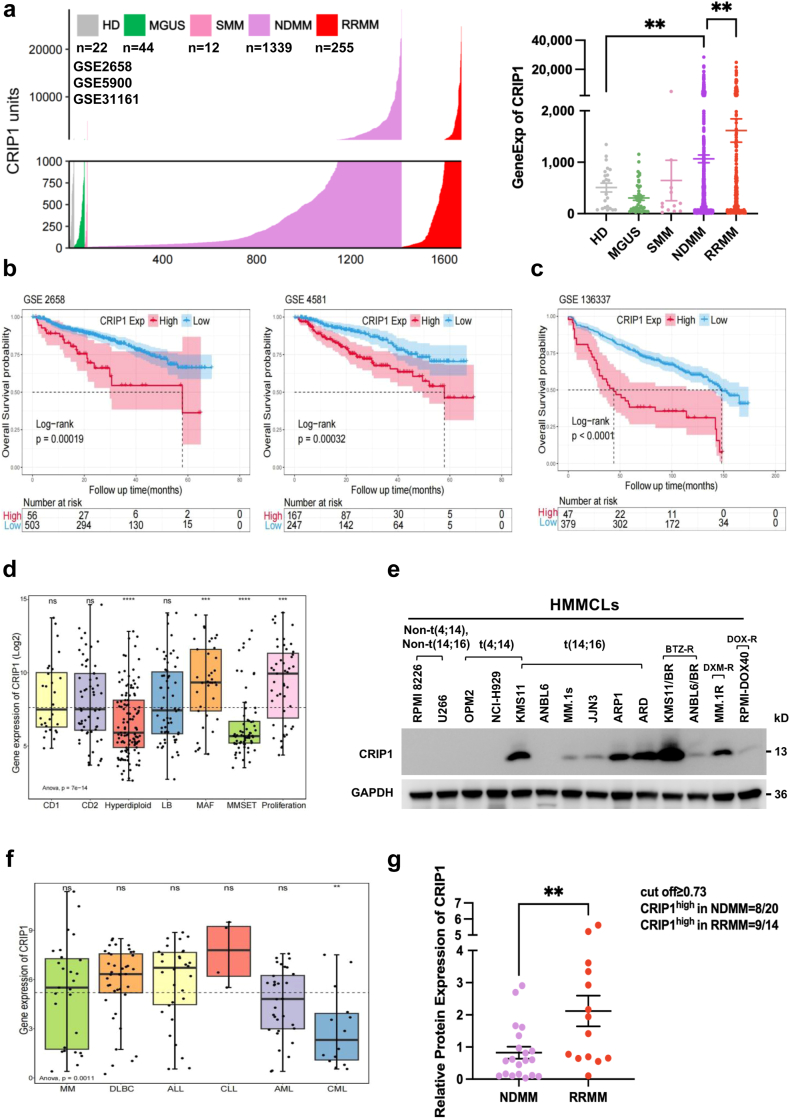
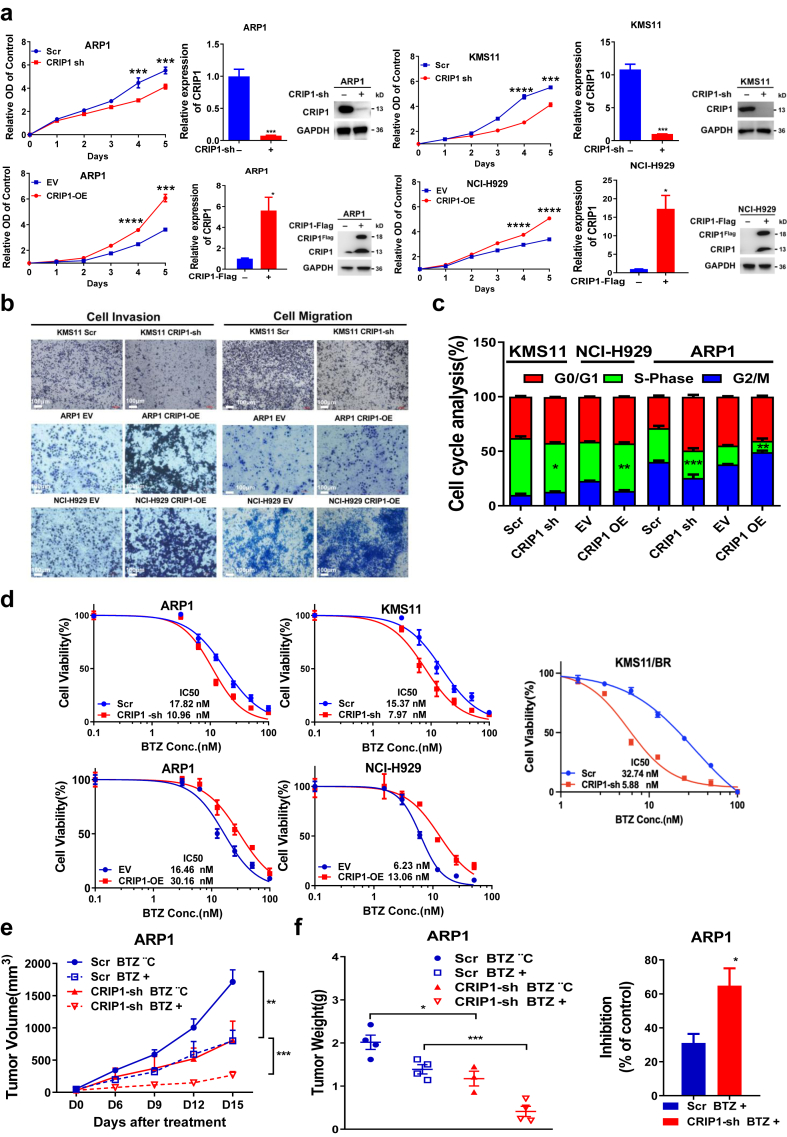
Methods: The transcription levels of CRIP1 were explored in plasma cells obtained from healthy donors, patients with newly diagnosed multiple myeloma (NDMM), and relapsed/refractory multiple myeloma (RRMM) using Gene expression omnibus datasets. Doxycycline-inducible CRIP1-shRNA and CRIP1 overexpressed MM cell lines were constructed to explore the role of CRIP1 in MM pathogenesis. Proliferation, invasion, migration, proteasome activity and autophagy were examined in MM cells with different CRIP1 levels. Co-immunoprecipitation (Co-IP) with Tandem affinity purification/Mass spectrum (TAP/MS) was performed to identify the binding proteins of CRIP1. The mouse xenograft model was used to determine the role of CRIP1 in the proliferation and drug-resistance of MM cells.

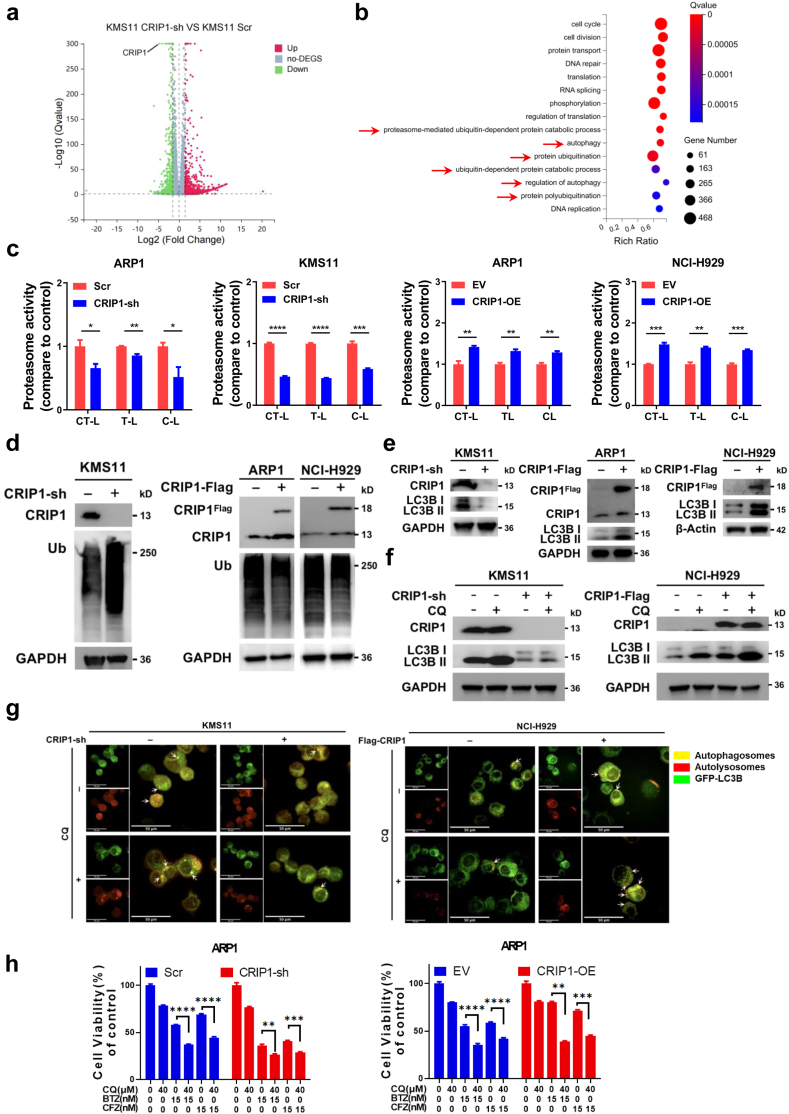
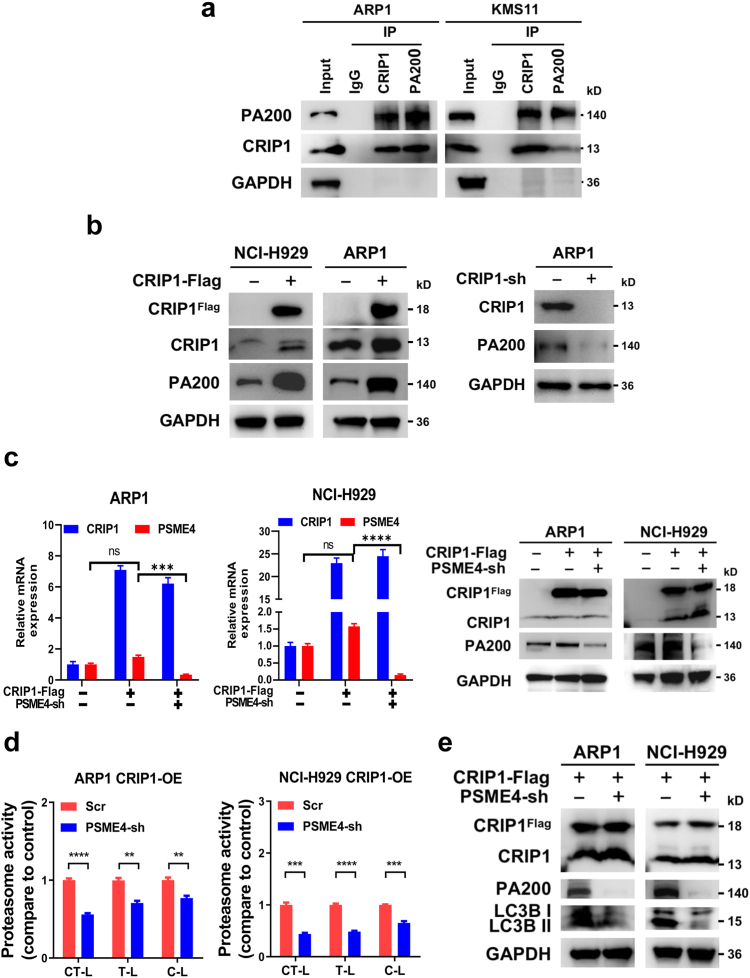
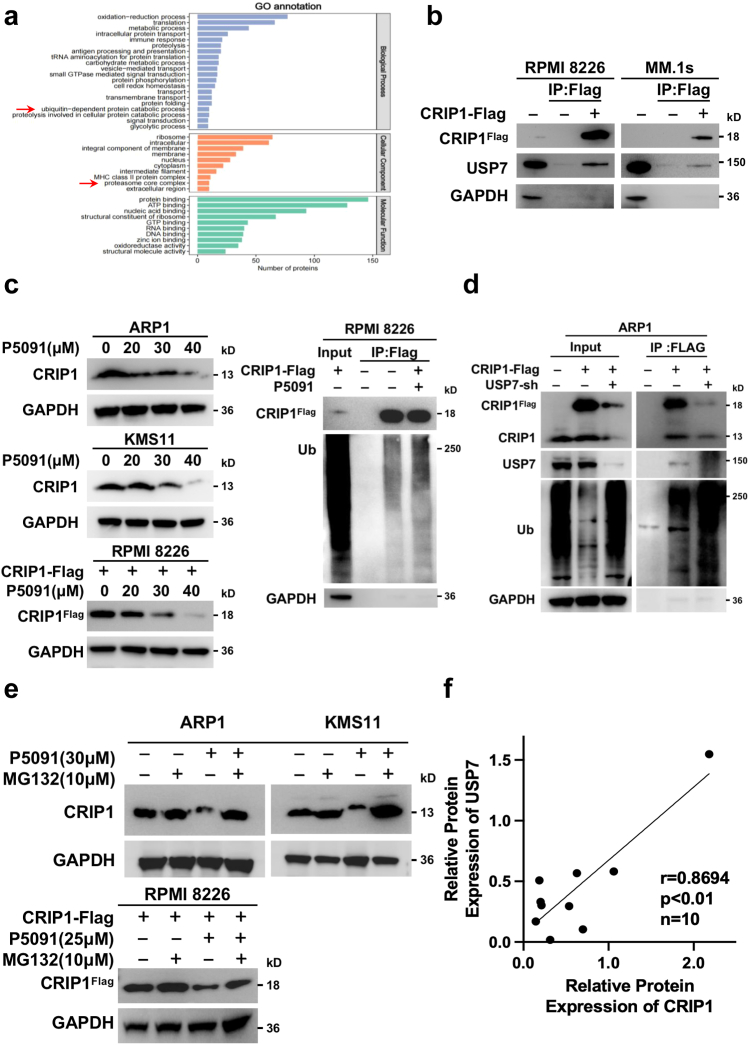
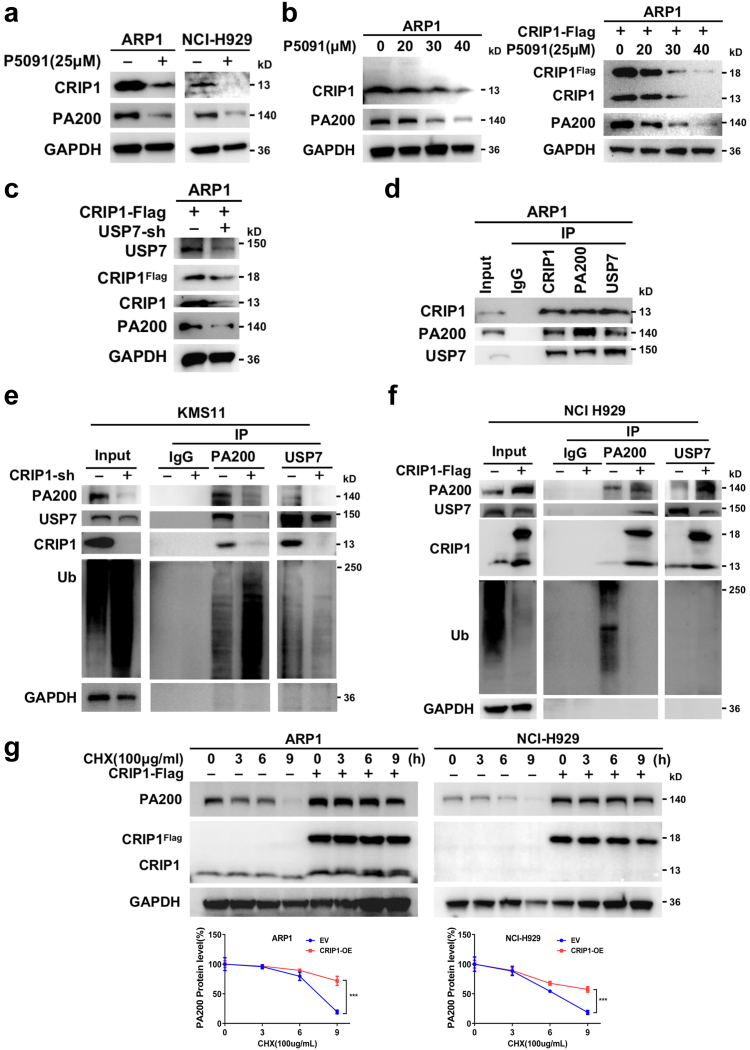
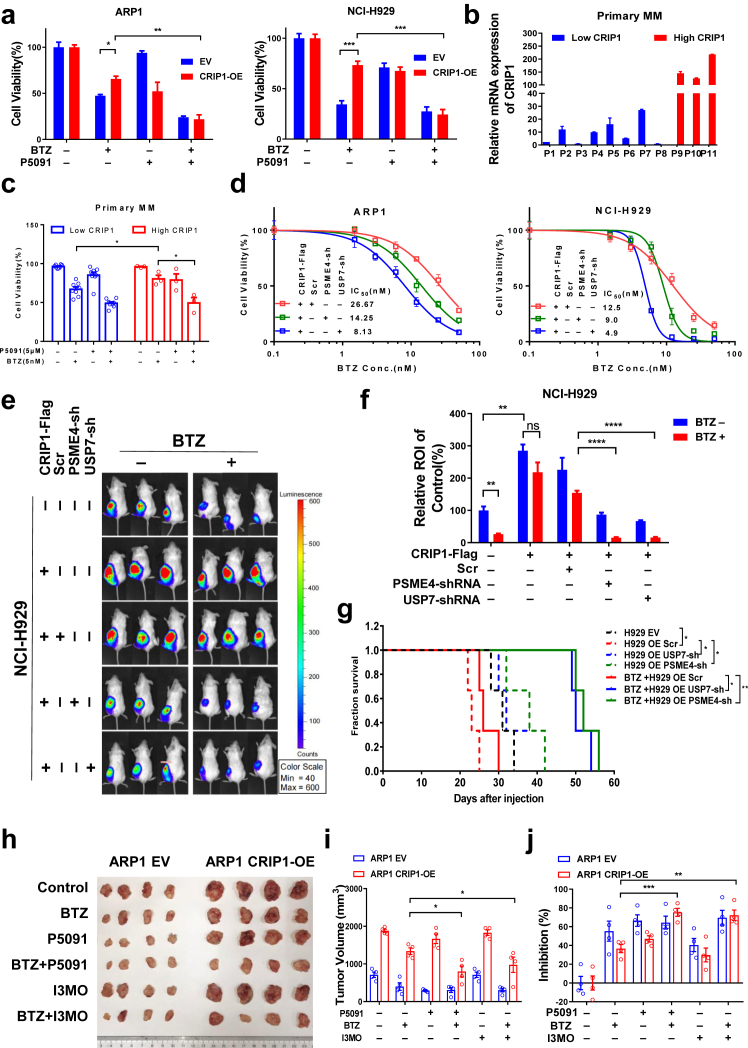
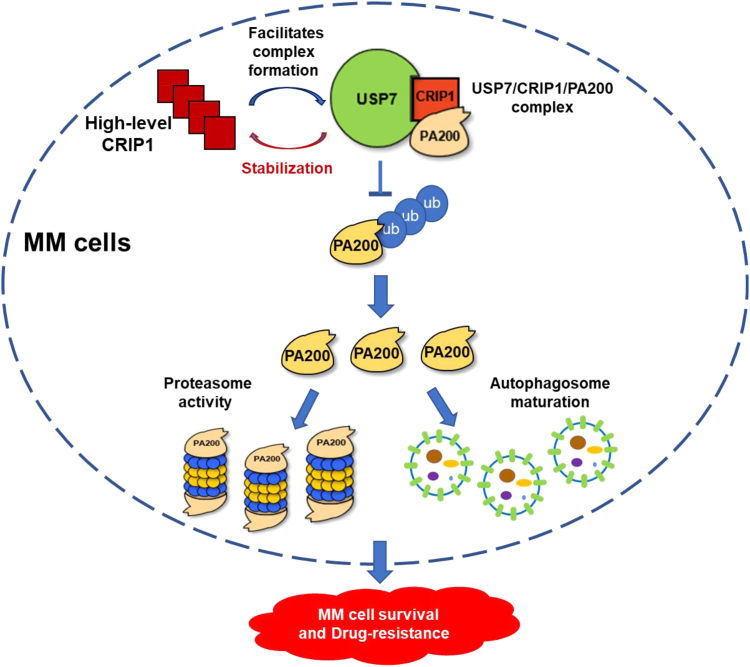
Findings: High CRIP1 expression was associated with unfavorable clinical outcomes in patients with MM and served as a biomarker for RRMM with shorter overall survival. In vitro and in vivo studies showed that CRIP1 plays a critical role in protein homeostasis via the dual regulation of the activities of proteasome and autophagy in MM cells. A combined analysis of RNA-seq, Co-IP and TAP/MS demonstrated that CRIP1 promotes proteasome inhibitors resistance in MM cells by simultaneously binding to de-ubiquitinase USP7 and proteasome coactivator PA200. CRIP1 promoted proteasome activity and autophagosome maturation by facilitating the dequbiquitination and stabilization of PA200.

Interpretation: Our findings clarified the pivotal roles of the CRIP1/USP7/PA200 complex in ubiquitin-dependent proteasome degradation and autophagy maturation involved in the pathogenesis of MM.

Funding: A full list of funding sources can be found in the acknowledgements section.

Keywords: Autophagy; CRIP1; Multiple myeloma; PIs resistance; Proteasome degradation.


Conflict of interest statement

Declaration of interests The authors have declared that no conflicts of interest exist.

Figures

Fig. 1
Fig. 1
High-level CRIP1 links poor prognosis in Patients with MM (a). The clinical significance of CRIP1 in the GEO Series of patients with MM was investigated. The expression of CRIP1 was compared in plasma cells from healthy donors (HD, n = 22), individuals with monoclonal gammopathy of undetermined significance (MGUS, n = 44), individuals with smouldering multiple myeloma (SMM, n = 12), patients with newly diagnosed MM (NDMM, n = 1339) and relapsed/refractory multiple myeloma (RRMM, n = 255) from the GEO Series (GSE2658, GSE31161 and GSE5900). (left figure, P < 0.05, Kruskal–Wallis test; right figure, P < 0.01, Kolmogorov–Smirnov test). (b). Kaplan–Meier analysis was performed in patients with MM with high or low CRIP1 expression enrolled in GSE2658 (P < 0.001, log-rank test) and GSE4581 (P < 0.001, log-rank test). (c). Kaplan–Meier analysis was performed in patients with MM with BTZ treatment enrolled in GSE136337 (P < 0.0001, log-rank test). (d). GSE2658 was applied to investigate the CRIP1 level of patients with MM in UAMS 7 subgroups reported by Zhan (P < 0.0001, ordinary one-way ANOVA). (e). The CRIP1 protein expression levels in HMMCLs were detected by Western blotting. (f). The gene expression levels of CRIP1 were analysed in various haematological malignancies in the CCLE database (P < 0.01, ordinary one-way ANOVA). (g). The expression of CRIP1 in bone marrow plasma cells of NDMM (n = 20) and RRMM (n = 14) was assessed via western blotting (refer to Supplementary Fig. S1) and represented as scatter plots (P < 0.01, unpaired t test). The statistical significance for the above data is indicated as follows: ∗ indicates P < 0.05; ∗∗ indicates P < 0.01; ∗∗∗ indicates P < 0.001.
Fig. 2
Fig. 2
CRIP1 promotes tumour cell growth and induces drug-resistance (a). The efficiencies of CRIP1 knockdown in the ARP1 and KMS11 cell lines and CRIP1 overexpression in the ARP1 and NCI-H929 cell lines were examined by using qPCR and Western blotting. The proliferation of cells was monitored daily with a CCK-8 assay for 5 days. (b). The effect of CRIP1 expression on the invasion and migration capabilities of myeloma cells was observed using a Transwell assay. Scale bar = 100 μm. (c). The cell cycle was analysed in MM cell lines by flow cytometry and presented as a bar chart with three replicates for each group. (d). The sensitivity of multiple myeloma cells with CRIP1 knockdown or overexpression to bortezomib treatment was assessed. (e). A total of 1 × 106 ARP1 cells with CRIP1 knockdown (CRIP1-shRNA) were injected into the right flank of 6- to 8-week-old NOD/SCID mice (n = 16, n = 4/group). These mice were subsequently treated with either PBS or bortezomib (0.5 mg/kg). Depletion of CRIP1 expression was induced using doxycycline (2 mg/mL). Tumour volumes were measured twice a week and are depicted in a line graph. Tumours were harvested before reaching a volume of 2000 mm3. (f). Tumour weight was measured, and the bortezomib inhibition rate on the tumours was calculated. The above data statistical analysis employed t-test, with the significance levels denoted as follows: ∗ for P < 0.05, ∗∗ for P < 0.01, and ∗∗∗ for P < 0.001.
Fig. 3
Fig. 3
CRIP1 dual-regulates proteasome activity and autophagy (a). RNA sequencing was performed in the KMS11 Scr and CRIP1-sh cell lines. The differentially expressed genes (DEGs) (|log (FC)| ≥ 1.5) between the two groups are shown with a volcano plot. (b).GO biological process analysis was performed in DEGs of KMS11 Scr and CRIP1-sh cells. (c).The chymotrypsin-like (CT-L), trypsin-like (T-L) and caspase-like (C-L) activities of the 20S proteasome were analysed in CRIP1 knockdown or overexpression MM cell lines. (d). Western blotting was employed to analyse the impact of CRIP1 knockdown and overexpression on the ubiquitination of myeloma cells. (e). Western blotting was utilized to examine the cellular autophagy levels associated with differential CRIP1 expression. (f). After treatment of MM cells with chloroquine (10 μM, 24 h), the accumulation of LC3B-II protein was analysed using western blotting. (g). The MM cells were treated with chloroquine (CQ) (10 μM 24 h) to inhibit lysosomal degradation. The expression of mCherry-EGFP-LC3B was visualized in CRIP1 knockdown or CRIP1-overexpressing MM cells using a spinning disk confocal microscope with 488-nm and 561-nm lasers. Scale bar = 50 μm. The confocal puncta of LC3B level in each group were also quantified (shown in Supplementary Fig. S3b). (h). Cell viability was determined by the CCK-8 assay following single or combined treatments with CQ (40 μM) and BTZ/CFZ (15 nM) for 24 h in ARP1 CRIP1 overexpression/knockdown cells. The above data statistical analysis employed t-test, with the significance levels denoted as follows: ∗ for P < 0.05, ∗∗ for P < 0.01, ∗∗∗ for P < 0.001, and ∗∗∗∗ for P < 0.0001.
Fig. 4
Fig. 4
CRIP1 stabilizes PA200 (a). Nondenatured lysis of ARP1 and KMS11 cells was performed, followed by immunoprecipitation using IgG, CRIP1 and PA200 antibodies. Western blotting was carried out with PA200 and CRIP1 antibodies. (b).The protein levels of CRIP1 and PA200 were analysed in NCI–H929 CRIP1 OE and ARP1 CRIP1 sh cells through Western blotting. (c).PSME4-shRNA was transfected into ARP1 CRIP1-OE and NCI–H929 CRIP1-OE cells, and the expression levels of CRIP1 and PA200 were analysed via RQ-PCR and Western blotting. (d).Proteasome activities were assessed in CRIP1-overexpressing cells upon knockdown of PSME4, with the experiment repeated three times. (e).Western blotting was carried out to analyse the impact of PSME4 knockdown on cellular autophagy in ARP1 and NCI–H929 CRIP1-overexpressing cell lines. The above data statistical analysis employed t-test, with the significance levels denoted as follows: ∗ for P < 0.05, ∗∗ for P < 0.01, ∗∗∗ for P < 0.001, and ∗∗∗∗ for P < 0.0001.
Fig. 5
Fig. 5
CRIP1 was a substrate of USP7 (a). CRIP1 protein was immunoprecipitated from RPMI 8226 cells, and the proteins interacting with CRIP1 were analysed with immunoprecipitation-mass spectrometry. GO enrichment analysis was performed to analyse the signalling pathway interacting with CRIP1. (b). RPMI 8226 CRIP1-OE and MM.1s CRIP1-OE cells were subjected to immunoprecipitation using anti-Flag affinity purification gel, and the interaction between USP7 and CRIP1 protein was examined using Western blot analysis. (c). ARP1, KMS11 and 8226 CRIP1-OE cells were treated with P5091 (0, 20, 30 and 40 μM for 12 h), and CRIP1 protein was assessed by Western blotting. RPMI 8226 CRIP1-OE cells were treated with or without P5091 (10 μM, 12 h). Subsequently, immunoprecipitation was performed using an anti-Flag affinity purification gel, and the CRIP1 and ubiquitinated proteins was detected through Western blotting. RPMI 8226 EV cells were utilized as a control. (d). After knockdown of USP7 in ARP1 CRIP1 OE cells, Flag antibody was utilized for co-immunoprecipitation followed by western blotting to detect changes in CRIP1 ubiquitination. (e). ARP1, KMS11, and 8226 CRIP1-OE cells were treated with P5091 (25, 30 μM) or MG132 (10 μM) alone or in combination, and the CRIP1 protein was assessed using Western blotting. (f). The protein levels of CRIP1 and USP7 in bone marrow plasma cells of NDMM, RRMM and PCL (n = 10) were determined through Western blotting (shown in Supplemental Fig. S1), followed by correlation analysis of these two proteins using the Pearson coefficient.
Fig. 6
Fig. 6
CRIP1 forms a complex with USP7/PA200 and facilitates PA200 stabilization (a). The effects of P5091 treatment (25 μM, 12 h) on the protein levels of CRIP1 and PA200 were assessed in ARP1 and NCI-H929 cells via Western blot analysis. (b). The effects of increasing concentrations (0, 20, 30, and 40 μM) of P5091 treatment on CRIP1 and PA200 expression were analysed via Western blot analysis in ARP1 and ARP1 CRIP1-OE cells. (c). After transfection of USP7-shRNA into ARP1 CRIP1-OE cells, the protein levels of USP7, CRIP1 and PA200 were analysed using Western blot analysis. (d).Nondenaturing lysis of ARP1 cells was performed, followed by immunoprecipitation using CRIP1, PA200, and USP7 antibodies to detect protein–protein interactions. (e and f). Protein–protein interactions were determined via immunoprecipitation using PA200 or USP7 antibodies, followed by Western blot analysis of USP7, PA200, CRIP1, and ubiquitin (Ub) proteins in KMS11 CRIP1-shRNA (e) and NCI-H929 CRIP1-OE (f) cells. (g). ARP1 EV, ARP1 CRIP1-OE, NCI-H929 EV, and NCI-H929 CRIP1-OE cells were treated with 100 μg/mL cycloheximide (CHX) for 0, 3, 6, and 9 h, respectively. The protein levels of PA200 and CRIP1 were analysed by Western blot analysis. The protein bands were qualified by using Image J software. The protein level of PA200 relative to GAPDH was calculated, and a line graph was generated to assess the degradation rate of PA200 (P < 0.001, unpaired t test).
Fig. 7
Fig. 7
USP7 or PA200 inhibition rescues drug-resistance induced by CRIP1 (a). ARP1 and NCI-H929 cells were treated with bortezomib (10 nM), P5091 (10 μM), or a combination of both for 24 h. Cell viability was assessed using the CCK-8 assay. (b and c). qPCR was performed to detect the expression of CRIP1 in CD138+ tumour cells isolated from bone marrow aspirates of patients with MM(n = 11), and the patients with MM were divided into two groups based on the CRIP1 mRNA expression level (low CRIP1 group (n = 8) and high CRIP1 group (n = 3)). CD138+ tumour cells from patients with MM were treated with P5091 (5 μM) and/or bortezomib (5 nM) for 24 h, and cell viability was assessed using the CCK-8 assay. (d). PSME4 or USP7 was knocked down in ARP1 CRIP1-OE and NCI-H929 CRIP1-OE cells. Bortezomib was used to treat cells at concentrations ranging from 0 to 100 nM for 24 h, and the half-maximal inhibitory concentration (IC50) was calculated for each group. (e). 5 × 106 NCI-H929 EV, CRIP1-OE, CRIP1-OE with PSME4-shRNA, CRIP1-OE with USP7-shRNA and control cells (Scr) expressing luciferase were injected into the right flank of 7-week-old female NOD/SCID mice (n = 30, n = 3/group) to analyse tumour proliferation. After 9 days, mice were treated with bortezomib (1 mg/kg) or PBS twice weekly for 3 weeks. The tumour burden was monitored by bioluminescence imaging once the tumour volume reached 2000 mm3. (f). The ROI values of tumours were analysed with Living Image software. (g). The survival curve of mice was plotted by euthanizing mice when tumours reached 2000 mm3 and documenting the survival time. (h). ARP1 EV and ARP1 CRIP1-OE cells (1 × 106) were injected subcutaneously into the left and right flanks of NOD/SCID mice (n = 48), respectively. The mice were treated with vehicle control, bortezomib (0.5 mg/kg, i.p., twice a week from day 7), P5091 (10 mg/kg, i.p., daily from day 3), I3MO (1.25 mg/kg, i.p., three times a week from day 7), a combination of BTZ and P5091 or a combination of BTZ and I3MO. The mice were euthanized for tumour examination when the tumour volume reached 2000 mm3. Tumour volumes were calculated using the following formula: length x width2 x 0.5. (i). The tumour volume was assessed in different groups of mice. (j). The inhibition rate of each group relative to the ARP1 EV or ARP1 CRIP1-OE group was calculated. The above data statistical analysis employed t-test, with the significance levels denoted as follows: ∗ for P < 0.05, ∗∗ for P < 0.01, ∗∗∗ for P < 0.001, and ∗∗∗∗ for P < 0.0001.
Fig. 8
Fig. 8
Working model of CRIP1 induces PIs resistance.

Similar articles

Cited by

References

    1. van de Donk N., Pawlyn C., Yong K.L. Multiple myeloma. Lancet. 2021;397(10272):410–427. - PubMed
    1. Zhao L., Zhao J., Zhong K., Tong A., Jia D. Targeted protein degradation: mechanisms, strategies and application. Signal Transduct Target Ther. 2022;7(1):113. - PMC - PubMed
    1. Hanley S.E., Cooper K.F. Sorting nexins in protein homeostasis. Cells. 2020;10(1):17. - PMC - PubMed
    1. Hao M., Franqui-Machin R., Xu H., et al. NEK2 induces osteoclast differentiation and bone destruction via heparanase in multiple myeloma. Leukemia. 2017;31(7):1648–1650. - PMC - PubMed
    1. Hao M., Zhang L., An G., et al. Suppressing miRNA-15a/-16 expression by interleukin-6 enhances drug-resistance in myeloma cells. J Hematol Oncol. 2011;4:37. - PMC - PubMed