. 2024 Feb;300(2):105639.
doi: 10.1016/j.jbc.2024.105639. Epub 2024 Jan 8.

Methylation of elongation factor 1A by yeast Efm4 or human eEF1A-KMT2 involves a beta-hairpin recognition motif and crosstalks with phosphorylation

Affiliations

Methylation of elongation factor 1A by yeast Efm4 or human eEF1A-KMT2 involves a beta-hairpin recognition motif and crosstalks with phosphorylation

Joshua J Hamey et al. J Biol Chem. 2024 Feb.

Abstract

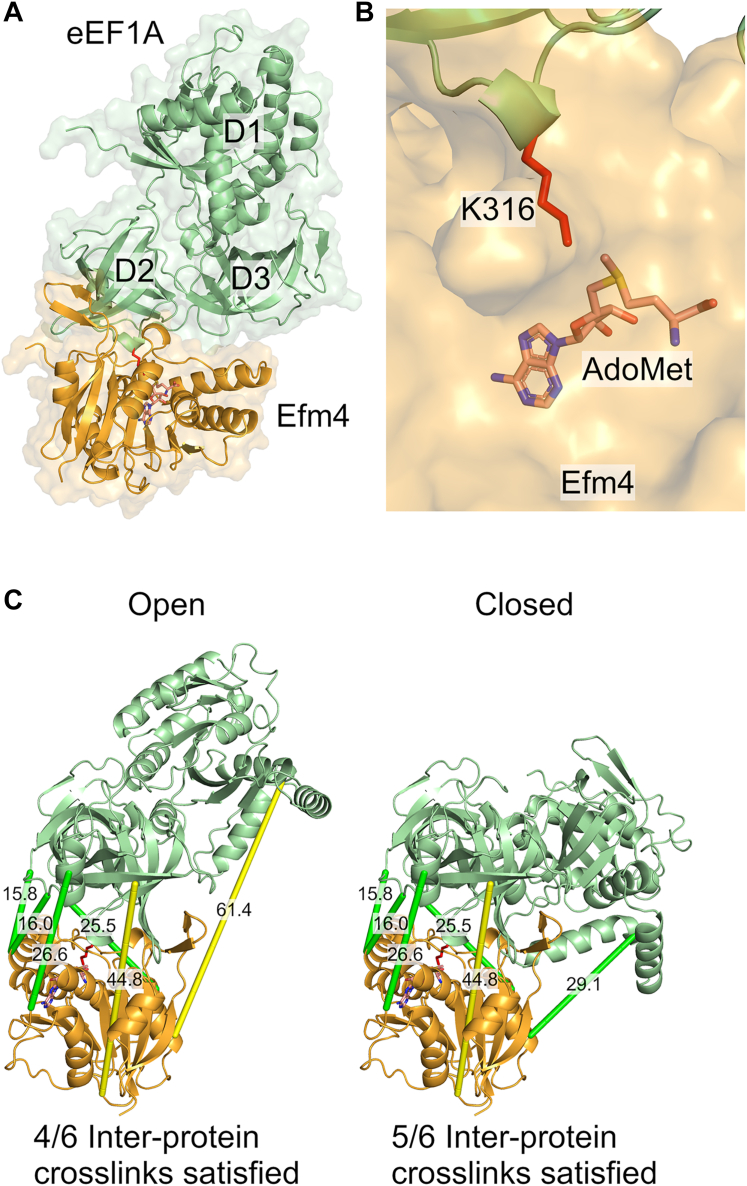
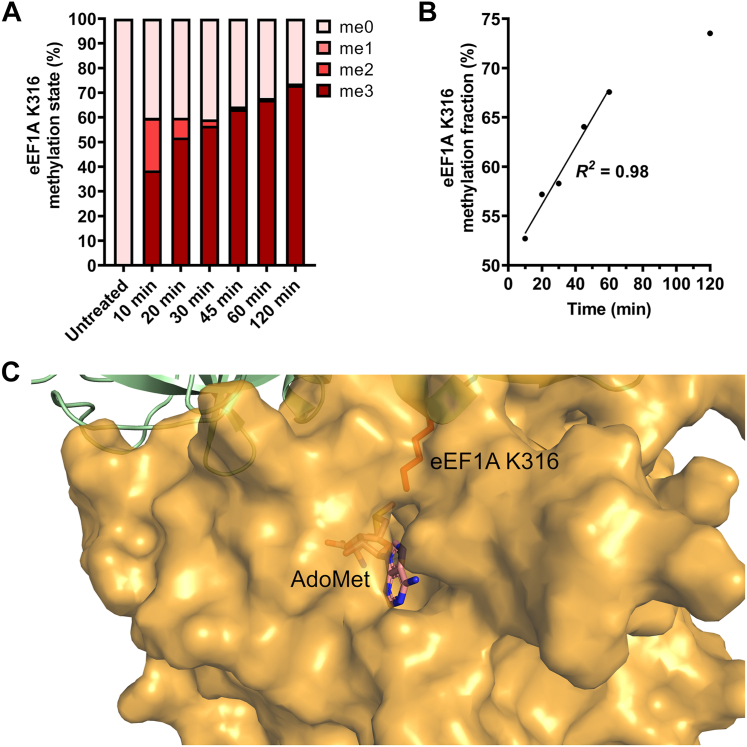
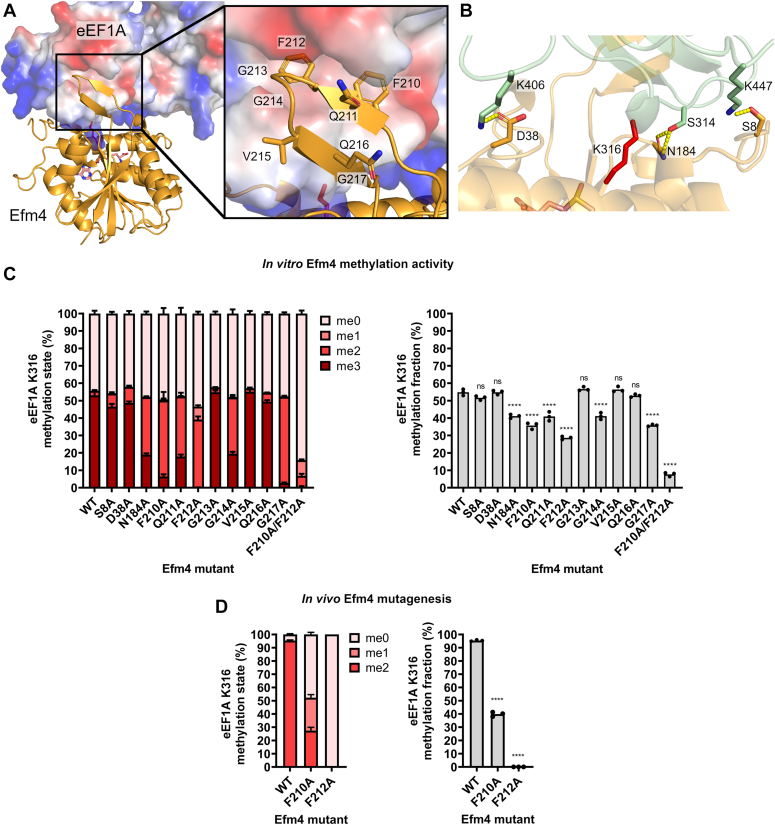
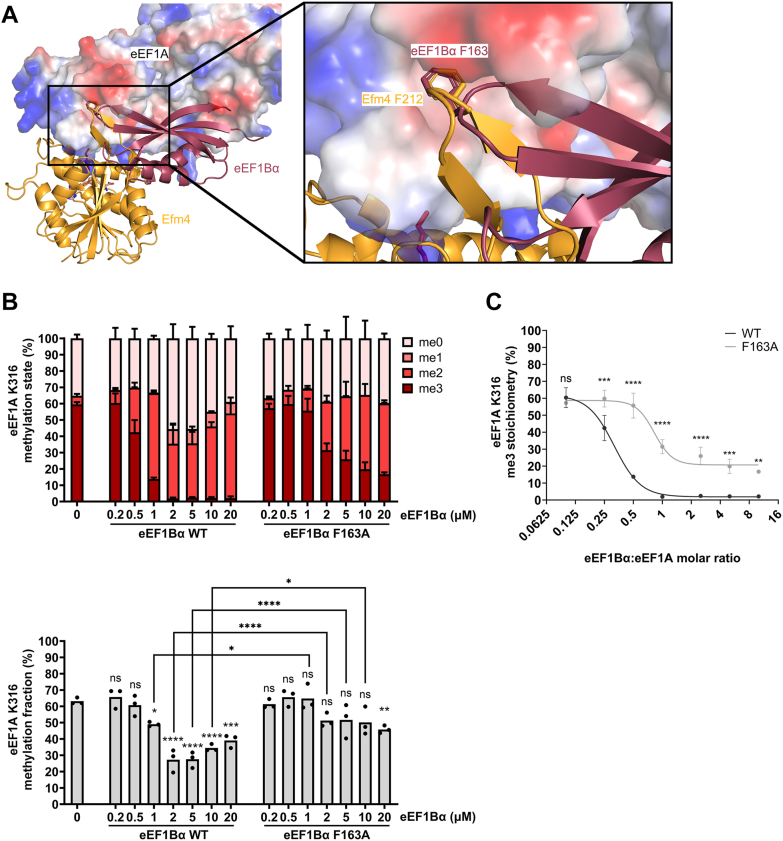
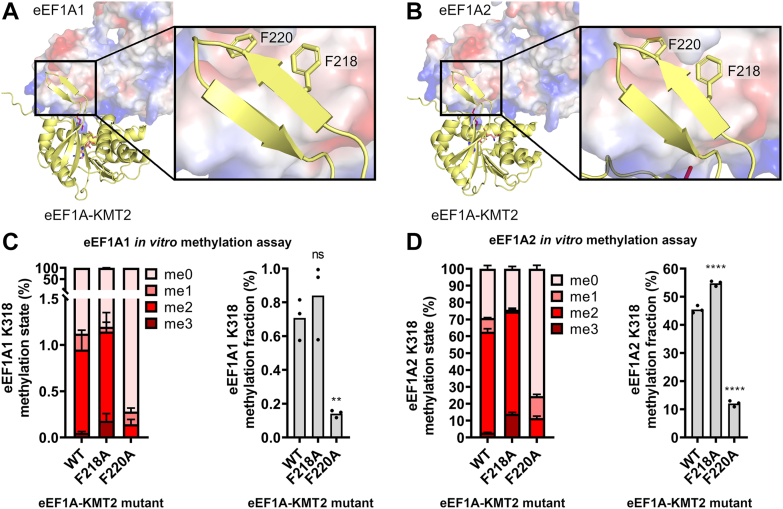
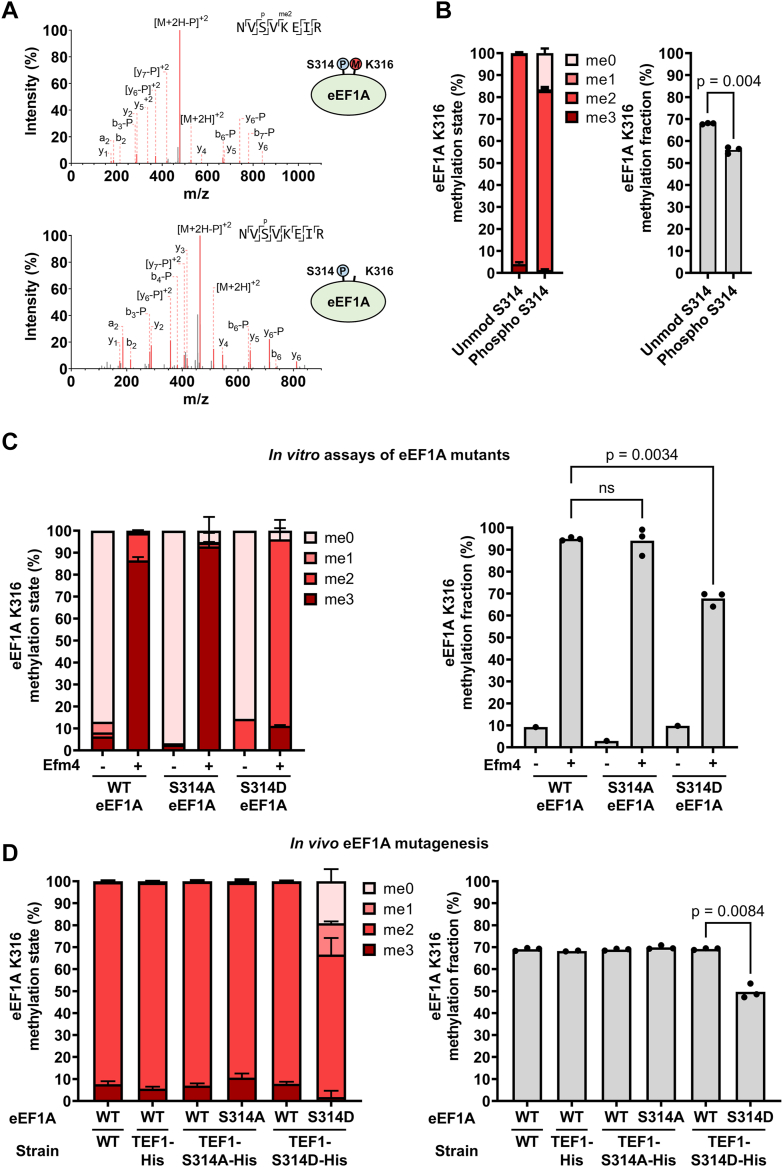
Translation elongation factor 1A (eEF1A) is an essential and highly conserved protein required for protein synthesis in eukaryotes. In both Saccharomyces cerevisiae and human, five different methyltransferases methylate specific residues on eEF1A, making eEF1A the eukaryotic protein targeted by the highest number of dedicated methyltransferases after histone H3. eEF1A methyltransferases are highly selective enzymes, only targeting eEF1A and each targeting just one or two specific residues in eEF1A. However, the mechanism of this selectivity remains poorly understood. To reveal how S. cerevisiae elongation factor methyltransferase 4 (Efm4) specifically methylates eEF1A at K316, we have used AlphaFold-Multimer modeling in combination with crosslinking mass spectrometry (XL-MS) and enzyme mutagenesis. We find that a unique beta-hairpin motif, which extends out from the core methyltransferase fold, is important for the methylation of eEF1A K316 in vitro. An alanine mutation of a single residue on this beta-hairpin, F212, significantly reduces Efm4 activity in vitro and in yeast cells. We show that the equivalent residue in human eEF1A-KMT2 (METTL10), F220, is also important for its activity towards eEF1A in vitro. We further show that the eEF1A guanine nucleotide exchange factor, eEF1Bα, inhibits Efm4 methylation of eEF1A in vitro, likely due to competitive binding. Lastly, we find that phosphorylation of eEF1A at S314 negatively crosstalks with Efm4-mediated methylation of K316. Our findings demonstrate how protein methyltransferases can be highly selective towards a single residue on a single protein in the cell.

Keywords: AlphaFold; crosslinking mass spectrometry; protein cross-linking; protein methylation; protein methyltransferase; translation elongation factor.


Conflict of interest statement

Conflict of interest The authors declare that they have no conflicts of interest with the contents of this article.

Figures

Figure 1
Figure 1
AlphaFold-multimer model of Efm4 bound to eEF1A and validation by crosslinking mass spectrometry.A, top-ranked AlphaFold-Multimer model of Efm4 (orange) bound to eEF1A (green) with AdoMet (shown as sticks) docked into Efm4. The three domains of eEF1A are labeled as D1, D2, and D3 respectively. B, model in (A) showing proximity of eEF1A K316 (red sticks) to the transferred methyl group of AdoMet (sticks) in Efm4 (orange surface). C, crosslinking mass spectrometry (XL-MS) analysis of the Efm4:eEF1A complex was carried out with DSSO. Purified Efm4 was incubated with eEF1A purified from a ΔEFM4 yeast strain in the presence of DSSO and AdoMet. Proteins were then digested with trypsin, GluC, or chymotrypsin, and the resulting crosslinked peptides were detected by LC-MS/MS. The six detected unique crosslinks were mapped into the AlphaFold-Multimer model (rank 1) of Efm4:eEF1A in the “open” conformation (left) and the “closed” conformation (right). The “closed” conformation of eEF1A was generated by aligning domain 1 of eEF1A from the AlphaFold-Multimer model to domain 1 of eEF1A bound to the ribosome (PDB ID: 4CXG). In the “closed” conformation, five crosslinks were within the expected 30 Å distance for DSSO (shown in green), while one was >30 Å (shown in yellow).
Figure 2
Figure 2
Efm4 catalyzes eEF1A K316 dimethylation processively.A and B, Efm4 time-series methylation assay. Purified WT Efm4 (3 μM) was incubated with eEF1A (from ΔEFM4) (2 μM) in the presence of AdoMet at 30 °C, for the indicated times. Proteins were separated by SDS-PAGE (see Fig. S7), eEF1A gel bands digested with AspN, and the resulting eEF1A K316 methylation was detected by LC-MS/MS and quantification of AspN-generated peptide DNVGFNVKNVSVK (K316 underlined) in its triply-charged state. A, relative levels of eEF1A K316 methylation states. B, eEF1A K316 methylation fraction relative to 100% trimethylated K316, with a line of best fit shown for 10–60 min. C, AlphaFold-Multimer model of Efm4:eEF1A (rank 1) showing a channel in Efm4 (shown as an orange surface structure) through which AdoMet (shown as sticks) could be exchanged, while Efm4 remains bound to eEF1A K316 (shown as red sticks).
Figure 3
Figure 3
A beta-hairpin on Efm4 is critical for its activity towards eEF1A K316 in vitro and in vivo.A, AlphaFold-Multimer model of Efm4:eEF1A (rank 1) showing a beta-hairpin extending from Efm4 binding a hydrophobic pocket in domain 2 of eEF1A. Efm4 (orange) is shown as a cartoon structure. eEF1A is shown as its surface electrostatic potential (blue = positive, red = negative, white = neutral). Inset: sidechains of residues on Efm4 beta-hairpin are shown as sticks (nitrogen = blue, oxygen = red). B, model in (A) showing predicted polar contacts between Efm4 (orange) and eEF1A (green). K316 is show as red sticks. Hydrogen bonds are shown as yellow dashes. C, in vitro methylation assays of Efm4 mutants. Purified WT or mutant Efm4 (3 μM) were incubated with eEF1A (from ΔEFM4) (2 μM) in the presence of AdoMet for 30 min at 30 °C. Assays were carried out in triplicate. Proteins were separated by SDS-PAGE (see Fig. S8), eEF1A gel bands digested by AspN, and the resulting eEF1A K316 methylation was detected by LC-MS/MS and quantification of AspN-generated peptide DNVGFNVKNVSVK (K316 underlined) in its triply-charged state. Left: Relative levels of eEF1A K316 methylation states. Error bars show one SD. Right: eEF1A K316 methylation fraction relative to 100% trimethylated K316. Methylation fractions from mutant Efm4 were compared to WT Efm4 using an ordinary one-way ANOVA with a post hoc Dunnett’s multiple comparisons test (ns: not significant, ∗∗∗∗p ≤ 0.0001). D, F210A or F212A mutation of Efm4 reduces or ablates eEF1A K316 methylation in vivo. All three clones of WT, F210A, and F212A Efm4 genomic mutants (see Table 1) were analyzed for their levels of eEF1A K316 methylation by parallel reaction monitoring of GluC peptide QGVPGDNVGFNVKNVSVKE (K316 underlined). Left: Relative levels of eEF1A K316 methylation states. Right: eEF1A K316 methylation fraction relative to 100% dimethylated K316. Methylation fractions from mutant Efm4 were compared to WT Efm4 using an ordinary one-way ANOVA with a post hoc Dunnett’s multiple comparisons test (∗∗∗∗: p ≤ 0.0001).
Figure 4
Figure 4
eEF1Bα inhibits Efm4 methylation of eEF1A K316 in vitro.A, the co-crystal structure of eEF1A and eEF1Bα (PDB ID: 1F60) was aligned to the AlphaFold-Multimer model of Efm4:eEF1A (rank 1), by alignment of domains 2 and 3 of eEF1A. Efm4 (orange) and eEF1Bα (dark red) are shown as cartoon structures. eEF1A is shown as its surface electrostatic potential (blue = positive, red = negative, white = neutral). B and C, in vitro methylation assays of Efm4 in the presence of eEF1Bα. Purified WT Efm4 (3 μM) was incubated with eEF1A (from ΔEFM4) (2 μM) in the presence of varying concentrations of eEF1Bα WT or F163A and with AdoMet for 30 min at 30 °C. Proteins were separated by SDS-PAGE (see Fig. S10), eEF1A gel bands digested by AspN, and the resulting eEF1A K316 methylation was detected by LC-MS/MS and quantification of AspN-generated peptide DNVGFNVKNVSVK (K316 underlined) in its triply-charged state. B, Top: Relative levels of eEF1A K316 methylation states. Bottom: eEF1A K316 methylation fraction relative to 100% trimethylated K316. Methylation fractions from assays in the presence of eEF1Bα (WT and F163A) were compared to the assay without eEF1Bα (0 μM) using an ordinary one-way ANOVA with a post hoc Dunnett’s multiple comparisons test. Methylation fractions from assays in the presence of the same concentrations of WT or F163A mutant eEF1Bα were compared using an ordinary one-way ANOVA with a post hoc Šídák’s multiple comparisons test (nonsignificant results for 0.2 μM, 0.5 μM, and 20 μM not shown). ns: not significant, ∗p ≤ 0.05, ∗∗p ≤ 0.01, ∗∗∗p ≤ 0.001, ∗∗∗∗p ≤ 0.0001. C, relative levels of eEF1A K316 trimethylation are significantly higher for Efm4 methylation assays coincubated with F163A mutant eEF1Bα compared with WT eEF1Bα, at eEF1Bα:eEF1A molar ratios of 0.25 and higher. Line of best fit: four-parameter dose-response curve; WT r2 = 0.98, F163A r2 = 0.93.
Figure 5
Figure 5
A noncanonical isoform of eEF1A-KMT2 is the predominantly expressed protein.A, alignment of the canonical isoform of eEF1A-KMT2 (eEF1A-KMT2-201) and a secondary isoform (eEF1A-KMT2-207), showing that they differ only at their C-terminal regions from residue 207 onwards. Identical residues are red, different residues are blue, and gaps are gray. The two underlined regions of eEF1A-KMT2-207 indicate the peptides confirmed in (B) and Fig. S16. Alignment was generated in COBALT (NCBI). B, comparison of MS/MS spectra generated from purified eEF1A-KMT2-207 and from public proteomic datasets, confirming the identity of two eEF1A-KMT2-207-specific peptides. These peptides were also confirmed in two other cell lines (see Fig. S16). Spectra were graphed and compared using the Universal Spectrum Explorer (91), with the following settings: fragment ions: a, b, y; fragment ion charge states: 1+, 2+; fragment annotation tolerance: 20 ppm; annotation intensity threshold: 5% base peak.
Figure 6
Figure 6
eEF1A-KMT2 isoform 207 methylates eEF1A1 and eEF1A2 in vitro.A, left: top-ranked AlphaFold-Multimer models of eEF1A-KMT2-207:eEF1A1 and eEF1A-KMT2-207:eEF1A2 complexes shown as cartoon and surface. Right: eEF1A1/2 K318 is bound proximal to the predicted AdoMet-binding site of eEF1A-KMT2-207. AdoMet is shown as sticks, K318 is shown as red sticks, and eEF1A-KMT2-207 is shown as yellow, semi-transparent surface. B, eEF1A-KMT2-207 methylates eEF1A1 and eEF1A2 at K318 in vitro, while eEF1A-KMT2-201 does not. Purified eEF1A1 or eEF1A2 (2.2 μM) were incubated without any enzyme or with eEF1A-KMT2-201 or eEF1A-KMT2-207 (3 μM) in the presence of AdoMet for 18 h at 37 °C. Proteins were separated by SDS-PAGE (see Fig. S20), and eEF1A1 and eEF1A2 gel bands were then digested by AspN and analyzed by LC-MS/MS. Shown are extracted ion chromatograms (XICs) for the triply-charged peptide DNVGFNVKNVSVK (K318 underlined) in its un-, mono-, di-, or tri-methylated states.
Figure 7
Figure 7
A conserved phenylalanine in human eEF1A-KMT2 is critical for its eEF1A K318 methylation activity.A and B, AlphaFold-Multimer model showing a beta-hairpin extending from eEF1A-KMT2 (isoform 207) binding a hydrophobic pocket in domain 2 of eEF1A1 (A) or eEF1A2 (B). eEF1A-KMT2-207 (yellow) is shown as a cartoon structure. eEF1A1/2 is shown as its surface electrostatic potential (blue = positive, red = negative, white = neutral). Inset: sidechains of conserved eEF1A-KMT2-207 residues F218 and F220 on its beta-hairpin are shown as sticks. C and D, in vitro methylation assays of eEF1A-KMT2 mutants. Purified WT and mutant eEF1A-KMT-207 (3 μM) were incubated with eEF1A1 (C) or eEF1A2 (D) (2.2 μM) in the presence of AdoMet for 2 h at 37 °C. Proteins were separated by SDS-PAGE (see Fig. S21), eEF1A1/2 gel bands digested with AspN, and the resulting eEF1A1/2 K318 methylation was detected by LC-MS/MS and quantification of AspN-generated peptide DNVGFNVKNVSVK (K318 underlined) in its triply-charged state. Left: Relative levels of eEF1A1/2 K318 methylation states. Right: eEF1A1/2 K318 methylation fraction relative to 100% trimethylated K318. Methylation fractions from mutant eEF1A-KMT2 were compared to WT eEF1A-KMT2 using an ordinary one-way ANOVA with a post hoc Dunnett’s multiple comparisons test (ns: not significant, ∗∗p ≤ 0.01, ∗∗∗∗p ≤ 0.0001).
Figure 8
Figure 8
eEF1A S314 phosphorylation inhibits Efm4-mediated K316 methylation in vitro and in vivo.A, Orbitrap MS/MS spectra of the doubly-charged peptides NVSpVKme2EIR and NVSpVKEIR, indicating eEF1A S314 phosphorylation with and without comodification by K316 dimethylation. Matched fragment ions are red and unmatched fragment ions are gray. ‘-P’ indicates phosphate neutral loss (-H3PO4). B, phosphorylated S314 correlates with lower methylation levels of K316. Biological triplicate eEF1A purifications were digested by trypsin and subject to phospho-peptide enrichment and analysis by LC-MS/MS. K316 methylation levels on the unphosphorylated peptide NVSVKEIR was measured in the unenriched sample, while K316 methylation levels on the phosphorylated peptide NVSpVKEIR was measured in the enriched sample. Peptide quantities were determined by taking the area under the curve of extracted ion chromatograms (XICs) of the doubly-charged form of the peptide NVSVKEIR in all its methylated/phosphorylated states. C, purified WT and mutant eEF1A (2 μM) were incubated with or without purified Efm4 (3 μM) in the presence of AdoMet at 30 °C for 30 min. Assays were carried out in triplicate. Proteins were separated by SDS-PAGE (see Fig. S22), and eEF1A gel bands were digested with trypsin. D, chromosomally incorporated eEF1A S314 phospho-mimic mutations reduce K316 methylation levels in vivo. Yeast strains were cultured in triplicate for the analysis of K316 methylation, with the except of TEF1-His which was cultured in duplicate. For both (C) and (D), eEF1A K316 methylation was determined by LC-MS/MS and quantification of tryptic peptides NVSVKEIR (WT eEF1A, K316 underlined), NVAVKEIR (S314A eEF1A, K316 underlined), or NVDVKEIR (S314D eEF1A, K316 underlined) in their doubly-charged state. Left: Relative levels of eEF1A K316 methylation states. Right: eEF1A K316 methylation fraction relative to 100% trimethylated K316. p-values are from two-tailed t-tests without equal variance. ns: not significant.

Similar articles

Cited by

References

    1. Levy D. Lysine methylation signaling of non-histone proteins in the nucleus. Cell. Mol. Life Sci. 2019;76:2873–2883. - PMC - PubMed
    1. Di Blasi R., Blyuss O., Timms J.F., Conole D., Ceroni F., Whitwell H.J. Non-histone protein methylation: biological significance and Bioengineering potential. ACS Chem. Biol. 2021;16:238–250. - PubMed
    1. Biggar K.K., Li S.S. Non-histone protein methylation as a regulator of cellular signalling and function. Nat. Rev. Mol. Cell Biol. 2015;16:5–17. - PubMed
    1. Malecki J.M., Davydova E., Falnes P.O. Protein methylation in mitochondria. J. Biol. Chem. 2022;298 - PMC - PubMed
    1. Guccione E., Richard S. The regulation, functions and clinical relevance of arginine methylation. Nat. Rev. Mol. Cell Biol. 2019;20:642–657. - PubMed

Publication types

MeSH terms

Substances