. 2024 Jan 9;12(1):e006991.
doi: 10.1136/jitc-2023-006991.

Cell membrane-anchored and tumor-targeted IL-12 T-cell therapy destroys cancer-associated fibroblasts and disrupts extracellular matrix in heterogenous osteosarcoma xenograft models

Affiliations

Cell membrane-anchored and tumor-targeted IL-12 T-cell therapy destroys cancer-associated fibroblasts and disrupts extracellular matrix in heterogenous osteosarcoma xenograft models

Jiemiao Hu et al. J Immunother Cancer. .

Abstract

Background: The extracellular matrix (ECM) and cancer-associated fibroblasts (CAFs) play major roles in tumor progression, metastasis, and the poor response of many solid tumors to immunotherapy. CAF-targeted chimeric antigen receptor-T cell therapy cannot infiltrate ECM-rich tumors such as osteosarcoma.

Method: In this study, we used RNA sequencing to assess whether the recently invented membrane-anchored and tumor-targeted IL-12-armed (attIL12) T cells, which bind cell-surface vimentin (CSV) on tumor cells, could destroy CAFs to disrupt the ECM. We established an in vitro model of the interaction between osteosarcoma CAFs and attIL12-T cells to uncover the underlying mechanism by which attIL12-T cells penetrate stroma-enriched osteosarcoma tumors.

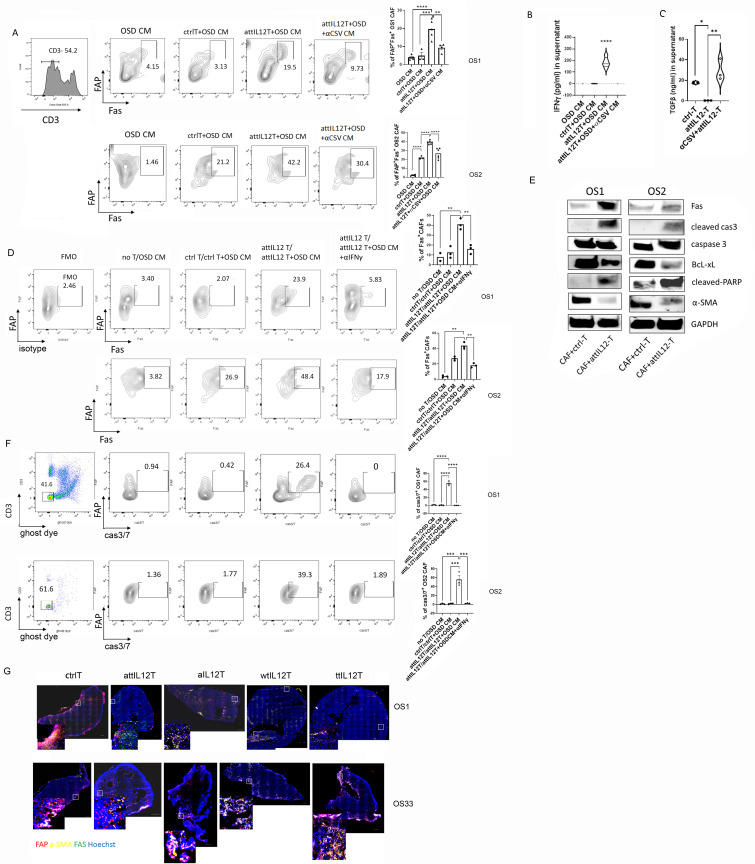
Results: RNA sequencing demonstrated that attIL12-T cell treatment altered ECM-related gene expression. Immunohistochemistry staining revealed disruption or elimination of high-density CAFs and ECM in osteosarcoma xenograft tumors following attIL12-T cell treatment, and CAF/ECM density was inversely correlated with T-cell infiltration. Other IL12-armed T cells, such as wild-type IL-12-targeted or tumor-targeted IL-12-T cells, did not disrupt the ECM because this effect depended on the engagement between CSV on the tumor cell and its ligand on the attIL12-T cells. Mechanistic studies found that attIL12-T cell treatment elevated IFNγ production on interacting with CSV+ tumor cells, suppressing transforming growth factor beta secretion and in turn upregulating FAS-mediated CAF apoptosis. CAF destruction reshaped the tumor stroma to favor T-cell infiltration and tumor inhibition.

Conclusions: This study unveiled a novel therapy-attIL12-T cells-for targeting CAFs/ECM. These findings are highly relevant to humans because CAFs are abundant in human osteosarcoma.

Keywords: Cytokines; Immunotherapy, Adoptive; Lymphocytes, Tumor-Infiltrating; Pediatrics; Tumor Microenvironment.


Conflict of interest statement

Competing interests: No, there are no competing interests.

Figures

Figure 1
Figure 1
High densities of fibroblasts and collagen are associated with advanced-stage osteosarcoma and less T-cell infiltration. (A) Tissue arrays of human osteosarcoma of the indicated stages and adjacent normal tissue were purchased from US Biolab and subjected to Masson’s trichrome staining. Blue staining indicates fiber, and red staining indicates collagen. Graphs show staining intensity (individual value±SEM) of fiber or collagen. (B) Immunohistochemical staining of human CD3 (T-cell marker) on human osteosarcoma tissue arrays of the indicated stages. The graph shows the percentages (individual value±SEM) of CD3-stained cells per high-power field. (C, D) The correlation of fiber (C) and collagen (D) levels with CD3 expression in human osteosarcoma tissue arrays, determined by the Pearson product test. *p<0.05; ***p<0.001; NS, not significant.
Figure 2
Figure 2
Extracellular matrix (ECM) disruption is vital for membrane-anchored and tumor-targeted IL-12 (attIL12)-T cells’ antitumor efficacy against osteosarcoma patient-derived xenografts (PDXs). (A) Tumor growth curves of osteosarcoma PDX OS1 and OS33 tumors treated with the indicated T cells. Tumor cells were implanted subcutaneously in C.B-17C scid−/− mice (n=5/group). Tumor-bearing mice were preconditioned with cyclophosphamide (60 mg/kg) and underwent T-cell transfer (2.5×10⁶ cells) as indicated below the graphs. Black arrows: cyclophosphamide; and yellow arrows: T-cell infusions. Tumors were measured two times per week. (B–D) Results of RNA-seq analysis of attIL12-T cell-sensitive (OS1, OS2, and OS60) versus resistant (OS33, OS34, and OS9) osteosarcoma PDX tumors in mice subjected to cyclophosphamide preconditioning and attIL2-T cell transfer as described in (A). (B) Volcano plot showing differentially expressed genes (DEGs) in sensitive osteosarcoma PDX tumors compared with resistant osteosarcoma PDX tumors. (C) Gene Ontology (GO) enrichment analysis of DEGs. (D) Kyoto Encyclopedia of Genes and Genomes pathway analysis of DEGs. **p<0.01; ****p<0.0001.
Figure 3
Figure 3
Membrane-anchored and tumor-targeted IL-12 (attIL12)-T cells disrupt extracellular matrix (ECM) in osteosarcoma tumors. (A, B) Pearson correlation analysis of expression of hallmark genes for cancer-associated fibroblasts (CAFs) (FAP, ACTA2, THY1, and PDPN) with expression of an ECM gene signature (COL1A1, SPARC, LAMB1, ITGB1, FN1, and CD44) (A) or CCN4 (B); data obtained from TCGA. (C) Immunoblots of ECM markers fibroblast activation protein (FAP), pan-collagen, sparc, integrin β1, laminin, transforming growth factor beta (TGFβ), and fibronectin in control T-cell-treated or attIL12-T cell-treated sensitive (OS1 and OS2) and resistant (OS33 and OS34) PDX tumors. (D) Masson’s trichrome staining of control T-cell-treated or attIL12-T cell-treated OS1 and OS33 tumor sections. Blue staining indicates fiber, and red staining indicates collagen. The graphs show the staining intensity (individual value±SEM) of fiber or collagen. Scale bar: 500 µm. (E) Immunofluorescence staining and whole-slide scanning images of α-smooth muscle actin and FAP colocalization on OS1 and OS2 tumors with the indicated treatments. Scale bar: 500 µm. Counterstain: Hoechst. **p<0.01; NS, not significant.
Figure 4
Figure 4
Extracellular matrix destruction is closely associated with enhanced T-cell infiltration and antitumor efficacy. Osteosarcoma patient-derived xenograft (PDX) tumor-bearing mice (n=3–5) were subjected to control-T, membrane-anchored and tumor-targeted IL-12 (attIL12)-T, membrane-anchored IL-12 (aIL12)-T, wild-type IL-12 (wtIL12)-T, or tumor-targeted IL-12 (ttIL12)-T cell treatment as described in figure 2. (A) Masson’s trichrome staining of OS1, OS2, and OS33 tumor sections. Scale bar: 500 µm. (B) Immunohistochemistry staining of CD3 in OS1, OS2, OS33, and OS34 PDX tumor sections. The bar graphs show the intensity (mean±SEM) of CD3 staining. (C) Pearson correlation analysis of T-cell staining intensity and tumor size in osteosarcoma PDX models. *p<0.05; **p<0.01; ***p<0.001; ****p<0.0001.
Figure 5
Figure 5
Membrane-anchored and tumor-targeted IL-12 (attIL12)-T cells induced cancer-associated fibroblast (CAF) death and extracellular matrix destruction. (A) Flow cytometry analysis of cleaved caspase 3 expression in CAFs from control T-cell or attIL12-T cell-treated OS1 tumors, n=3. (B–F) CAFs were isolated from OS1, OS2, and OS33 tumors and cultured as described in the Materials and methods section. CAFs were then cocultured with indicated T cells at a 1:3 ratio for 48 hours (n=3). (B) Dead CAFs determined by ghost dye staining and flow cytometry. (C) Apoptotic CAFs from OS1, OS2, and OS33 tumors determined via fluorescent staining of α-smooth muscle actin and caspase 3/7. (D) Pearson correlation analysis of CAF signature genes (FAP, ACTA2, THY1, and PDPN) and TGFB1 obtained from TCGA database. (E) Transforming growth factor beta (TGFβ) expression in OS1, OS2, and OS33 CAFs determined via flow cytometry. The graphs represent the percentages (individual value±SEM) of TGFβ+ or FAP+TGFβ+ CAFs. (F) Collagen gel contraction assay of control-T or attIL12-T-treated CAFs for 7 days. **p<0.01; ***p<0.001; ****p<0.0001.
Figure 6
Figure 6
Membrane-anchored and tumor-targeted IL-12 (attIL12)-T cell treatment upregulates FAS expression on the cell surface of cancer-associated fibroblasts (CAFs). (A–C) CAFs were cocultured with the indicated T cells (1:3 ratio) in OSD-conditioned medium (OSD CM) with or without the cell-surface vimentin (CSV)-blocking antibody 84–1 (10 µg/mL) for 48 hours (n=3). (A) FAS expression on OS1 and OS2 CAFs as determined by flow cytometry. Graphs show the percentages (mean±SEM) of FAS+ CAFs. (B) Violin plot showing the concentrations (mean±SEM) of interferon gamma (IFNγ) in supernatant as determined by ELISA. (C) Violin plot shows the transforming growth factor beta (TGFβ) level (mean±SEM) in supernatant as determined via ELISA. (D, E, F) CAFs were cocultured with T cells (1:3 ratio) in OSD CM with or without an IFNγ-blocking antibody (10 µg/mL) (n=3). (D) FAS expression on OS1 and OS2 CAFs as determined by flow cytometry. Graphs show the percentages (mean±SEM) of FAS+ CAFs. (E) Suspended T cells were removed from the coculture system after 48 hours. Immunoblots of FAS, cleaved caspase 3, total caspase 3, BcL-xL, cleaved PARP, α-SMA, and GAPDH in OS1 and OS2 CAFs are shown. (F) Caspase 3/7 expression on OS1 and OS2 CAFs as determined by flow cytometry. Graphs show the percentages (mean±SEM) of cas3/7+ CAFs. (G) Immunofluorescence staining and whole-slide staining of OS1 and OS33 tumor sections stained with fibroblast activation protein (FAP) (red), α-smooth muscle actin (αSMA) (yellow), Fas (green), and Hoechst (blue). Scale bar: 500 µm. **p<0.01; ***p<0.001; ****p<0.0001.

References

    1. Todd JR, Ryall KA, Vyse S, et al. . Systematic analysis of tumour cell-extracellular matrix adhesion identifies independent Prognostic factors in breast cancer. Oncotarget 2016;7:62939–53. 10.18632/oncotarget.11307 - DOI - PMC - PubMed
    1. Lim SB, Tan SJ, Lim WT, et al. . An extracellular matrix-related Prognostic and predictive indicator for early-stage non-small cell lung cancer. Nat Commun 2017;8:1734. 10.1038/s41467-017-01430-6 - DOI - PMC - PubMed
    1. Miskolczi Z, Smith MP, Rowling EJ, et al. . Collagen abundance controls Melanoma phenotypes through lineage-specific Microenvironment sensing. Oncogene 2018;37:3166–82. 10.1038/s41388-018-0209-0 - DOI - PMC - PubMed
    1. He M, Wang Z, Zhao J, et al. . Col1A1 polymorphism is associated with risks of Osteosarcoma susceptibility and death. Tumour Biol 2014;35:1297–305. 10.1007/s13277-013-1172-6 - DOI - PubMed
    1. Xiao Z, Wan J, Nur AA, et al. . Targeting Cd44 by CRISPR-Cas9 in multi-drug resistant Osteosarcoma cells. Cell Physiol Biochem 2018;51:1879–93. 10.1159/000495714 - DOI - PubMed

Publication types