. 2024 Jan 10;7(3):e202302282.
doi: 10.26508/lsa.202302282. Print 2024 Mar.

Chromatin targeting of the RNF12/RLIM E3 ubiquitin ligase controls transcriptional responses

Affiliations

Chromatin targeting of the RNF12/RLIM E3 ubiquitin ligase controls transcriptional responses

Carmen Espejo-Serrano et al. Life Sci Alliance. .

Abstract

Protein ubiquitylation regulates key biological processes including transcription. This is exemplified by the E3 ubiquitin ligase RNF12/RLIM, which controls developmental gene expression by ubiquitylating the REX1 transcription factor and is mutated in an X-linked intellectual disability disorder. However, the precise mechanisms by which ubiquitylation drives specific transcriptional responses are not known. Here, we show that RNF12 is recruited to specific genomic locations via a consensus sequence motif, which enables co-localisation with REX1 substrate at gene promoters. Surprisingly, RNF12 chromatin recruitment is achieved via a non-catalytic basic region and comprises a previously unappreciated N-terminal autoinhibitory mechanism. Furthermore, RNF12 chromatin targeting is critical for REX1 ubiquitylation and downstream RNF12-dependent gene regulation. Our results demonstrate a key role for chromatin in regulation of the RNF12-REX1 axis and provide insight into mechanisms by which protein ubiquitylation enables programming of gene expression.


Conflict of interest statement

The authors declare that they have no conflict of interest.

Figures
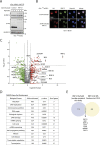
Figure 1.
Figure 1.. RNF12 TurboID proximity labelling identifies chromatin-associated proteins.
(A) Rlim+/y mouse embryonic stem cells (mESCs) stably overexpressing HA-TurboID RNF12 and HA-TurboID control were treated with MG132, doxycycline, and biotin in triplicate. Levels of HA-TurboID RNF12 and HA-TurboID control were determined by immunoblotting and indicated by an asterisk. ERK1/2 is shown as a loading control. (B) Immunofluorescence analysis of doxycycline and biotin-treated Rlim+/y mESCs stably overexpressing HA-TurboID RNF12 and HA-TurboID control. HA, total RNF12, and Hoechst as a nuclear stain are shown. (C) Volcano plot showing relative change in protein abundance of biotinylated proteins comparing MG132, doxycycline, and biotin-treated Rlim+/y mESCs stably overexpressing HA-TurboID RNF12 to HA-TurboID control. Red data points indicate proteins displaying a >twofold increase in intensity in HA-TurboID RNF12-expressing mESCs. (D) Database for Annotation, Visualization, and Integrated Discovery analysis showing enriched biological processes within the gene set encoding proteins with annotated nuclear localisation and/or function and which display >twofold increased intensity in HA-TurboID RNF12-overexpressing cells compared with control. (E) Venn diagram displaying the number of proteins identified to have >twofold increase in intensity in HA-TurboID RNF12-overexpressing cells relative to control, compared with the number of RNF12-interacting proteins identified by affinity-purification mass spectrometry (Gontan et al, 2012). Proteins common to both datasets are indicated. Source data are available for this figure.
Figure 2.
Figure 2.. RNF12 colocalises with REX1 transcription factor substrate at specific genomic regions.
(A) RNF12 WT knock-in (WT-KI) mouse embryonic stem cells (mESCs) were subjected to chromatin fractionation, and RNF12, REX1, βIII-tubulin (TUBβ3), and phospho-Ser10 Histone H3 (pH3) levels determined by immunoblotting. TUBβ3 is used as a marker of the soluble fraction, and pH3 as a marker of the chromatin fraction. Data are representative of n = 4 independent experiments. (B) Quantification of the RNF12 signal observed in (A). Data are represented as the proportion of RNF12 in soluble and chromatin fractions. As the protein content of the soluble fraction is higher than that of the chromatin fraction, the relative proportion of protein in soluble versus chromatin fraction was calculated in all subsequent quantifications. Data represented as mean ± SEM (n = 4). (C) Quantification of the REX1 signal observed in (A). Data represented as mean ± SEM (n = 4). (D) Heatmap showing the enrichment of RNF12WT, RNF12H569A,C572A, and REX1 ChIP-seq data at REX1-RNF12 shared peaks and unique peaks identified by MAnorm. The signal in the region ±3 kb of the peak center is shown in the heatmap and summarized in the profile plot above. The colour bar shows the Poisson P-value (−log10) calculated by MACS2 using control as lambda and treatment as observation, whereas the y-axis of the profile plot shows the mean Poisson P-value across all peaks of each category. (E) Peak count frequency relative to distance from transcriptional start sites of ChIP-seq peaks identified for RNF12WT, RNF12H569A,C572A, and REX1. (F) Genome browser view of the input-normalized tracks for RNF12WT, RNF12H569A,C572A, and REX1 at the Xist/Tsix locus. The y-axes show the −log10(Poisson P-value) as described in (D). (G) DNA sequence motif enrichment analysis of ChIP-seq sequences identified for RNF12WT and REX1 (top hit shown). Source data are available for this figure.
Figure S1.
Figure S1.. Chromatin immunoprecipitation followed by DNA sequencing (ChIP-seq) analysis of RNF12 and REX1 genome occupancy.
(A) Venn diagram showing the overlap between ChIP-seq peaks identified for REX1, RNF12WT, and RNF12H569A,C572A catalytically inactive mutant. (B) M-A plot showing the REX1-RNF12WT shared peaks (grey), Rex1-unique peaks (red), and RNF12WT-unique peaks (blue). On the x-axis, the A-value of each peak is shown, which is the average log2 read densities of both datasets. The M-value on the y-axis is the log2 ratio of read densities between REX1 and RNF12WT. (C) Scatter plots showing the average scores per genomic bin (visualized as ln(score + 1)) between different combinations of the REX1, RNF12WT, and RNF12H569A,C572A datasets and the Pearson correlation coefficients for each comparison. (D) Genomic feature distribution of ChIP-seq peaks identified for RNF12WT, RNF12H569A,C572A, and REX1. (E) Differential transcription factor motif enrichment analysis between the REX1-unique and RNF12WT-unique peaks. Each dot represents the enrichment of a particular motif from HOMER motif analysis on both sets of unique peaks. The most significant motif families are highlighted in different colours.
Figure 3.
Figure 3.. RNF12 substrate REX1 is efficiently ubiquitylated on chromatin.
(A) Rlim+/y mouse embryonic stem cells (mESCs) were treated with DMSO or MG132 inhibitor for 1 h to stabilise ubiquitylated REX1 and subjected to chromatin fractionation. RNF12, REX1, βIII-tubulin (TUBβ3), and phospho-Ser10 Histone H3 (pH3) levels were determined by immunoblotting. Data are representative of n = 3 independent experiments. (B) REX1 ubiquitylation in soluble and chromatin fractions of Rlim+/y mESCs from (A) was quantified by determining relative average intensity of the fourth ubiquitylated band (REX1-Ub4; indicated by an asterisk in (A)) and normalizing to total REX1 levels. Data represented as mean ± SEM (n = 3). Statistical significance was determined by paired t test; two-sided, confidence level 95%. (C) Rlim+/y and RNF12 knock-out (Rlim−/y) mESCs were treated with MG132 inhibitor for 1 h subjected to chromatin fractionation. RNF12, REX1, βIII-tubulin (TUBβ3), and phospho-Ser10 Histone H3 (pH3) levels were determined by immunoblotting. Data are representative of n = 3 independent experiments. (D) REX1 ubiquitylation in the chromatin fraction of Rlim+/y and Rlim−/y mESCs from (C) was quantified by determining relative average intensity of the fourth ubiquitylated band (REX1-Ub4; indicated by an asterisk in (C)) and normalizing to total REX1 levels. Data represented as mean ± SEM (n = 3). Statistical significance was determined by paired t test; two-sided, confidence level 95%. (E) Rlim−/y mESCs expressing either empty vector (control), mouse RNF12WT, RNF12W576Y, and RNF12H569A,C572A were treated with DMSO or MG132 for 1 h and subjected to chromatin fractionation. RNF12, REX1, βIII-tubulin (TUBβ3), and phospho-Ser10 Histone H3 (pH3) levels were determined by immunoblotting. Data are representative of n = 3 independent experiments. (F) REX1 ubiquitylation in the chromatin fraction from (E) was quantified by determining relative average intensity of the fourth ubiquitylated band (REX1-Ub4; indicated by an asterisk in (E)) and normalizing to total REX1 levels. Data represented as mean ± SEM (n = 3). Statistical significance was determined by paired t test; two-sided, confidence level 95%. Source data are available for this figure.
Figure 4.
Figure 4.. RNF12 chromatin recruitment is largely REX1 independent.
(A) Schematic of the structure of mouse RNF12WT and deletion mutants. Indicated are the amino acid boundaries of each deletion. (B) RNF12/REX1 double knock-out (Rlim−/y; Zfp42−/−) mouse embryonic stem cells (mESCs) expressing FLAG-REX1 with either empty vector (control), HA-tagged mouse RNF12WT (1–600), RNF12Δ1–206 (ΔN), RNF12Δ326–423 (ΔBR), RNF12Δ502–513 (ΔNES), RNF12Δ543–600 (ΔRING), or RNF12Δ206–226 (ΔNLS) were subjected to chromatin fractionation. HA-RNF12, βIII-tubulin (TUBβ3) and phospho-Ser10 Histone H3 (pH3) levels were determined by immunoblotting. Data are representative of n = 4 independent experiments. (C) Quantification of HA-RNF12 deletion mutant protein levels observed in the chromatin fraction in (B) expressed relative to RNF12WT. Data represented as mean ± SEM (n = 4). Statistical significance was determined by paired t test; two-sided, confidence level 95%. (D) Rlim−/y mESCs expressing either empty vector (control), HA-tagged mouse RNF12WT (1–600), RNF121−205 (N-term) RNF12326−423 (basic region) RNF12Δ1–206 (ΔN), and RNF12Δ326–423 (ΔBR) were subjected to chromatin fractionation. HA-RNF12, βIII-tubulin (TUBβ3), and phospho-Ser10 Histone H3 (pH3) levels were determined by immunoblotting. Data are representative of n = 4 independent experiments. (E) Quantification of HA-RNF12 deletion mutant protein levels observed in the chromatin fraction in (D) expressed relative to RNF12WT. Data represented as mean ± SEM (n = 4). Statistical significance was determined by paired t test; two-sided, confidence level 95%. (F) RNF12/REX1 double knock-out (Rlim−/y; Zfp42−/−) mESCs expressing FLAG-REX1 with either empty vector (control), HA-tagged mouse RNF12WT, or the indicated HA-RNF12 deletion mutants were treated with MG132 for 2 h and HA-RNF12 immunoprecipitated using HA resin. HA-RNF12 and FLAG-REX1 levels were determined by immunoblotting, and Ponceau S staining is shown as a loading control. Data are representative of n = 5 independent experiments. (G) Quantification of data from (F) represented as mean ± SEM (n = 5). Statistical significance was determined by paired t test; two-sided, confidence level 95%. (H) Control (Rlim+/y), RNF12 knock-out (Rlim−/y), and RNF12/REX1 double knock-out (Rlim−/y; Zfp42−/−) mESCs expressing either empty vector (−) or HA-tagged mouse RNF12WT were subjected to chromatin fractionation. HA-RNF12, REX1, βIII-tubulin (TUBβ3), and phospho-Ser10 Histone H3 (pH3) levels were determined by immunoblotting. Data are representative of n = 3 independent experiments. (I) Quantification of HA-tagged mouse RNF12WT protein levels observed in the chromatin fraction in (H) expressed as a percentage of total HA-RNF12. Data represented as mean ± SEM (n = 3). (J) Electrophoretic mobility shift analysis of linearized pCAGGS plasmid DNA (0.5 μg) incubated with increasing concentrations (0.2–0.8 μg) of RNF12, REX1, and ACHE recombinant proteins and analysed on an 0.8% agarose gel. Data are representative of n = 3 independent experiments. Source data are available for this figure.
Figure S2.
Figure S2.. RNF12 chromatin recruitment is mediated by the basic region.
(A) Protein sequence alignment of zebrafish, frog, chick, human, mouse, and rat RNF12. Conserved residues are highlighted in red, and the basic region is indicated by green boxes. (B) RNF12 knock-out (Rlim−/y) mouse embryonic stem cells (mESCs) expressing HA-tagged mouse RNF12WT (1–600), RNF12Δ1–206 (ΔN), RNF12Δ326–423 (ΔBR), RNF12Δ502–513 (ΔNES), RNF12Δ543–600 (ΔRING), and RNF12Δ206–226 (ΔNLS) were subjected to chromatin fractionation. HA-RNF12, βIII-tubulin (TUBβ3), and phospho-Ser10 Histone H3 (pH3) levels were determined by immunoblotting. The same relative volume of soluble, chromatin, and total cell extracts fractions were used for immunoblotting. Data are representative of n = 4 independent experiments. (C) RNF12 knock-out (Rlim−/y) mESCs expressing HA-tagged mouse RNF12 N-terminal and BR deletions were analysed by immunofluorescence. HA-RNF12 was detected by anti-HA antibody, Hoechst is used as a DNA stain. Scale bar = 5 μm. Data are representative of n = 3 independent experiments. (D) RNF12 knock-out (Rlim−/y) mESCs expressing HA-tagged mouse RNF12WT, RNF121−205 (N-term), RNF12326−423 (BR), RNF12Δ1–206 (ΔN), and RNF12Δ326–423 (ΔBR) were subjected to chromatin fractionation and HA-RNF12, βIII-tubulin (TUBβ3), and phospho-Ser10 Histone H3 (pH3) levels determined by immunoblotting. The same relative volume of soluble, chromatin, and total cell extracts fractions were used for immunoblotting. Data are representative of n = 3 independent experiments. (E) RNF12 knock-out (Rlim−/y) mESCs transfected with HA-tagged mouse RNF12WT (1–600), RNF121−205 (N-term), and RNF12(326–423) (basic region) were analysed by immunofluorescence. HA-RNF12 was detected by anti-HA antibody, Hoechst is used as a nuclear stain. Scale bar = 5 μm. Data are representative of n = 3 independent experiments. (F) Control (Rlim+/y), RNF12 knock-out (Rlim−/y), and RNF12/REX1 double knock-out (Rlim−/y; Zfp42−/−) mESCs expressing HA-tagged mouse RNF12WT, RNF12ΔN, and RNF12ΔBR were subjected to chromatin fractionation and HA-RNF12, REX1, tubulin β-3 (TUBβ3), and phospho-Ser10 Histone H3 (pH3) levels determined by immunoblotting. Data are representative of n = 3 independent experiments. (G) Graph representing the percentage of HA-RNF12 signal observed in (F) in soluble and chromatin fractions. Data represented as mean ± SEM (n = 3). Source data are available for this figure.
Figure 5.
Figure 5.. RNF12 chromatin recruitment and substrate ubiquitylation are mediated by the basic region (BR).
(A) Schematic representation of mouse RNF12 BR, BR1, BR2, and BR3 deletions. (B) RNF12 knock-out (Rlim−/y) mouse embryonic stem cells (mESCs) expressing either empty vector (control), HA-tagged mouse RNF12WT, or RNF12 BR deletions were subjected to chromatin fractionation. HA-RNF12, REX1, βIII-tubulin (TUBβ3), and phospho-Ser10 Histone H3 (pH3) levels were determined by immunoblotting. Data are representative of n = 5 independent experiments. (C) Quantification of HA-RNF12 protein levels observed in the chromatin fraction in (B) expressed relative to RNF12WT. Data represented as mean ± SEM (n = 5). Statistical significance was determined by paired t test; two-sided, confidence level 95%. (D) In vitro REX1 substrate ubiquitylation assay of RNF12WT and RNF12 BR deletions. Top: fluorescently labelled ubiquitylated proteins were detected by 680 nm scan (Cy5-Ub). Ubiquitylated REX1 (REX1-Ubn) and RNF12 (RNF12-Ubn) signals are indicated. Bottom: immunoblot analysis of RNF12 (using anti-RNF12 mouse monoclonal antibody) and REX1 protein levels. Data are representative of n = 4 independent experiments. (E) REX1 ubiquitylation was quantified and normalized to total REX1. (D) The first three REX1 ubiquitylated bands (REX1-Ub3), indicated by asterisks in (D), were identified by comparison with control lacking REX1 substrate and quantified. Background correction was not applied because RNF12 preferentially ubiquitylates REX1, but in the absence of REX1 performs auto-ubiquitylation and/or forms free ubiquitin chains, creating variability in the control signal. Data represented as mean ± SEM (n = 4). Statistical significance was determined by paired t test; two-sided, confidence level 95%. (F) RNF12/REX1 double knock-out (Rlim−/y; Zfp42−/−) mESCs expressing FLAG-REX1 with either empty vector (control), HA-tagged mouse RNF12WT, or the indicated HA-RNF12 deletion mutants were treated with MG132 for 2 h and HA-RNF12 immunoprecipitated. HA-RNF12 and FLAG-REX1 levels are determined by immunoblotting. Ponceau S staining is shown as a loading control. Data are representative of n = 4 independent experiments. (G) RNF12 knock-out (Rlim−/y) mESCs expressing either empty vector (control), HA-tagged mouse RNF12WT, or HA-RNF12 BR deletions were treated with either DMSO (vehicle control) or MG132 for 1 h and subjected to chromatin fractionation. HA-RNF12, βIII-tubulin (TUBβ3), and phospho-Ser10 Histone H3 (pH3) levels were determined by immunoblotting. Data are representative of n = 4 independent experiments. (H) REX1 ubiquitylation in the chromatin fraction of MG132-treated mESCs from (G) was quantified by determining relative average intensity of the fourth ubiquitylated band (REX1-Ub4; indicated by an asterisk in (G) and normalizing to total REX1 levels. REX1 ubiquitylation is expressed relative to RNF12WT. Data represented as mean ± SEM (n = 4). Statistical significance was determined by paired t test; two-sided, confidence level 95%. (I) RNF12 knock-out (Rlim−/y) mESCs expressing HA-tagged mouse RNF12WT or HA-RNF12 BR deletions were treated with 350 μM cycloheximide (CHX) for the indicated times. HA-RNF12 and REX1 levels were determined by immunoblotting. Ponceau S staining is shown as a loading control. Data are representative of n = 4 independent experiments. (J) Quantification of data from (I) representing normalized HA-RNF12 and REX1 protein levels relative to control (0). Data represented as mean ± SEM (n = 4). Statistical significance of each deletion mutant compared with HA-RNF12WT was determined at 2 h for HA-RNF12 and at 4 h for REX1 by paired t test; two-sided, confidence level 95%. HA-RNF12: RNF12ΔBR (**) P = 0.0026, RNF12ΔBR1 (ns) P = 0.6554, RNF12ΔBR2 (*) P = 0.0393, and RNF12ΔBR3 (*) P = 0.0186. REX1: RNF12ΔBR (*) P = 0.0322, RNF12ΔBR1 (ns) P = 0.7590, RNF12ΔBR2 (**) P = 0.0050, and RNF12ΔBR3 (ns) P = 0.2781. Source data are available for this figure.
Figure 6.
Figure 6.. RNF12/RLIM N-terminal region inhibits chromatin recruitment and substrate ubiquitylation.
(A) Schematic representation of mouse RNF12 N-terminal deletions (ΔN, ΔN1, ΔN2, ΔN3). (B) RNF12 knock-out (Rlim−/y) mouse embryonic stem cells (mESCs) expressing HA-tagged mouse RNF12WT and N-terminal deletions were subjected to chromatin fractionation. HA-RNF12, βIII-tubulin (TUBβ3), and phospho-Ser10 Histone H3 (pH3) levels were determined by immunoblotting. Data are representative of n = 5 independent experiments. (C) Quantification of HA-RNF12 protein levels observed in the chromatin fraction in (B) expressed relative to RNF12WT. Data represented as mean ± SEM (n = 5). Statistical significance was determined by paired t test; two-sided, confidence level 95%. (D) RNF12 knock-out (Rlim−/y) mESCs expressing HA-tagged mouse RNF12WT and N-terminal deletions were treated with MG132 for 1 h and subjected to chromatin fractionation. REX1, HA-RNF12, and phospho-Ser10 Histone H3 (pH3) levels were determined by immunoblotting. Data are representative of n = 4 independent experiments. (E) REX1 ubiquitylation in the chromatin fraction of MG132-treated mESCs from (D) was quantified by determining relative average intensity of the fourth ubiquitylated band (REX1-Ub4; indicated by an asterisk in (D)) and normalizing to total REX1 levels. REX1 ubiquitylation is expressed relative to RNF12WT. Data represented as mean ± SEM (n = 4). Statistical significance was determined by paired t test; two-sided, confidence level 95%. (F) In vitro REX1 ubiquitylation assay containing increasing amounts of mRNF12WT and mRNF12ΔN. Top: fluorescently labelled ubiquitylated proteins were detected by 680 nm scan (Cy5-Ub). Specific ubiquitylated REX1 (REX1-Ubn) and RNF12 (RNF12-Ubn) signals are indicated. Bottom: immunoblot analysis of RNF12 (using anti-RNF12 mouse monoclonal antibody) and REX1 protein levels. Data are representative of n = 5 independent experiments. (G) REX1 ubiquitylation was quantified and normalized to total REX1. The first two REX1 ubiquitylated bands (REX1-Ub2; indicated by asterisks in (F)) were identified by comparison with control lacking REX1 substrate and quantified. Background correction was not applied because RNF12 preferentially ubiquitylates REX1 but, in the absence of REX1, performs auto-ubiquitylation and/or forms free ubiquitin chains, creating variability in the control signal. Data represented as mean ± SEM (n = 4). Statistical significance was determined by paired t test; two-sided, confidence level 95%. (H) RNF12 knock-out (Rlim−/y) mESCs expressing either empty vector (control), HA-tagged mouse RNF12WT, or RNF12ΔN were treated with 350 μM cycloheximide (CHX) for the indicated times. HA-RNF12 and REX1 levels were determined by immunoblotting. Ponceau S staining is shown as a loading control. Data are representative of n = 5 independent experiments. (I) Quantification of normalized REX1 levels from (H) relative to control (0). Data represented as mean ± SEM (n = 5). Statistical significance of REX1 stability in Rlim−/y mESCs expressing HA-RNF12 N-terminal deletion compared with those expressing HA-RNF12WT was determined at 2 h by paired t test; two-sided, confidence level 95%. Source data are available for this figure.
Figure 7.
Figure 7.. RNF12 chromatin recruitment is required for target gene transcription.
(A) Rlim+/y mouse embryonic stem cells (mESCs) expressing HA-tagged mouse RNF12WT, RNF12ΔBR, RNF12W576Y, and RNF12ΔBR2 and differentiated for 72 h. Xist RNA levels were normalized to Gapdh and represented as fold-change relative to RNF12WT. Data represented as mean ± SEM (n = 5). Statistical significance was determined by paired t test; two-sided, confidence level 95%. (B) Rlim+/y mouse embryonic stem cells expressing HA-tagged mouse RNF12WT, HA-RNF12ΔBR, HA-RNF12W576Y, and HA-RNF12ΔBR2 were lysed, and total RNF12, HA-RNF12, and REX1 levels determined by immunoblotting. Ponceau staining is shown as a control. Data are representative of n = 5 independent experiments. (C) Model for how chromatin functions as an RNF12 regulatory platform. N-term = RNF12 N-terminal sequences. RNF12 recruitment to chromatin is mediated by the RNF12 BR, which is required for efficient REX1 ubiquitylation and regulation of RNF12-dependent genes. In an opposing manner, RNF12 N-terminal sequences supress chromatin recruitment and substrate ubiquitylation, conferring a previously unappreciated autoinhibitory mechanism. Note that the RNF12 BR is also involved in direct regulation of catalytic activity. Source data are available for this figure.
Figure S3.
Figure S3.. Alphafold model of human RNF12 structure.
Model generated by Alphafold DB (https://alphafold.ebi.ac.uk). Per-residue model confidence score (pLDDT) is indicated. The predicted RNF12 RING domain, basic region, N-terminal region, and the predicted interface between the basic region and N-terminal region are labelled.

Similar articles

Cited by

References

    1. Bailey TL, Johnson J, Grant CE, Noble WS (2015) The MEME suite. Nucleic Acids Res 43: W39–W49. 10.1093/nar/gkv416 - DOI - PMC - PubMed
    1. Ballabeni A, Melixetian M, Zamponi R, Masiero L, Marinoni F, Helin K (2004) Human geminin promotes pre‐RC formation and DNA replication by stabilizing CDT1 in mitosis. EMBO J 23: 3122–3132. 10.1038/sj.emboj.7600314 - DOI - PMC - PubMed
    1. Barakat TS, Gunhanlar N, Pardo CG, Achame EM, Ghazvini M, Boers R, Kenter A, Rentmeester E, Grootegoed JA, Gribnau J (2011) RNF12 activates Xist and is essential for X chromosome inactivation. PLoS Genet 7: e1002001. 10.1371/journal.pgen.1002001 - DOI - PMC - PubMed
    1. Bhoj VG, Chen ZJ (2009) Ubiquitylation in innate and adaptive immunity. Nature 458: 430–437. 10.1038/nature07959 - DOI - PubMed
    1. Branon TC, Bosch JA, Sanchez AD, Udeshi ND, Svinkina T, Carr SA, Feldman JL, Perrimon N, Ting AY (2018) Efficient proximity labeling in living cells and organisms with TurboID. Nat Biotechnol 36: 880–887. 10.1038/nbt.4201 - DOI - PMC - PubMed

Publication types