. 2024 Jan 10;15(1):26.
doi: 10.1038/s41419-024-06427-w.

TRIM22 induces cellular senescence by targeting PHLPP2 in hepatocellular carcinoma

Affiliations

TRIM22 induces cellular senescence by targeting PHLPP2 in hepatocellular carcinoma

Donghee Kang et al. Cell Death Dis. .

Abstract

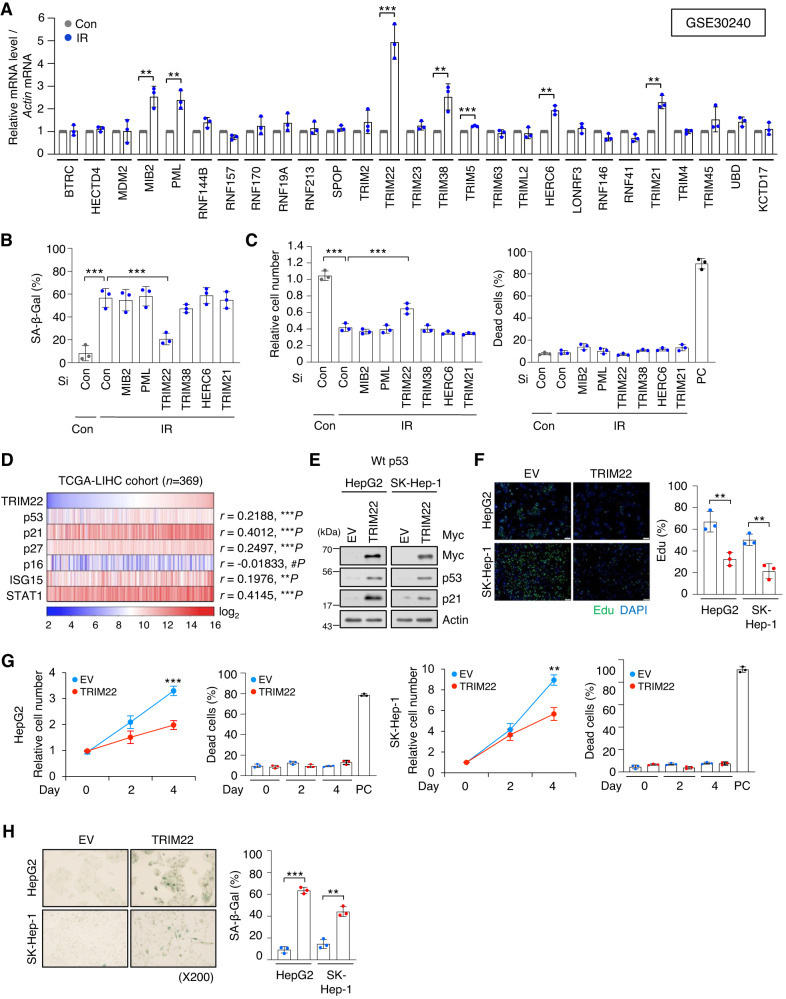
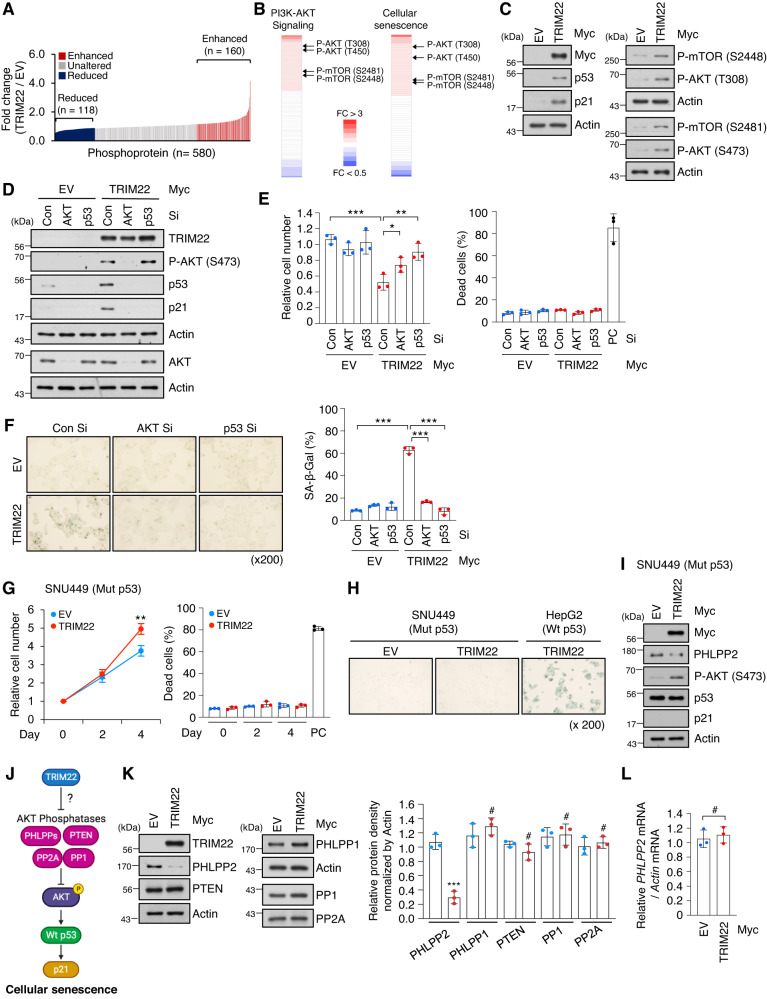
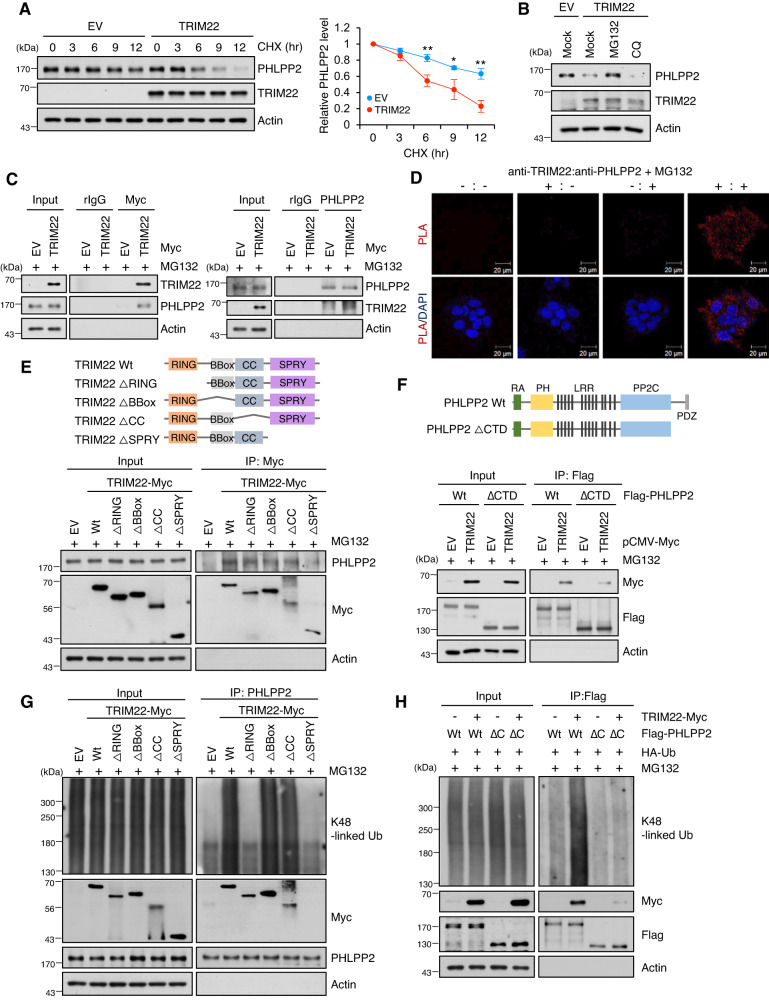
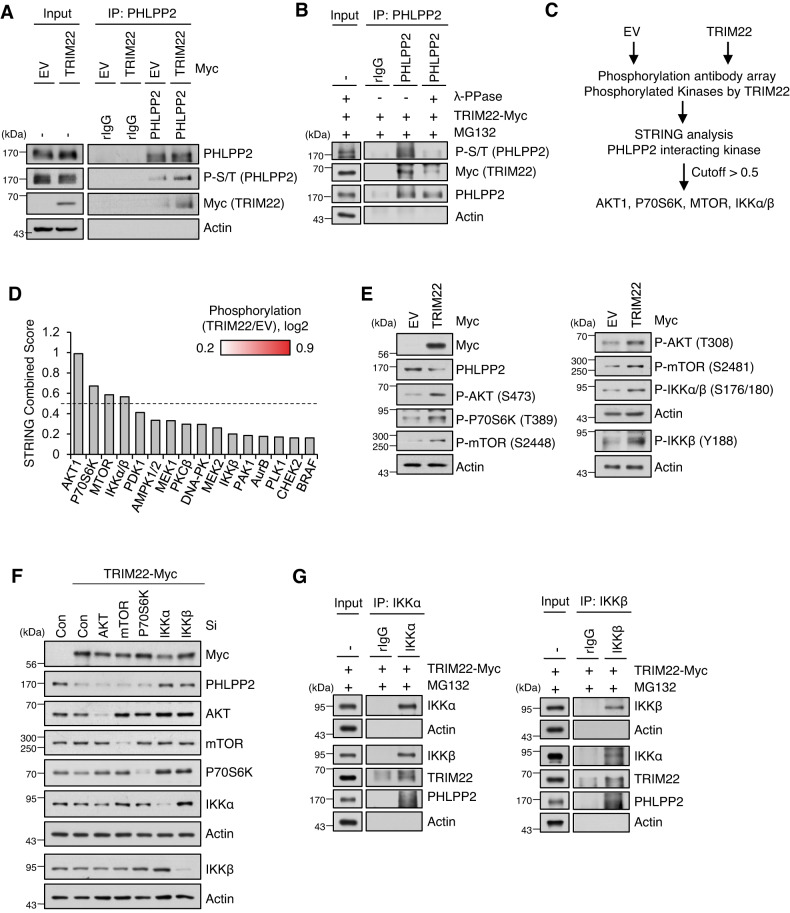
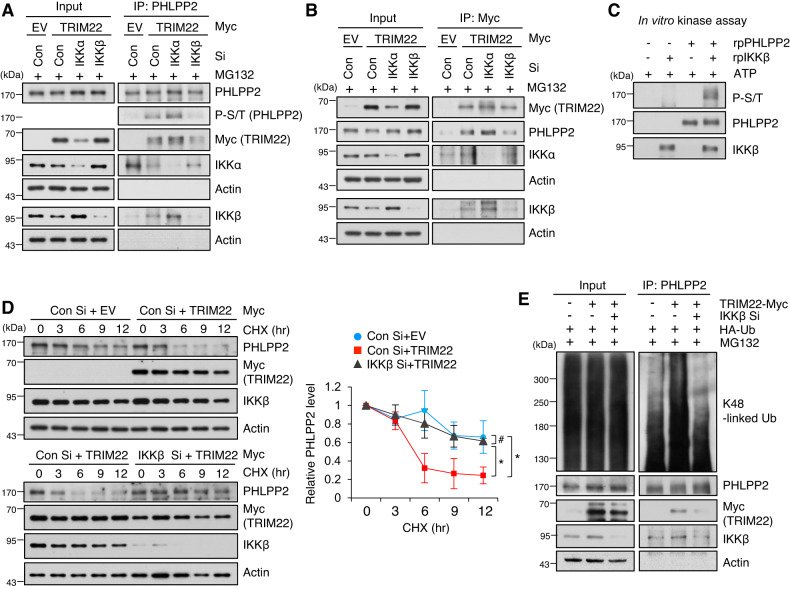
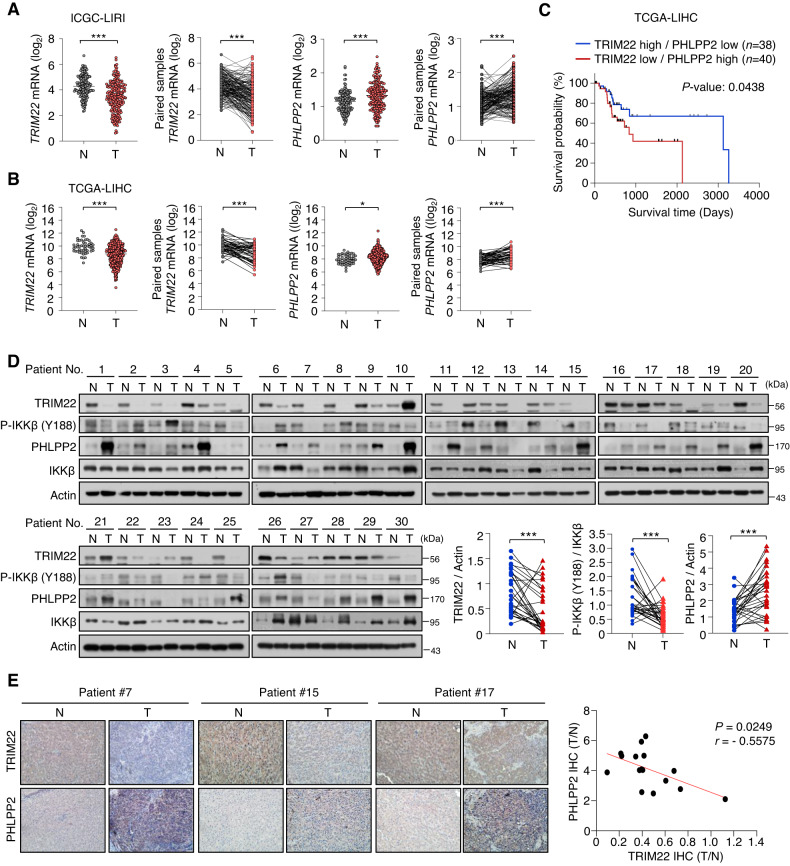
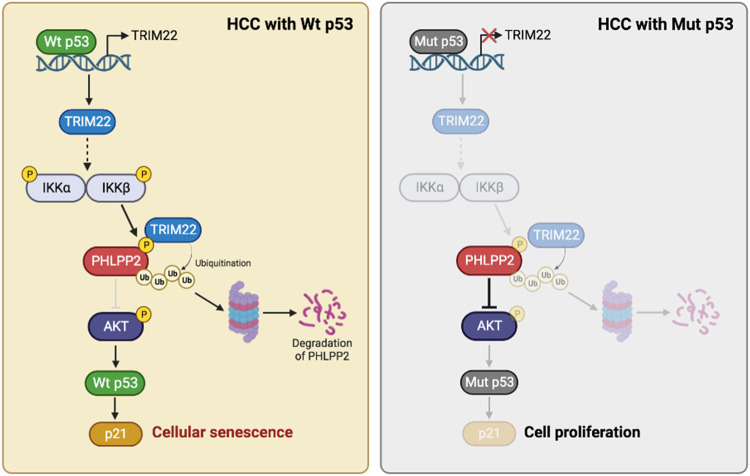
The ubiquitin-proteasome system is a vital protein degradation system that is involved in various cellular processes, such as cell cycle progression, apoptosis, and differentiation. Dysregulation of this system has been implicated in numerous diseases, including cancer, vascular disease, and neurodegenerative disorders. Induction of cellular senescence in hepatocellular carcinoma (HCC) is a potential anticancer strategy, but the precise role of the ubiquitin-proteasome system in cellular senescence remains unclear. In this study, we show that the E3 ubiquitin ligase, TRIM22, plays a critical role in the cellular senescence of HCC cells. TRIM22 expression is transcriptionally upregulated by p53 in HCC cells experiencing ionizing radiation (IR)-induced senescence. Overexpression of TRIM22 triggers cellular senescence by targeting the AKT phosphatase, PHLPP2. Mechanistically, the SPRY domain of TRIM22 directly associates with the C-terminal domain of PHLPP2, which contains phosphorylation sites that are subject to IKKβ-mediated phosphorylation. The TRIM22-mediated PHLPP2 degradation leads to activation of AKT-p53-p21 signaling, ultimately resulting in cellular senescence. In both human HCC databases and patient specimens, the levels of TRIM22 and PHLPP2 show inverse correlations at the mRNA and protein levels. Collectively, our findings reveal that TRIM22 regulates cancer cell senescence by modulating the proteasomal degradation of PHLPP2 in HCC cells, suggesting that TRIM22 could potentially serve as a therapeutic target for treating cancer.


Conflict of interest statement

The authors declare no competing interests.

Figures

Fig. 1
Fig. 1. Upregulation of TRIM22 induces cellular senescence in HCC.
A RT-qPCR of an expression profiling array (GSE30240) for IR-treated HepG2 cells. Data are presented as mean ± SD (unpaired two-tailed t-test, MIB2: **P = 0.0044, t = 5.805; PML: **P = 0.0042, t = 5.874; TRIM22: ***P = 0.0008, t = 8.990; TRIM38: **P = 0.01, t = 4.606; TRIM5: ***P = 0.0001, t = 14.34; HERC6: **P = 0.0013, t = 8.116; TRIM21: **P = 0.0016, t = 7.667; n = 3). B, C HepG2 cells were transfected with specific siRNA against each E3 ligase candidate in HepG2 cells. SA-β-Gal assay (B) (one-way ANOVA with Tukey’s multiple comparison test, F(7,16) = 21.96, ***P < 0.0001; ***P = 0.0003, n = 3) and cell counting (C) were performed. Data are presented as mean ± SD (one-way ANOVA with Tukey’s multiple comparison test, F(7,16) = 92.09, ***P < 0.0001; ***P = 0.0002, n = 3). Positive control (PC) for dead cells, Doxorubicin 2 μg/mL. D Gene expression analysis of TRIM22 and senescence-associated genes in the TCGA-LIHC database (Pearson correlation, n = 369). EH Western blotting (E), Edu incorporation assay. Scale bars, 100 μm (F) Data are presented as mean ± SD (unpaired two-tailed t-test, HepG2: **P = 0.0059, t = 5.352, n = 3; SK-Hep-1: **P = 0.0046, t = 5.724, n = 3), cell counting (G) Data are presented as mean ± SD (unpaired two-tailed t-test, HepG2: ***P = 0.0008, t = 9.097, n = 3; SK-Hep-1: **P = 0.0020, t = 7.168, n = 3), and SA-β-Gal assay (H) Data are presented as mean ± SD (unpaired two-tailed t-test, HepG2: ***P < 0.0001, t = 23.00, n = 3; SK-Hep-1: **P = 0.0012, t = 8.265, n = 3) were performed in TRIM22-overexpressing HepG2 and SK-Hep-1 HCC cells.
Fig. 2
Fig. 2. TRIM22 activates AKT-p53-p21 signaling by reducing the PHLPP2 protein level.
A Phosphoprotein array analysis showing the fold change of phosphoproteins upon TRIM22 overexpression in HepG2 cells. The level of each phosphoprotein was normalized to the total protein level; those above 1.2-fold (160 proteins) and below 0.8-fold (118 proteins) were labeled in red and blue, respectively. B Heatmaps representing the phosphorylation sites of proteins enriched in PI3K/AKT signaling or cellular senescence. C Western blot analysis of HepG2 cells transfected with empty vector (EV) or TRIM22-expressing vector, as generated using the indicated antibodies. DF HepG2 cells were transfected with Con Si, AKT Si, or p53 Si, and then transfected with EV or TRIM22-expressing vector. Western blotting (D), relative cell number (E) Data are presented as mean ± SD (one-way ANOVA with Tukey’s multiple comparison test, F(5,12) = 16.37, ***P < 0.0001; *P = 0.0314; **P = 0.0015, n = 3), and SA-β-Gal positivity (F) Data are presented as mean ± SD (one-way ANOVA with Tukey’s multiple comparison test, F(5,12) = 130.2, ***P < 0.0001; ***P < 0.0001; ***P < 0.0001, n = 3) were analyzed. Positive control (PC) for dead cells, Doxorubicin 2 μg/mL. GI SNU449 HCC cells (Mut p53) were transfected with EV or TRIM22-expressing vector. Cell counting (G) Data are presented as mean ± SD (unpaired two-tailed t-test, **P = 0.0072, t = 5.066, n = 3), SA-β-Gal staining (H), and Western blotting (I) were performed. PC for dead cells, Doxorubicin 2 μg/mL. J Schematic representation of possible means by which TRIM22 induces cellular senescence through the AKT-p53-p21 pathway. K Western blot analysis of TRIM22-overexpressed HepG2 cells using the indicated antibodies (left). Phosphatase levels were quantified from protein bands and are presented as mean values of the ratio relative to the levels in EV-transfected HepG2 cells (right). Actin was used as an endogenous control for protein level normalization. Data are presented as mean ± SD (unpaired two-tailed t-test, PHLPP2: ***P = 0.0006, t = 9.806, n = 3; PHLPP1: #P = 0.3344, t = 1.097, n = 3; PTEN: #P = 0.1780, t = 1.632, n = 3; PP1: #P = 0.8012, t = 0.2690, n = 3; PP2A: #P = 0.5672, t = 0.6227, n = 3). L RT-qPCR of PHLPP2 mRNA in TRIM22-overexpressed HepG2 cells. Data are presented as mean ± SD (unpaired two-tailed t-test, #P = 0.6045, t = 0.5613, n = 3).
Fig. 3
Fig. 3. TRIM22 directly binds to PHLPP2 and induces its ubiquitin-mediated degradation.
A Analysis of PHLPP2 protein stability by Western blotting. TRIM22-overexpressed HepG2 cells were treated with cycloheximide (CHX) for the indicated times, harvested, and analyzed by Western blotting. Data are presented as mean ± SD (unpaired two-tailed t-test, **P = 0.0047, t = 5.708; *P = 0.0208, t = 3.700; **P = 0.0021, t = 7.040, n = 3). B Western blotting analysis of TRIM22-overexpressed HepG2 cells treated with the proteasomal degradation inhibitor, MG132, or the lysosomal inhibitor, CQ. C Co-immunoprecipitation (Co-IP) assays for the interaction between TRIM22 and PHLPP2. HepG2 cells were transfected with EV or TRIM22-Myc and then treated with 20 μM MG132 for 4 hrs. The cells were subjected to IP using anti-Myc (left) or anti-PHLPP2 (right) antibodies. Immunoprecipitates were analyzed by Western blotting using the indicated antibodies. D Proximity ligation assay (PLA) for cytoplasmic interaction between TRIM22 and PHLPP2 using each antibody. TRIM22-Myc-overexpressing HepG2 cells were treated with 20 μM MG132 for 4 hrs and subjected to PLA. The red spots indicate TRIM22-PHLPP2 interactions. Nuclei were stained with DAPI. Scale bars, 20 μm. E Schematic showing the domain structures of TRIM22 Wt and Muts (ΔRING, ΔBBox, ΔCC, or ΔSPRY) (Upper). HepG2 cells were transfected with TRIM22 Wt or Muts (ΔRING, ΔBBox, ΔCC, or ΔSPRY). IP was performed and immunoprecipitates were subjected to Western blot analysis. F Schematic showing the domain structures of PHLPP2 Wt and PHLPP2 ΔC-terminal (ΔCTD) (Upper). Flag-tagged PHLPP2 Wt or PHLPP2 ΔCTD was co-transfected with TRIM22 Wt into HepG2 cells. PHLPP2 Wt or PHLPP2 ΔCTD was immunoprecipitated using Flag antibody, and the immunoprecipitates were analyzed using Western blotting (Bottom). G Ubiquitination assays of PHLPP2 in TRIM22 Wt or Muts (ΔRING, ΔBBox, ΔCC, or ΔSPRY)-overexpressed HepG2 cells. H Co-IP and Western blot analysis of PHLPP2 Wt or PHLPP2 ΔCTD K48 ubiquitination in TRIM22 Wt-overexpressed HepG2 cells.
Fig. 4
Fig. 4. PHLPP2 is regulated by IKKα and IKKβ in TRIM22-overexpressed cells.
A IP using anti-PHLPP2 in TRIM22-overexpressed HepG2 cells. Immunoprecipitates were analyzed by Western blotting using the indicated antibodies. B IP was performed using anti-PHLPP2 antibody in TRIM22-overexpressed HepG2 cells. After IP, lysates were treated with λ-PPase and analyzed by Western blotting using the indicated antibodies. C Workflow of strategy used to identify kinase candidates that interact with and phosphorylate PHLPP2. D STRING analysis of PHLPP2-interacting kinases. E Western blot analysis of kinases in TRIM22-overexpressed HepG2 cells. F HepG2 cells were transfected with siRNA targeting each indicated kinase. After 48 hrs, the cells were harvested and analyzed by Western blotting using the indicated antibodies. G IP using anti-IKKα (left) or anti-IKKβ (right) in TRIM22-overexpressed HepG2 cells. Immunoprecipitates were analyzed by Western blotting using the indicated antibodies.
Fig. 5
Fig. 5. Phosphorylation of PHLPP2 by IKKβ facilitates the interaction between PHLPP2 and TRIM22 and promotes the degradation of PHLPP2 by TRIM22.
A, B IP using anti-PHLPP2 (A) or anti-Myc (B) was performed in IKKα- or IKKβ-depleted HepG2 cells following TRIM22 overexpression. Immunoprecipitates were analyzed by Western blotting using the indicated antibodies. C Western blotting of an in vitro kinase assay performed between IKKβ and PHLPP2. D Analysis of PHLPP2 protein stability. Con Si- or IKKβ Si-transfected HepG2 cells were transfected with EV or TRIM22-expressing vector. The cells were treated with cycloheximide (CHX) for the indicated times, harvested, and analyzed by Western blotting. Data are presented as mean ± SD (one-way ANOVA with Tukey’s multiple comparison test, F(14,30) = 14.01, *P = 0.0153; #P > 0.9999; *P = 0.0437, n = 3). E Ubiquitination assay of PHLPP2 in IKKβ-depleted HepG2 cells following TRIM22 overexpression.
Fig. 6
Fig. 6. TRIM22 and PHLPP2 levels are inversely correlated in HCC and paired normal patient tissues.
A, B Comparison of TRIM22 and PHLPP2 mRNA levels in HCC and paired normal tissue samples from ICGC-LIRI database [Normal (N), n = 177; Tumor (T), n = 212. Paired samples, n = 177 (A)] (TRIM22 mRNA: unpaired two-tailed t-test, ***P < 0.0001, t = 8.059; paired two-tailed t-test, ***P < 0.0001, t = 9.223; PHLPP2 mRNA: unpaired two-tailed t-test, ***P < 0.0001, t = 4.756; paired two-tailed t-test, ***P < 0.0001, t = 5.125) and TCGA-LIHC database [N, n = 50; T, n = 369. Paired samples, n = 50 (B)] (TRIM22 mRNA: unpaired two-tailed t-test, ***P < 0.0001, t = 5.485; paired two-tailed t-test, ***P < 0.0001, t = 5.693; PHLPP2 mRNA: unpaired two-tailed t-test, *P = 0.0105, t = 2.572; paired two-tailed t-test, ***P < 0.0001, t = 4.938). C Survival analysis between groups with different levels of TRIM22 and PHLPP2 in the TCGA-LIHC database. D Western blot analysis of TRIM22, P-IKKβ (Y188), and PHLPP2 in HCC and paired normal patient tissues. n = 30. Statistical analysis of the value intensity of TRIM22, PHLPP2, and P-IKKβ (Y188) normalized to those of Actin and Total IKKβ in patient tissues (TRIM22: paired two-tailed t-test, ***P = 0.0002, t = 4.206; P-IKKβ: paired two-tailed t-test, ***P = 0.0004, t = 4.003; PHLPP2: paired two-tailed t-test, ***P = 0.0002, t = 4.327). The protein levels were quantified by densitometry using the ImageJ software and normalized to the protein level of Actin or Total IKKβ. E IHC analysis of TRIM22 and PHLPP2 in HCC and paired patient tissues (left). n = 16. Scale bars, 50 μm. Correlation of TRIM22 and PHLPP2 IHC scores (right). r is the Spearman’s rank correlation coefficient.
Fig. 7
Fig. 7. Schematic model proposed according to the findings of the present study.
A proposed model for the function of TRIM22 in the degradation of PHLPP2 and the induction of cellular senescence in HCC cells (created with BioRender.com).

References

    1. Serper M, Taddei TH, Mehta R, D’Addeo K, Dai F, Aytaman A, et al. Association of provider specialty and multidisciplinary care with hepatocellular carcinoma treatment and mortality. Gastroenterology. 2017;152:1954–64. doi: 10.1053/j.gastro.2017.02.040. - DOI - PMC - PubMed
    1. Llovet JM, Kelley RK, Villanueva A, Singal AG, Pikarsky E, Roayaie S, et al. Hepatocellular carcinoma. Nat Rev Dis Primers. 2021;7:6. doi: 10.1038/s41572-020-00240-3. - DOI - PubMed
    1. Ma S, Jiao B, Liu X, Yi H, Kong D, Gao L, et al. Approach to radiation therapy in hepatocellular carcinoma. Cancer Treat Rev. 2010;36:157–63. doi: 10.1016/j.ctrv.2009.11.008. - DOI - PubMed
    1. Ohri N, Dawson LA, Krishnan S, Seong J, Cheng JC, Sarin SK, et al. Radiotherapy for hepatocellular carcinoma: new indications and directions for future study. J Natl Cancer Inst. 2016;108:djw133. doi: 10.1093/jnci/djw133. - DOI - PMC - PubMed
    1. Peng WX, Wan YY, Gong AH, Ge L, Jin J, Xu M, et al. Egr-1 regulates irradiation-induced autophagy through Atg4B to promote radioresistance in hepatocellular carcinoma cells. Oncogenesis. 2017;6:e292. doi: 10.1038/oncsis.2016.91. - DOI - PMC - PubMed

Publication types

MeSH terms