
The chromatin landscape of healthy and injured cell types in the human kidney

Debora L Gisch et al. Nat Commun. .

Abstract

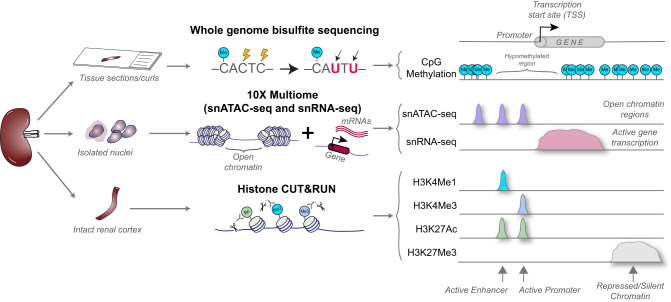
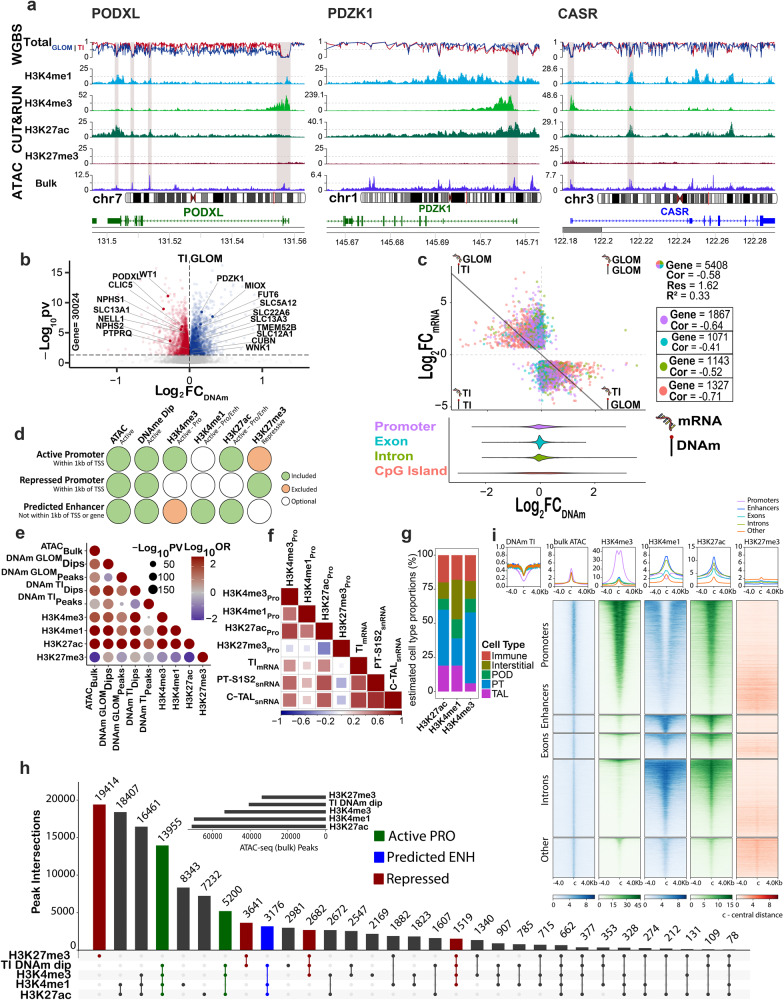
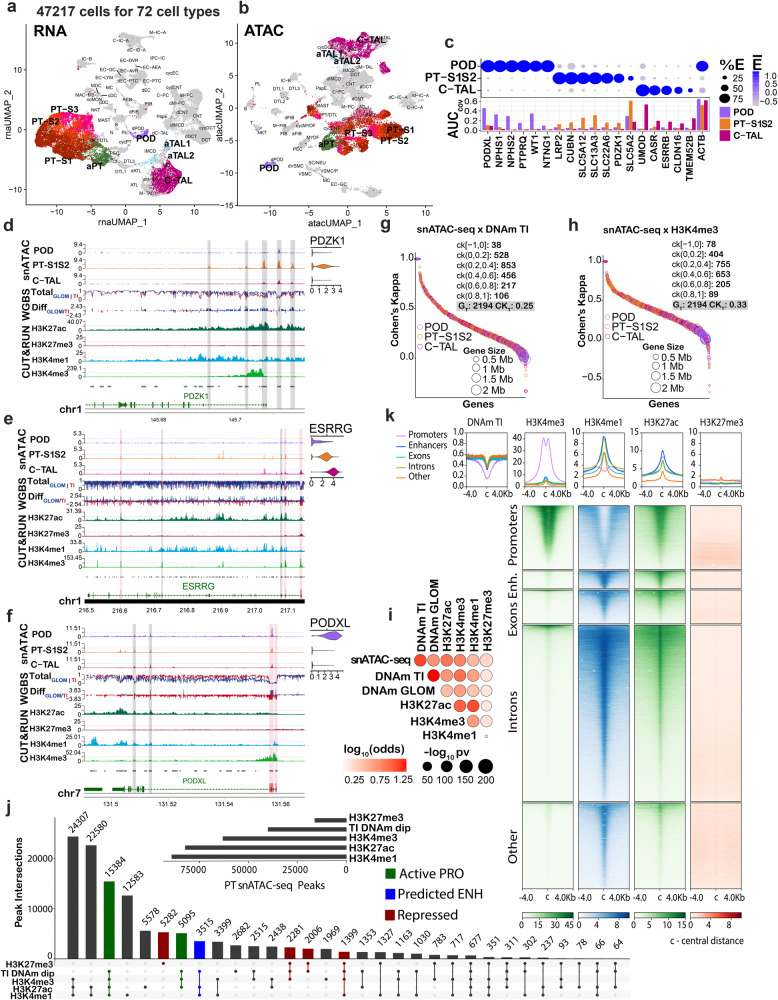
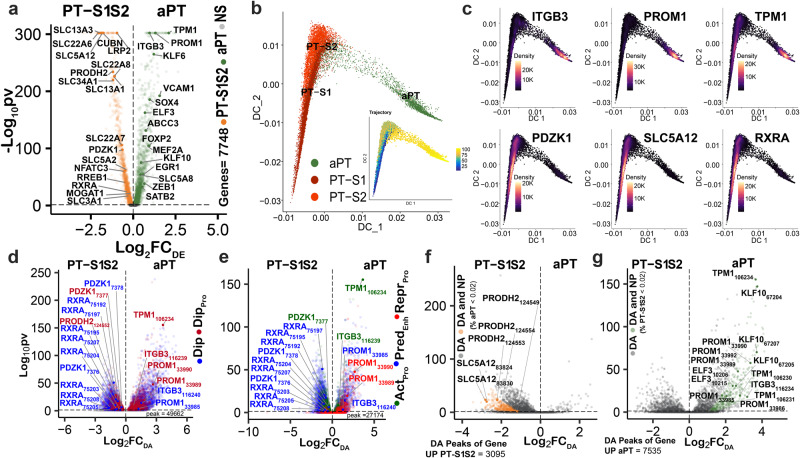
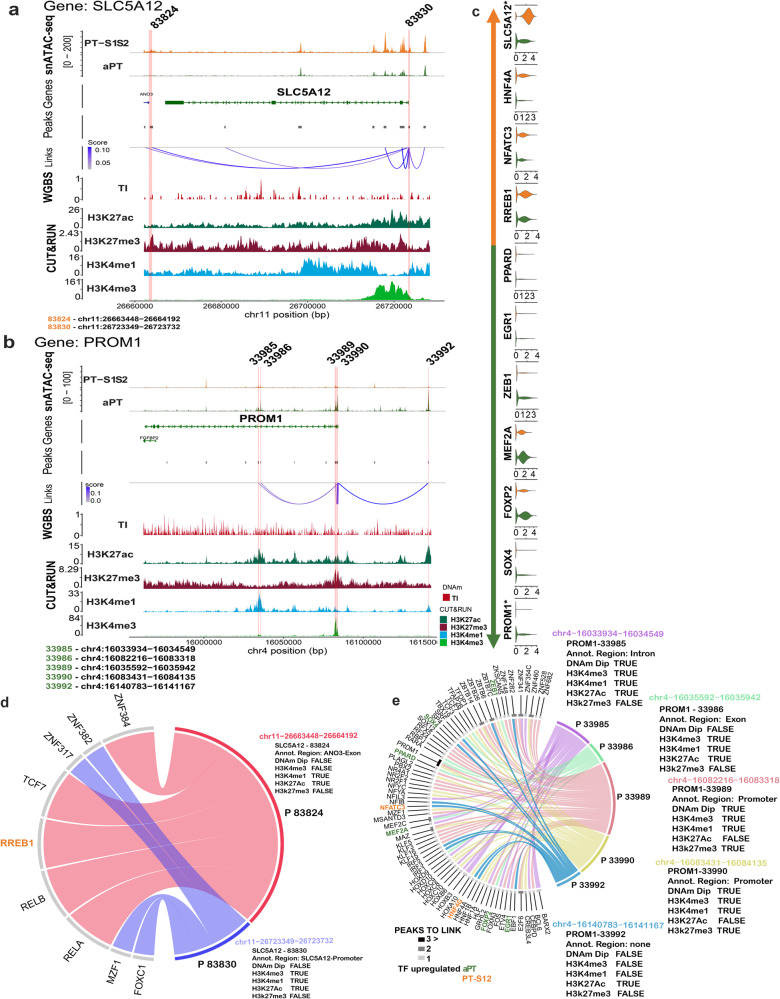
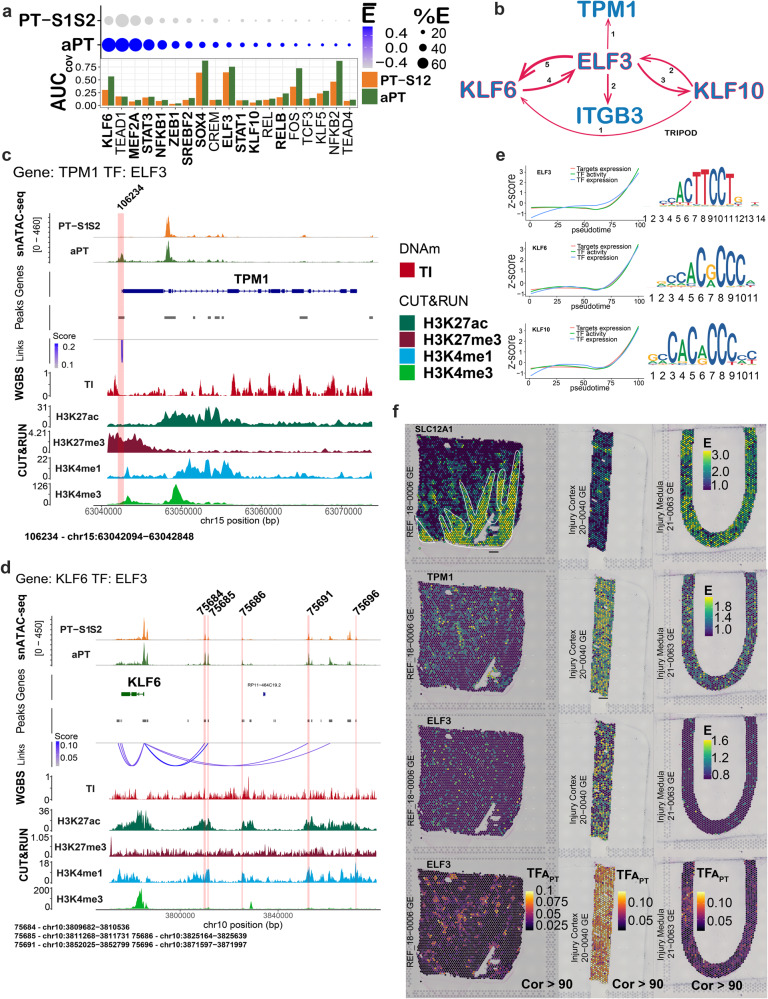
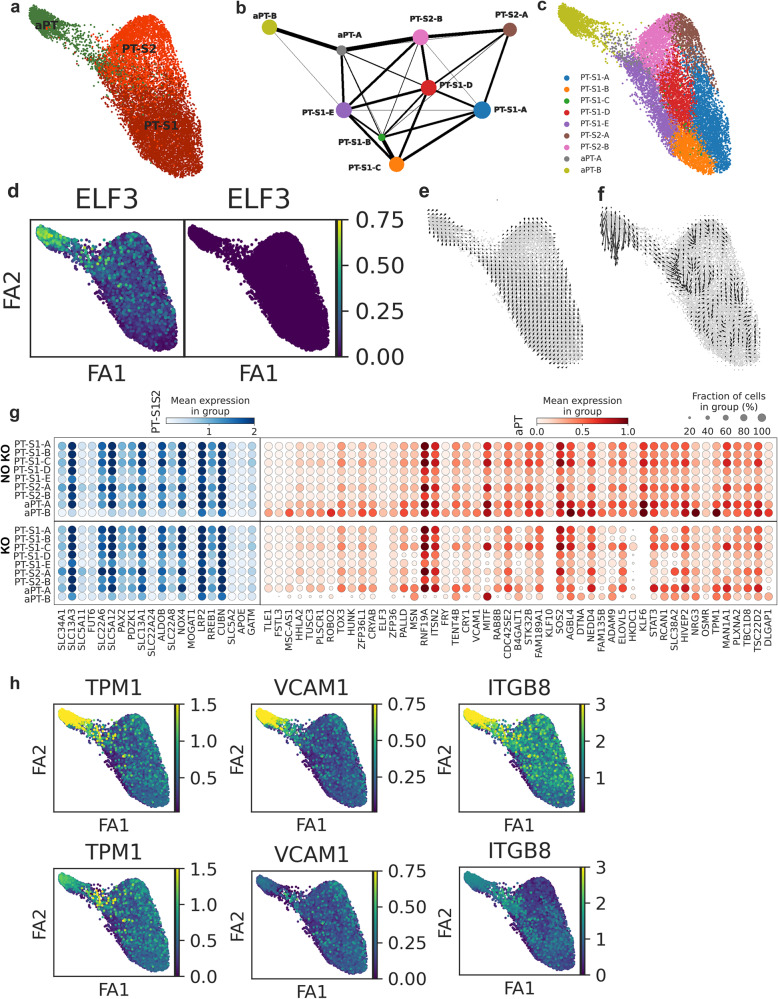
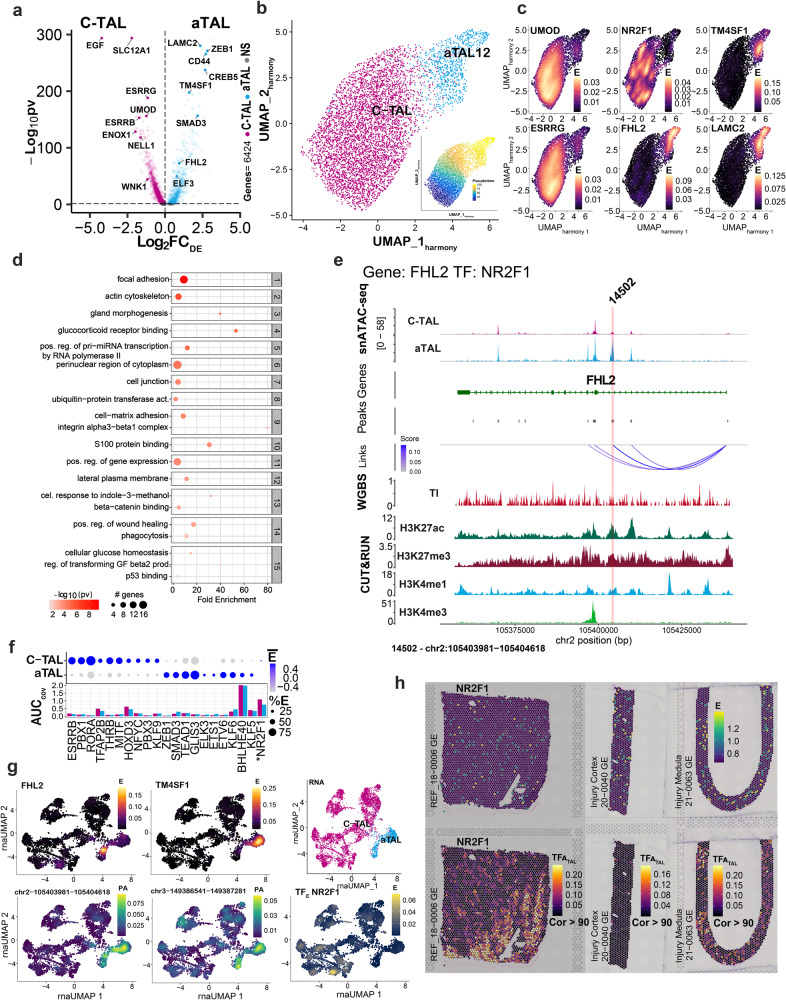
There is a need to define regions of gene activation or repression that control human kidney cells in states of health, injury, and repair to understand the molecular pathogenesis of kidney disease and design therapeutic strategies. Comprehensive integration of gene expression with epigenetic features that define regulatory elements remains a significant challenge. We measure dual single nucleus RNA expression and chromatin accessibility, DNA methylation, and H3K27ac, H3K4me1, H3K4me3, and H3K27me3 histone modifications to decipher the chromatin landscape and gene regulation of the kidney in reference and adaptive injury states. We establish a spatially-anchored epigenomic atlas to define the kidney's active, silent, and regulatory accessible chromatin regions across the genome. Using this atlas, we note distinct control of adaptive injury in different epithelial cell types. A proximal tubule cell transcription factor network of ELF3, KLF6, and KLF10 regulates the transition between health and injury, while in thick ascending limb cells this transition is regulated by NR2F1. Further, combined perturbation of ELF3, KLF6, and KLF10 distinguishes two adaptive proximal tubular cell subtypes, one of which manifested a repair trajectory after knockout. This atlas will serve as a foundation to facilitate targeted cell-specific therapeutics by reprogramming gene regulatory networks.


Conflict of interest statement

The authors declare no competing interests.

Figures

Fig. 1
Fig. 1. Study workflow.
In an overlapping set of kidney samples, tissue was interrogated by laser microdissection-guided whole genome bisulfite sequencing (WGBS), by multiome single nucleus Assay for Transposase-Accessible Chromatin for sequencing (snATAC-seq) and single nucleus RNA sequencing (snRNAseq) after cell disaggregation, and by Cleavage Under Targets & Release Using Nuclease (CUT&RUN) of kidney cortex. Datasets were aligned in the human genome 38 to create an integrated epigenomic atlas.
Fig. 2
Fig. 2. Alignment of epigenomic features in bulk and regional human kidney samples.
a Epigenomic features of marker genes for glomerulus (PODXL), proximal tubule (PT-S12, PDZK1), and thick ascending loop of Henle (C-TAL, CASR), displaying: (1) DNA methylation (DNAm) in the tubulointerstitium (TI) (N = 15) and glomerulus (GLOM) (N = 15), (2) bulk CUT&RUN for four histone modifications: H3K27ac (N = 6), H3K27me3 (N = 10), H3K4me1 (N = 3), H3K4me3 (N = 3), and (3) assay for transposase-accessible chromatin using sequencing (ATAC-seq) on bulk tissue (Encode ENCSR297VGU) (N = 1). Gray stripes indicate active promoters wherein ATAC-seq peaks at transcriptional start sites coincide with DNAm dips, and H3K4me3 peaks. Variable H3K27ac peaks reflect compartments’ proportion within bulk tissue. b Differential methylation between GLOM and TI kidney compartments for summative methylation of 30,024 gene bodies P value < 0.05 by t test. c Best-fit regression model of methylation and mRNA expression in identical samples (N = 22) for differentially expressed genes (N = 5408) between the GLOM and TI. Each dot represents a gene. Y axis is the Log2 fold change of mRNA between the GLOM and TI. X axis is the Log2 fold change of methylation between the GLOM and TI. The best-fit annotated gene region (summative promoter, exon, intron, of CpG island methylation) with the most negative correlation was identified as the promoter for 1867 genes and CpG island for 1327 genes. The inset represents methylation fold change distribution in annotated gene regions. d Genomic region annotation criteria based on epigenetic landscape. e Landscape correlation agreement between datasets (Fisher’s exact test two sides). f Histone markers and spearman correlation with snRNAseq expression in the PT-S12 and C-TAL and in the regional mRNA expression of the microdissected TI. g Cell type deconvolution of CUT&RUN for H3K27ac, H3K4me1, H3K4me3 active histone modifications at promoters. The RNA signature was taken from the HuBMAP/KPMP atlas snRNAseq (N = 36), using the 10% most DE marker genes. h Upset plot depicting overlap in peaks of H3K27ac, H3K4me1, H3K4me3, and H3K27me3 with DNAm dips across the genome. Active promoters, predicted enhancers, and repressed regions are annotated. i Heatmap of CUT&RUN marks across the genome by annotated region after filtering for open chromatin and DNA methylation dips. The figure uses a licensed stock image adapted from Adobe Illustrator (Eadon et al. - stock.adobe.com).
Fig. 3
Fig. 3. Single-cell epigenomics in health.
The multiome reduction by uniform manifold approximation and projection (UMAP) of 47,217 nuclei in 72 clusters and 12 samples aligning with the HuBMAP/KPMP atlas is depicted for a snRNA-seq and b snATAC-seq assays. Highlighted clusters include podocytes (POD), proximal tubule (PT) S1, S2, S3 and adaptive PT (aPT), cortical thick ascending loop of Henle (C-TAL), and adaptive TAL (aTAL1 and aTAL2) cells. c Gene markers for POD, PT-S1 merged with S2 (PT-S12), and C-TAL reveal cell type specificity of expression and chromatin accessibility. Dot plot (top) reveals transcript expression. Bar graph (bottom) represents the area under the curve (AUC) for open chromatin coverage summed across the entire gene. Genes d PDZK1, e ESRRG, and f PODXL align across the snATAC-seq, WGBS, and CUT&RUN technologies. snATAC-seq peaks are displayed in tracks 1–3 with respective RNA expression (N = 12) in adjacent violin plots. DNAm levels (track 4) and differential DNAm (track 5) are depicted for the GLOM (N = 15, blue) and TI (N = 15, red). Histone marks for CUT&RUN are found in track 6–9: H3K27ac (N = 10), H3K27me3 (N = 6), H3K4me1 (N = 3) and H3K4me3 (N = 3), respectively. Aggregate open chromatin regions (track 10), and chromosome coordinates are below. Differentially accessible open chromatin peaks are annotated as red stripes (coincides with CpG island) or gray (no CpG island). Cohen’s Kappa (CK) agreement between snATAC-seq peaks with DNAm dips (g) or H3K4me3 peaks (h) in the 2194 differentially expressed genes of POD, PT-S12, and C-TAL. Perfect agreement (disagreement) is 1 (−1), ranging from CK [0,0.2] for no agreement to CK [0.8,1] for perfect agreement. Average CK across all genes: GT. Most peaks positively correlated between technologies. Smaller genes have stronger correlation. i Association of DNAm & histone marks with open chromatin. The correlation of open chromatin peaks with DNAm dips, and histone mark peaks is given for differentially expressed genes of the POD, PT-S12, and C-TAL (Fisher’s Exact test two sides). j Upset plot shows the intersection of CUT&RUN peaks and DNAm dips across snATAC-seq PT-S12/aPT peaks, identifying regulatory regions for PT. k Heatmap of CUT&RUN marks in PT-S12/aPT in each annotated region after filtering for open chromatin and DNAm dips.
Fig. 4
Fig. 4. Adaptive cell state in the proximal tubule.
a Differentially expressed genes (DEGs) between the PT-S12 and aPT cell types within the multiome atlas (N = 12), 4194 genes with Bonferroni-adjusted P value < 0.05 (Wilcox test). b Diffusion map of PT-S1, PT-S2 and aPT with 13,241 nuclei. The inset shows the pseudotime trajectory from PT to aPT. c Gene expression localization in aPT cells (ITGB3, PROM1, TPM1) for aPT marker genes. Canonical PT markers (PDZK1, SLC5A12, and RXRA) localize to the PT-S12. d Differentially accessible (DA) peaks N = 10,506, Bonferroni-adjusted P value < 0.05 (LR test) between the PT-S12 and aPT (from multiome TRIPOD-seurat-aPTxPT-S12 object that coincide with TI DNA methylation (DNAm) dips (N = 15). Red = promoter dip, blue = dip outside promoter. e DA multiome peaks with DNAm dips and a CUT&RUN histone mark peak (N = 22). Active promoter (Actpro) = green, predicted enhancer (Predenh) = blue, repressed promoter (Reppro) = red, N = 6607, Bonferroni-adjusted P value < 0.05 (LR test). f DA peaks (N = 2557) in upregulated DEGs of the PT-S12, targeted by a transcription factor (TF) in TRIPOD analyses. Orange dots represent new peaks (NP) in the PT-S12, where fewer than 2% of aPT nuclei had open chromatin Bonferroni-adjusted P value < 0.05, LR test). Gray dots display DA peaks present in both PT-S12 and aPT. All DA NP were found in PT-S12 cells for DEGs upregulated in the PT-S12. g DA peaks (N = 4573) in upregulated DEGs of the aPT. Green = aPT NP. Gray = DA peak present in both PT-S12 and aPT.
Fig. 5
Fig. 5. New peaks in reference and adaptive cell states.
a, b Gene alignment of SLC5A12, a PT-S12 marker, and PROM1, an aPT marker, across snATAC-seq peaks (N = 12), DNAm TI dips (N = 15), and CUT&RUN histone marks H3K27ac (N = 10), H3K27me3 (N = 6), H3K4me1 (N = 3), and H3K4me3 (N = 3). Red stripe indicates new peaks (NP) with transcription factor (TF) binding. c Differentially expressed TFs of the aPT and PT-S12 which target NP of PROM1 and SLC5A12. d, e Chord diagram of SLC5A12 and PROM1, respectively, with TFs (TRUE = positive binding or DNAm Dip and FALSE = no binding or no DNAm Dip).
Fig. 6
Fig. 6. Regulation of adaptation in the proximal tubule (PT) in the multiome atlas.
a Mean expression and area under the curve (AUC) of summative open chromatin for transcription factors (TF) of the adaptive proximal tubule (aPT) and PT-S1 and S2 (PT-S12) in 12 samples. Bold font indicates expression upregulation in the aPT (negative binomial exact test, p < 0.05 after Bonferroni and average Fold Change >0.25 Supplementary Data 4). b TF network defined by the TRIPOD1 method wherein ELF3, KLF6, and KLF10 cross-regulate each other, and two genes upregulated in the aPT (ITGB3 and TPM1). Edge thickness represents the number of peaks predicted in the interaction. c, d Alignment of epigenomic features in TPM1 and KLF6 for the aPT and PT-S12. Red stripe indicates a peak with predicted TF binding by ELF3. Co-accessibility scores were correlated with gene expression, peak accessibility by Signac, DNAm in the tubulointerstitium (TI), and histone marks. TF Peaks are numbered and correspond to (Supplementary Data 5). e Pseudotime trajectories from PT-S12 to aPT for the expression and activity of TFs ELF3, KLF6, and KLF10 with target gene expression. X axis: pseudotime, Y axis: z score of transformed values based on the standard deviation of the mean. TF motifs are provided to the right. f Representative spatial transcriptomic mapping (N = 3) in a healthy reference, injured cortex, and injured medulla. SLC12A1 defines the corticomedullary distribution (including medullary rays). TPM1 and ELF3 expressions are upregulated in the injured cortex. TF activity of ELF3 is present only in the cortex (in PT dominant spots) and is upregulated in the injured cortex.
Fig. 7
Fig. 7. In silico perturbation knockout in the proximal tubule (PT) (N = 12).
a Cell type distribution of PT-S1, PT-S2, and adaptive PT (aPT). b Partition-based graph abstraction (PAGA) shows the connectivity of 9 subclusters in Louvain annotation. c Cell type annotation distribution across the 9 subclusters. d ELF3, a TF targeting multiple aPT marker genes, is expressed in PT clusters before combined knockout of ELF3, KLF6, and KLF10, but is reduced in expression after knockout. e Cell velocity combined with the pseudotime plot showing the cell flow from PT-S1 and PT-S2 to the aPT cell state. f The cell flow after in silico knockout revealing disruption of the trajectory. g Gene expression in nine subclusters of selected PT-S12 marked genes (blue) and 50 top differential aPT markers before and after combined knockout Benjamini-Hochberg adjusted P value < 0.05 (Wilcox test). h Expression of selected aPT marker genes with predicted TF binding from ELF3, KLF6, or KLF10 before and after combined knockout.
Fig. 8
Fig. 8. Adaptation in the cortical thick ascending loop of Henle (C-TAL).
a Differentially expressed genes (DEGs) between the adaptive TAL (aTAL, blue) and C-TAL (magenta), for N = 3152 genes at a Bonferroni adjusted P value < 0.05 (Wilcox test) within the multiome atlas (N = 12). b UMAP harmony of aTAL and C-TAL. Inset shows pseudotime from C-TAL to aTAL. c Gene expression localizes in aTAL cells for aTAL marker genes (LAMC2, FHL2, and TM4SF1). Canonical C-TAL markers (UMOD and ESRRG) are expressed in the TAL. NR2F1 is a TF that is not differentially expressed. d Top 15 clusters from GO-All pathway enrichment analysis at a Bonferroni adjusted P value < 0.05 (enrichment tests). The genes are based on DA regions in the aTAL. Key pathways of the adaptive process overlap with those of the aPT, including mesodermal cell differentiation and adhesion. e Alignment of epigenomic features in TM4SF1 and FHL2 for the aTAL and C-TAL. The red stripe indicates a peak with TF binding by NR2F1. Co-accessibility scores were correlated with gene expression, peak accessibility by Signac, DNAm in the tubulointerstitium (TI), and histone marks. Additional TF peaks and target genes are found in Supplementary Fig. 12. TF Peaks are numbered and correspond to Supplementary Data 13. f Top 10 most differentially expressed TF in the aTAL and C-TAL (by TRIPOD1). The TF NR2F1 is not differentially expressed. The bar plot conveys the AUC of summative gene open chromatin. g The expression of FHL2 and TM4SF1 is highest in the aTAL. The peak activity of the peaks targeted by NR2F1 is also highest in the aTAL region. h Representative spatial transcriptomic mapping (N = 3) in a healthy reference, injured cortex, and injured medulla. NR2F1 expression and activity occur in the medulla, and activity is present in injury.

Update of

  • The chromatin landscape of healthy and injured cell types in the human kidney.
    Gisch DL, Brennan M, Lake BB, Basta J, Keller M, Ferreira RM, Akilesh S, Ghag R, Lu C, Cheng YH, Collins KS, Parikh SV, Rovin BH, Robbins L, Conklin KY, Diep D, Zhang B, Knoten A, Barwinska D, Asghari M, Sabo AR, Ferkowicz MJ, Sutton TA, Kelly KJ, Boer IH, Rosas SE, Kiryluk K, Hodgin JB, Alakwaa F, Jefferson N, Gaut JP, Gehlenborg N, Phillips CL, El-Achkar TM, Dagher PC, Hato T, Zhang K, Himmelfarb J, Kretzler M, Mollah S; Kidney Precision Medicine Project (KPMP); Jain S, Rauchman M, Eadon MT. Gisch DL, et al. bioRxiv [Preprint]. 2023 Jun 8:2023.06.07.543965. doi: 10.1101/2023.06.07.543965. bioRxiv. 2023. Update in: Nat Commun. 2024 Jan 10;15(1):433. doi: 10.1038/s41467-023-44467-6. PMID: 37333123 Free PMC article. Updated. Preprint.

References

    1. Kellum, J. A. et al. Acute kidney injury. Nat. Rev. Dis. Primers7, 52 (2021). - PubMed
    1. Gerhardt LMS, et al. Lineage tracing and single-nucleus multiomics reveal novel features of adaptive and maladaptive repair after acute kidney injury. J. Am. Soc. Nephrol. 2023;34:554–571. doi: 10.1681/ASN.0000000000000057. - DOI - PMC - PubMed
    1. Lake, B. B. et al. An atlas of healthy and injured cell states and niches in the human kidney. bioRxiv10.1101/2021.07.28.454201 (2021). - PMC - PubMed
    1. Jeruschke S, et al. Everolimus stabilizes podocyte microtubules via enhancing TUBB2B and DCDC2 expression. PLoS One. 2015;10:e0137043. doi: 10.1371/journal.pone.0137043. - DOI - PMC - PubMed
    1. Muto Y, et al. Single cell transcriptional and chromatin accessibility profiling redefine cellular heterogeneity in the adult human kidney. Nat. Commun. 2021;12:2190. doi: 10.1038/s41467-021-22368-w. - DOI - PMC - PubMed