. 2024 Jan 11;15(1):451.
doi: 10.1038/s41467-024-44689-2.

Prostaglandin E2 controls the metabolic adaptation of T cells to the intestinal microenvironment

Affiliations

Prostaglandin E2 controls the metabolic adaptation of T cells to the intestinal microenvironment

Matteo Villa et al. Nat Commun. .

Abstract

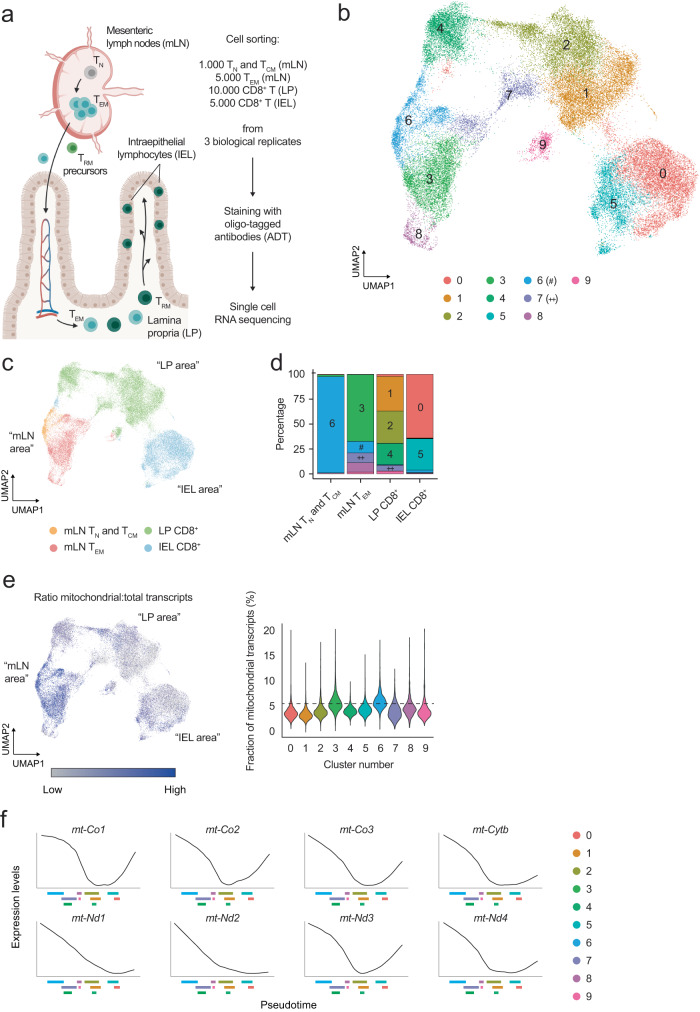
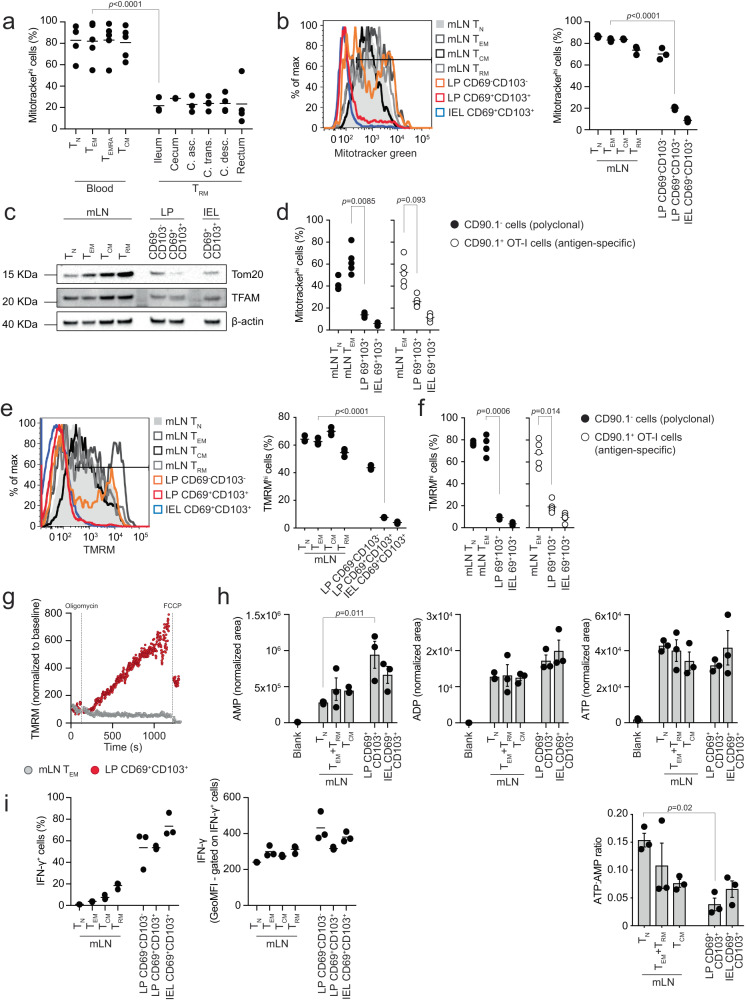
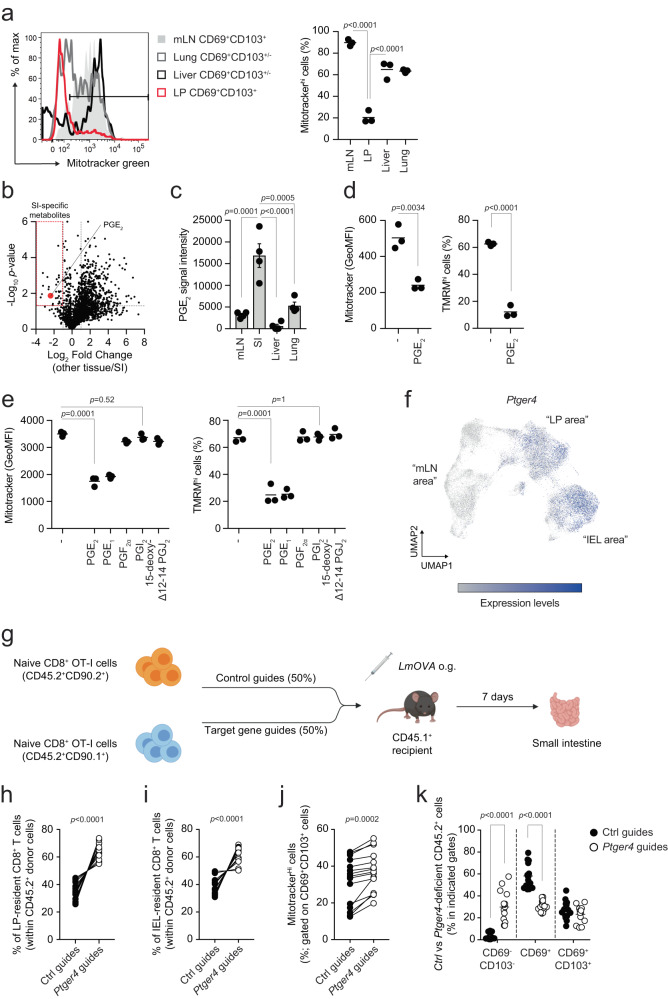
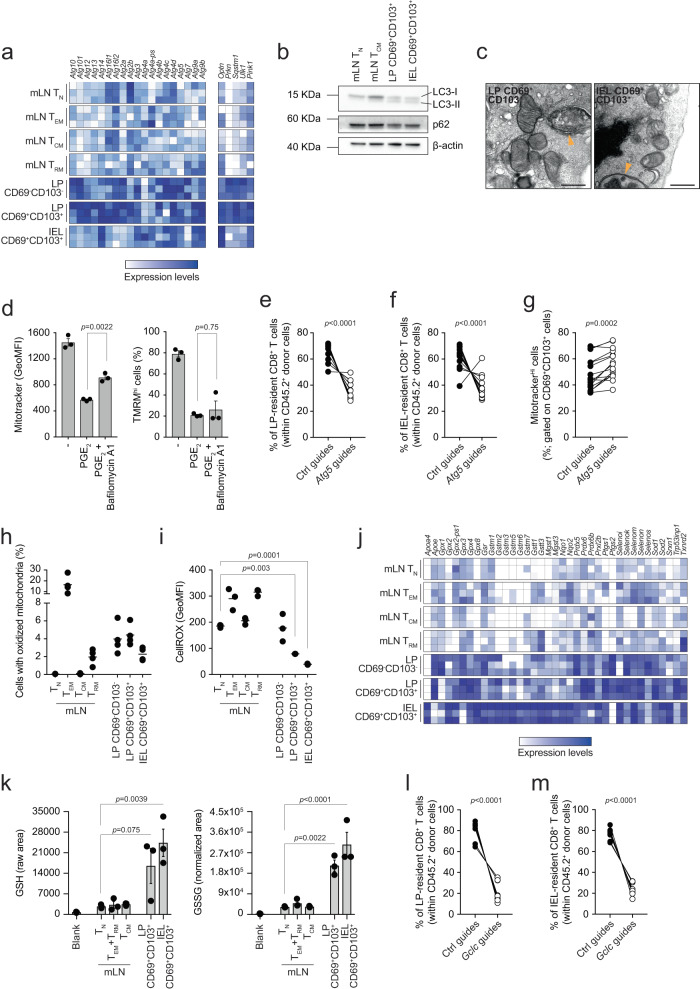
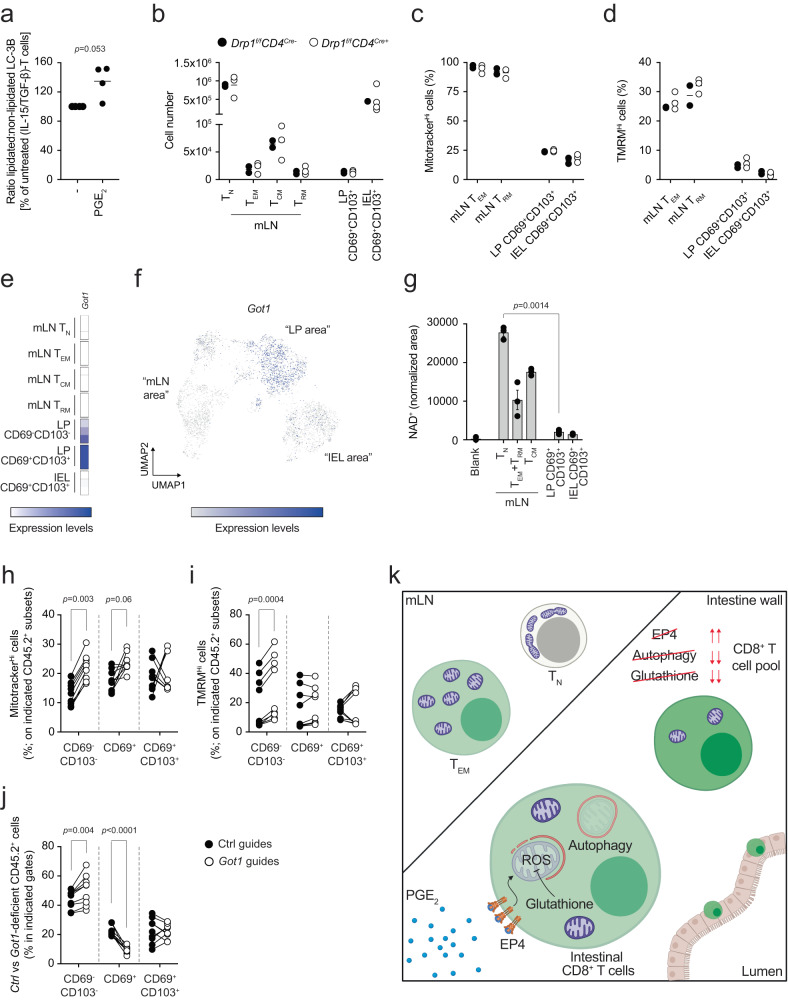
Immune cells must adapt to different environments during the course of an immune response. Here we study the adaptation of CD8+ T cells to the intestinal microenvironment and how this process shapes the establishment of the CD8+ T cell pool. CD8+ T cells progressively remodel their transcriptome and surface phenotype as they enter the gut wall, and downregulate expression of mitochondrial genes. Human and mouse intestinal CD8+ T cells have reduced mitochondrial mass, but maintain a viable energy balance to sustain their function. We find that the intestinal microenvironment is rich in prostaglandin E2 (PGE2), which drives mitochondrial depolarization in CD8+ T cells. Consequently, these cells engage autophagy to clear depolarized mitochondria, and enhance glutathione synthesis to scavenge reactive oxygen species (ROS) that result from mitochondrial depolarization. Impairing PGE2 sensing promotes CD8+ T cell accumulation in the gut, while tampering with autophagy and glutathione negatively impacts the T cell pool. Thus, a PGE2-autophagy-glutathione axis defines the metabolic adaptation of CD8+ T cells to the intestinal microenvironment, to ultimately influence the T cell pool.


Conflict of interest statement

E.L.P. is a SAB member of Immunomet Therapeutics. The other authors have declared that no competing interests exist regarding this manuscript.

Figures

Fig. 1
Fig. 1. CD8+ T cells in the gut LP and epithelial layer have remodeled the transcription of mitochondria-encoded genes.
a Schematic representation of the gut-specific CD8+ T cell response and strategy designed to investigate it. Image created with Biorender.com. b Uniform Manifold Approximation and Projection (UMAP) of the single cell RNA and ADT sequencing data obtained from the experiments designed as in (a). Upon clustering analysis, 10 RNA-based clusters (0–9) were identified, using a resolution of 0.2. 49,111 cells obtained from 4 tissues and 3 biological replicates were analyzed. Color-coding is indicated in the legend. c UMAP of the single cell RNA and ADT sequencing data. Color-coding is according to the tissue of origin as outlined in the legend. The labeling in quotation marks refers to the data in (b). d Bar graph of the distribution of the clusters identified in (b) across different tissues of origin. Within every tissue, cell numbers are normalized to 100% and the fractional contribution of every cluster is indicated. Color-coding resembles the one used in (b). e UMAP of the single cell RNA and ADT sequencing data showing the ratio of mitochondrial transcripts over the total transcriptome, across different clusters. The labeling in quotation marks refers to the data in (b). Violin plots show the fraction of mitochondria-derived transcripts over the total transcriptome, across different clusters. The black dashed line indicates the median value identified for cluster 6. f Plots representing the expression of selected genes as a function of pseudotime, as identified in the data shown in Supplementary Fig. 2a. On the x axis, the interquartile range of every cluster is indicated, to facilitate the correlation between gene expression and progression of cells through pseudotime. Color-coding is indicated in the legend.
Fig. 2
Fig. 2. Intestinal LP and IEL T cells have reduced mitochondrial content.
a Flow cytometry analysis of Mitotracker green in cell populations from blood and intestine of healthy humans. Lines in the dot plot show mean values and graph shows data from 2 to 5 independent experiments. b Mitotracker green in cell populations isolated from mLN and intestine of C57BL/6J mice. Lines in the dot plot show mean values and data show n = 3 biological replicates over nine independent experiments. c Western blot of Tom20 and TFAM. The data shown are representative of six independent experiments. d Mitotracker green in antigen-specific and polyclonal cell populations isolated from mLN and intestine of mice orally challenged with LmOVA and analyzed 7 days post-infection. Lines in the dot plot show mean values and data show n = 5 biological replicates over four independent experiments. e TMRM staining in the indicated cell populations. Lines in the dot plot show mean values and data show n = 3 biological replicates over five independent experiments. f TMRM in antigen-specific and polyclonal cells isolated from mLN and intestine of mice orally challenged with LmOVA and analyzed 7 days post-infection. Lines in the dot plot show mean values and data show n = 5 biological replicates over four independent experiments. g TMRM staining in cells upon treatment with oligomycin and FCCP. TMRM was used at a concentration of 10 nM. TMRM values are shown normalized to the baseline of staining in the respective population. Data are representative of three independent experiments. h Mass spectrometry analysis of AMP, ADP, ATP, and ATP:AMP ratio. The bars show mean ± SEM. Data show three independent experiments analyzed simultaneously. i Intracellular interferon-γ (IFN-γ) protein expression in cells isolated from mLN and intestine of GREAT mice. Lines in the dot plots show mean values and data show n = 3 biological replicates over two independent experiments. a, b, df, and h Statistics were performed using one-way ANOVA and Tukey’s multiple comparison correction. Source data are provided as a Source Data file.
Fig. 3
Fig. 3. Prostaglandin E2 regulates mitochondrial content of intestinal LP and IEL-isolated CD8+ T cells.
a Mitotracker green in CD8+CD69+CD103+/− cells isolated from the tissues of unchallenged mice. Lines in the dot plot show mean values and the data show n = 3 biological replicates over two independent experiments. b Volcano plot shows the differential distribution of metabolites isolated from the interstitial fluid of tissues. Dashed lines indicate the fold change filter of FC > 2 and FC < −2 and the p value filter of p = 0.05. Plot shows cumulative data of four independent experiments. Statistics were performed using Student’s t test between metabolites identified in the small intestine and metabolites identified in all the other tissues. No FDR correction was applied. c Relative abundance of PGE2 in interstitial fluid isolated from the indicated tissues. Graph shows mean values ± SEM of cumulative data of four independent experiments. d Mitotracker green and TMRM in CD8+ T cells activated in (IL-15/TGF-β)-T cell-polarizing conditions for 5 days and treated for 24 h with 10 μM PGE2. Lines in the dot plot show mean values and the data show n = 3 biological replicates over three independent experiments. Statistics were performed using two-tailed Student’s t test. e Mitotracker green and TMRM staining in CD8+ T cells activated in (IL-15/TGF-β)-T cell-polarizing conditions for 5 days and treated for 24 h with 100 nM of different prostaglandins. Lines in the dot plot show mean values and the data show n = 3 biological replicates over two independent experiments. Statistics were performed using one-way ANOVA and Dunnet’s multiple comparison correction. f UMAP of the single cell RNA and ADT sequencing data showing expression across different clusters of Ptger4. g Schematic of the Listeria monocytogenes expressing OVA (LmOVA) infection model used in Figs. 3–5. OT-I donor cells were CD45.2+, whereas recipient mice were CD45.1+. CD90.1 and CD90.2 were used to additionally separate control guide- vs target gene guides-treated donor cells. LmOVA was administered by oral gavage. Image created with Biorender.com. hi Distribution of Ctrl vs Ptger4-deleted CD8+ T cells within the population of CD45.2+ cells upon LmOVA challenge in LP (h) and IEL fraction (i). Lines in the dot plot show pairing within single mice, and the dot plots show cumulative data of n = 15 biological replicates over three independent experiments. j Mitotracker green in Ctrl vs Ptger4-deleted CD69+CD103+ cells isolated from LP of mice orally challenged with LmOVA. Lines in the dot plot show pairing within single mice, and dot plots show cumulative data of n = 15 biological replicates over three independent experiments. k Distribution of Ctrl vs Ptger4-deleted CD8+ T cells gated in the population of CD45.2+ cells between CD69CD103, CD69+ and CD69+CD103+ populations, upon LmOVA challenge in LP. Lines in the dot plot show mean values; dot plots show cumulative data of n = 15 biological replicates over three independent experiments. Statistics were performed using two-way ANOVA and Sidak’s multiple comparison correction. a, c Statistics were performed using one-way ANOVA and Tukey’s multiple comparison correction. h, i Statistics were performed using two-tailed paired t test. Source data are provided as a Source Data file.
Fig. 4
Fig. 4. Autophagy and glutathione maintain the fitness of LP and IEL T cells.
a, j Heatmaps show the expression of selected genes of bulk RNA sequencing data. Color-coding is as per legend (white, low expression; blue, high expression) and shows relative values within each gene. Data show three independent experiments. b Western blot of LC3 isoforms and p62. The data are representative of two independent experiments (LC3) or one experiment (p62). c Transmission electron microscopy of cells isolated from unchallenged mice. Yellow arrowheads indicate double membrane structures characteristic of autophagosomes. Scale bar = 500 nm. The panel shows representative images of one experiment. d Mitotracker green and TMRM in CD8+ T cells activated in (IL-15/TGF-β)-T cells polarizing conditions for 5 days and treated with PGE2 in the presence of bafilomycin A1. Lines in the dot plot show mean values ± SEM and the data show n = 3 biological replicates over five independent experiments. ef Distribution of Ctrl vs Atg5-deleted CD8+ T cells within the population of CD45.2+ cells upon LmOVA challenge in LP (e) and IEL fraction (f). Lines in the dot plot show pairing within single mice, and the dot plots show cumulative data of n = 15 biological replicates over three independent experiments. g Mitotracker green in Ctrl vs Atg5-deleted CD69+CD103+ cells isolated from LP of mice orally challenged with LmOVA. Lines in the dot plot show pairing within single mice, and dot plots show cumulative data of n = 15 biological replicates over three independent experiments. h Mitochondrial oxidative state, as indicated by a shift from green to blue fluorescence, in cells isolated from mLN and intestine of Mito-roGFP2-Orp1. Lines in the dot plot show mean values and the data show n = 4 biological replicates over two independent experiments. i CellROX staining. Lines in the dot plot show mean values and the data show n = 3 biological replicates over three independent experiments. k Mass spectrometry analysis of levels of GSH and GSSG in the indicated cell populations. The bars show mean ± SEM. Data show three independent experiments analyzed simultaneously. lm Distribution of Ctrl vs Gclc-deleted CD8+ T cells within the population of CD45.2+ cells upon LmOVA challenge in LP (l) and IEL fraction (m). Lines in the dot plot show pairing within single mice, and the data show n = 8 biological replicates over two independent experiments. d, h, i and k Statistics were performed using one-way ANOVA and Tukey’s multiple comparison correction. eg, l, m Statistics were performed using two-tailed paired t test. Source data are provided as a Source Data file.
Fig. 5
Fig. 5. Got1 links PGE2 with the regulation of mitochondrial content in intestinal LP and epithelial CD8+ T cells.
a Western blot of LC3-I and LC3-II in (IL-15/TGF-β)-T cells cultured for 6 days and treated for 24 h with or without 100 nM PGE2. Dot plot shows quantification by densitometry. Lines in dot plots show mean values. Dot plots show cumulative data of n = 4 biological replicates over two independent experiments. Statistics were performed using two-tailed paired t test. b Cell numbers of CD8+ T cells subsets in mLN, LP and IEL of Drp1fl/flCD4Cre+ and Drp1fl/flCD4Cre mice. Lines in the dot plot show mean values and the data show n = 2–4 biological replicates over two independent experiments. c, d Mitotracker green and TMRM in cells from mLN and intestine of Drp1fl/flCD4Cre+ and Drp1fl/flCD4Cre mice. Lines in the dot plot show mean values and the data show n = 2–4 biological replicates over two independent experiments. e Heatmaps show the expression of Got1 in bulk RNA sequencing data obtained from the indicated cells. Color-coding is as per legend (white, low expression; blue, high expression) and shows relative values within the Got1 gene. Data show three independent experiments. f UMAP of the single cell RNA and ADT sequencing data showing expression across different clusters of Got1. g Mass spectrometry quantification of NAD+ in the indicated cells. The bars show mean ± SEM. Data show three independent experiments analyzed simultaneously. Statistics were performed using one-way ANOVA and Tukey’s multiple comparison correction. Mitotracker green (h) and TMRM (i) in Ctrl vs Got1-deleted CD69CD103, CD69+ and CD69+CD103+ cells isolated from LP of mice orally challenged with LmOVA. Lines in the dot plot show pairing within single mice, and dot plots show cumulative data of n = 9 biological replicates over two independent experiments. j Distribution of Ctrl vs Got1-deleted CD8+ T cells gated in the population of CD45.2+ cells between CD69CD103, CD69+ and CD69+CD103+ populations, upon LmOVA challenge in LP. Lines in the dot plot show pairing within single mice; dot plots show cumulative data of n = 9 biological replicates over two independent experiments. k After activation CD8+ T cells migrate and enter the intestine. Here, they sense PGE2 via the EP4 receptor. PGE2 drives the reduction of mitochondrial membrane potential, in part via alteration of the malate-aspartate shuttle, and leads to drop in mitochondrial mass. Autophagy contributes to the clearance of depolarized mitochondria, whereas glutathione maintains the redox balance by scavenging mitochondrial ROS, to ultimately shape the pool of CD8+ T cells. Image created with Biorender.com. hj Statistics were performed using two-way ANOVA and Sidak’s multiple comparison correction. Source data are provided as a Source Data file.

Update of

References

    1. Lavelle, E. C. & Ward, R. W. Mucosal vaccines—fortifying the frontiers. Nat. Rev. Immunol. 22, 236–250 (2022). - PMC - PubMed
    1. Masopust D, et al. Dynamic T cell migration program provides resident memory within intestinal epithelium . J. Exp. Med. 2010;207:553–564. - PMC - PubMed
    1. Zhang N, Bevan MJ. CD8(+) T cells: foot soldiers of the immune system . Immunity. 2011;35:161–168. - PMC - PubMed
    1. Buck MD, et al. Mitochondrial dynamics controls T cell fate through metabolic programming . Cell. 2016;166:63–76. - PMC - PubMed
    1. Doedens AL, et al. Hypoxia-inducible factors enhance the effector responses of CD8(+) T cells to persistent antigen . Nat. Immunol. 2013;14:1173–1182. - PMC - PubMed