. 2024 Jan 10;15(1):429.
doi: 10.1038/s41467-023-44426-1.

Assembly of a unique membrane complex in type VI secretion systems of Bacteroidota

Affiliations

Assembly of a unique membrane complex in type VI secretion systems of Bacteroidota

Thibault R Bongiovanni et al. Nat Commun. .

Abstract

The type VI secretion system (T6SS) of Gram-negative bacteria inhibits competitor cells through contact-dependent translocation of toxic effector proteins. In Proteobacteria, the T6SS is anchored to the cell envelope through a megadalton-sized membrane complex (MC). However, the genomes of Bacteroidota with T6SSs appear to lack genes encoding homologs of canonical MC components. Here, we identify five genes in Bacteroides fragilis (tssNQOPR) that are essential for T6SS function and encode a Bacteroidota-specific MC. We purify this complex, reveal its dimensions using electron microscopy, and identify a protein-protein interaction network underlying the assembly of the MC including the stoichiometry of the five TssNQOPR components. Protein TssN mediates the connection between the Bacteroidota MC and the conserved baseplate. Although MC gene content and organization varies across the phylum Bacteroidota, no MC homologs are detected outside of T6SS loci, suggesting ancient co-option and functional convergence with the non-homologous MC of Pseudomonadota.


Conflict of interest statement

The authors declare no competing interests.

Figures
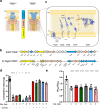
Fig. 1
Fig. 1. The five genes tssNQOPR are essential for T6SS function in B. fragilis.
a Schematic representation showing the difference between canonical T6SS and the Bacteroides fragilis membrane complex. b T6SS locus comparison between enteroaggregative E. coli and B. fragilis colored with the same color code used in panel (a). c AlphaFold2 models of the TssNQOPR proteins showing their topology relative to the membranes. d 16-hr anaerobic co-cultures of B. fragilis and B. thetaiotaomicron to measure T6SS-dependent competition. Competitive index calculated as the ratio of (donor B. fragilis/recipient B. thetaiotaomicron)final / (donor B. fragilis/recipient B. thetaiotaomicron)initial CFUs. In-frame chromosomal deletions of tssN, tssO, tssP, tssQ, and tssR respectively resulted in ablation of competitive advantage. Advantage was restored with complementation of chromosomal single copy insertions of tssN, tssO, tssP, tssQ, and tssR respectively. * indicates P values = 0.037, ** = 0.004, **** ≤ 0.0001, two-sided unpaired t tests. Mean ± s.d. are shown; n = 12 for wildtype and ΔtssC, n = 6 for ΔtssQ and ΔtssR, and n = 3 for other strains, independent biological replicates that are each the mean of 3 technical replicates. e Anti-Hcp ELISA performed on the supernatants of corresponding B. fragilis strains to quantify levels of Hcp secretion. As in a, deletion strains reduced Hcp secretion levels to baseline. Results are normalized to cell density (OD600). **** indicate P values ≤ 0.0001, one-way ANOVA. Mean ± s.d. are shown; n = 9 for wildtype, ΔtssC, ΔtssR, and ΔtssP, n = 10 for ΔtssO, ΔtssN, and ΔtssQ; independent biological replicates each with 3 technical replicates. Source data are provided as a Source Data file.
Fig. 2
Fig. 2. B. fragilis assembles a TssNQOPR complex.
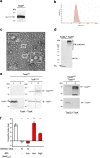
a Identification of the 5 proteins using mass spectrometry after a pulldown using TssN-STREP bait, two biological replicates (BR) were performed, and exponentially modified protein abundance index (emPAI) is calculated. b Western blot α-STREP and α-HIS showing the purification of STREPTssN and HTssO after the pulldown using the STREP tag of TssN as a bait. c Estimated stoichiometry based on the emPAI calculated from the mass spectrometry analysis. Data are presented as mean values +/- SD. d Immunoblotting showing the copurification of the TssNQOPR complex using TssN-STREP as a bait followed by SEC chromatography. Load (L) and Elution (E) were loaded on a 12.5%-acrylamide SDS PAGE, and immunodetected with respective anti-tag antibody. The position of the proteins is indicated on the right, molecular weight markers (in kilodaltons) are indicated on the left. The negative control shows no copurification. e Negative staining micrographs of the TssNQOPR complex purified from E. coli overproduction. For western blots and micrographs, representative images from triplicate experiments are presented.
Fig. 3
Fig. 3. Interaction network in the complex.
Schematic representation of the interactions between all of the TssNQOPR proteins using copurification. The full arrows represent copurification observed in full-length proteins, the dashed arrow represents copurification of the periplasmic truncations of the proteins. A grey arrow with a flat end indicates that no co-purification was observed.
Fig. 4
Fig. 4. Interaction with the baseplate.
a Immunoblotting showing the purification of the TssN-S homomultimer. b Dynamic Light Scattering graph showing the average size of the TssN-S homomultimers. c Electron micrograph showing the multimers formed by purified TssN-S. Insets show zoom-in of TssN multimer particles. d Comparison of extracts of E. coli strains producing TssN-S and TssNc-S loaded on a 12,5% acrylamide SDS PAGE and immunodetected by anti-strep antibody. e Immunoblotting showing the copurification of the TssKHA with TssNS, purified with a STREP-trap affinity column. Load (L) and Elution were loaded on a 12.5%-acrylamide SDS PAGE, and immunodetected with respective anti-tag antibody. The position of the proteins is indicated on the right, molecular weight markers (in kilodaltons) are indicated on the left. The TssQGST-TssKHA copurification is used as a negative control and shows no copurification. f Anaerobic co-cultures of donor B. fragilis and recipient B. thetaiotaomicron to measure T6SS-dependent competition. Competitive index calculated as the ratio of donor/recipientfinal / donor/recipientinitial CFUs. Strains are combinations of wildtype tssN, in-frame chromosomal deletions of tssN, and chromosomal single copy insertions of tssNcyto under constitutive highly expressing promoter (P1TDPA21) or constitutive moderately expressing promoter (BT1311). *** indicate P values < 0.0001, ns not significant, two-sided unpaired t tests. Mean ± s.d. are shown; n = 8 for ΔtssN TssNc high, n = 9 for others; independent biological replicates that are each the mean of 3 technical replicates. For western blots and micrographs, representative images from triplicate experiments are presented. Source data are provided as a Source Data file.
Fig. 5
Fig. 5. TssNQOPR are required for proper T6SSiii sheath assembly in B. fragilis.
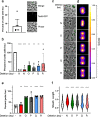
a Percent of wildtype B. fragilis cells expressing TssB-GFP sheaths. Mean + s.d. is shown; each dot represents the number of foci / number of cells with TssB-GFP foci in a biological replicate. Seven biological replicates with four fields (technical replicates) per biological replicate were measured, totaling 93887 cells and 5293 foci. Representative field of cells included as an inset, with phase contrast, TssB-GFP fluorescence, and merged composite micrographs. b Percent of B. fragilis cells with TssB-GFP foci, normalized to the corresponding wildtype strain per biological replicate. n = 93887 wildtype, 46235 ΔtssK, 27668 ΔtssN, 54976 ΔtssO, 28979 ΔtssP, 39085 ΔtssQ, 46603 ΔtssR, cells analyzed; n = 5293 wildtype, 120 ΔtssK, 484 ΔtssN, 1233 ΔtssO, 660 ΔtssP, 802 ΔtssQ, 1009 ΔtssR foci analyzed. ns indicates P values = 0.109, ** indicates P value = 0.007 for ΔtssO, 0.003 for ΔtssP, and 0.005 for ΔtssO, *** indicates P value = 0.0009, **** indicates P value < 0.0001. c Representative composite micrographs of strains quantified in (b), merge of phase contrast and TssB-GFP fluorescence. Additional inset of an individual cell elaborating an extended TssB-GFP sheath shown for wildtype in white box. d Subcellular localization heatmaps generated from ~500 random TssB-GFP foci per strain. Density of TssB-GFP foci plotted with heatmap LUT and as individual white foci. Strains correspond to labels in (c). e Percent of “polar” localized TssB-GFP foci relative to total foci per strain. ns indicates P values = 0.155, ** indicates P value = 0.005, **** indicates P value < 0.0001. f Distribution of TssB-GFP foci lengths across B. fragilis strains. **** indicates P value < 0.0001. Two-sided one sample t-test for (b) two-sided unpaired t-tests for e and f. Means ± s.d. are shown; n = 4 independent biological replicates that are each the mean of 4 technical replicates. Scale bars, 1 µm in (a), 2 µm in (c). Source data are provided as a Source Data file.
Fig. 6
Fig. 6. Distribution and organization of T6SSiii loci across Bacteroidota.
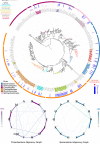
The tree of the phylum with one genome per species. The outer layers indicate the presence or absence of the T6SS (universal markers in just one group) and each of the MC components (see inset legend). The outer ribbon indicates the Order. The most represented genera are colored according to the colors indicated in the inset legend. Graphs depict the genetic organization of the T6SS of Proteobacteria (left) and Bacteroidota (right).
Fig. 7
Fig. 7. Model of the Bacteroidota T6SSiii assembly.
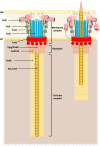
The T6SSiii is a contractive nano weapon composed of three subcomplexes, the membrane complex, the baseplate and the contractive tail. The newly discovered membrane complex is made by TssN-TssQ-TssO-TssP-TssR and anchor the whole machinery to the membranes of the bacteria. The baseplate and contractive tail are made of TssK-TssF-TssG-TssE and TssB-TssC-Hcp respectively.

References

    1. Young VB. The role of the microbiome in human health and disease: an introduction for clinicians. BMJ. 2017;356:j831. doi: 10.1136/bmj.j831. - DOI - PubMed
    1. Coyte KZ, Rakoff-Nahoum S. Understanding competition and cooperation within the mammalian gut microbiome. Curr. Biol. 2019;29:R538–R544. doi: 10.1016/j.cub.2019.04.017. - DOI - PMC - PubMed
    1. Garcia-Bayona L, Comstock LE. Bacterial antagonism in host-associated microbial communities. Science. 2018;361:eaat2456. doi: 10.1126/science.aat2456. - DOI - PubMed
    1. Hood RD, et al. A type VI secretion system of Pseudomonas aeruginosa targets a toxin to bacteria. Cell Host Microbe. 2010;7:25–37. doi: 10.1016/j.chom.2009.12.007. - DOI - PMC - PubMed
    1. Wang J, Brodmann M, Basler M. Assembly and subcellular localization of bacterial type VI secretion systems. Annu Rev. Microbiol. 2019;73:621–638. doi: 10.1146/annurev-micro-020518-115420. - DOI - PubMed

Substances

LinkOut - more resources