

Quantitative mRNA expression measurement at home
- PMID: 38200031
- PMCID: PMC10781964
- DOI: 10.1038/s41598-023-49651-8
Quantitative mRNA expression measurement at home
Abstract
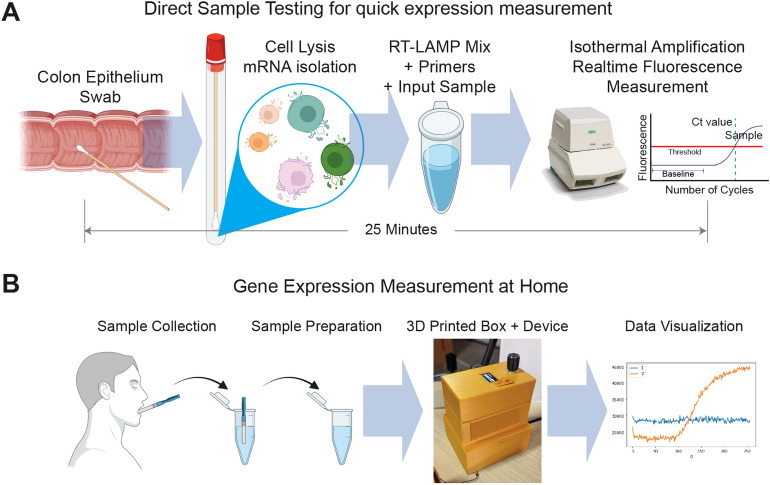
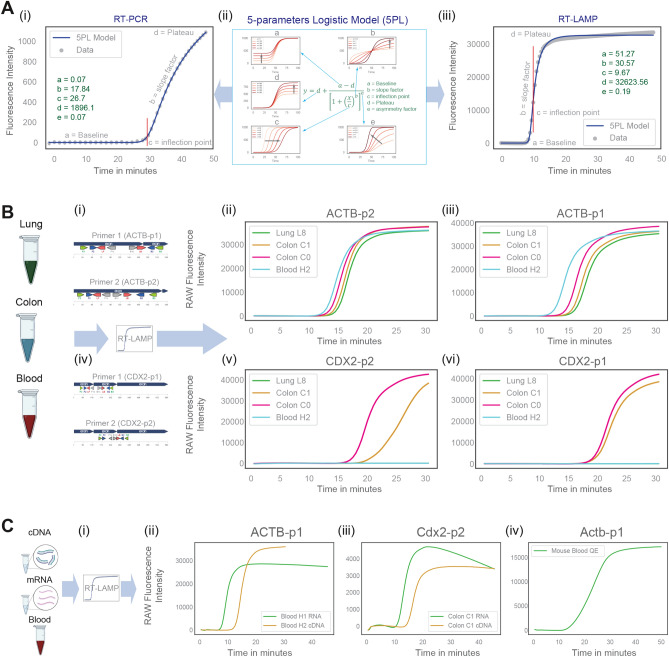
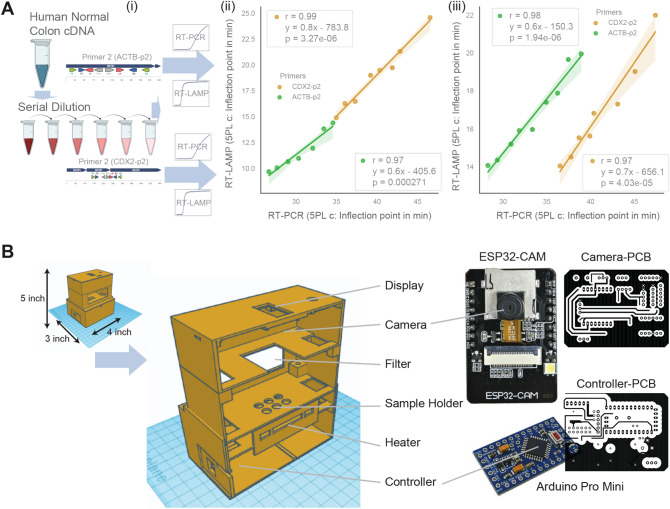
mRNA measurement is dominated by RT-PCR, which requires expensive laboratory equipment and personnel with advanced degrees. Loop-mediated isothermal amplification (LAMP) is a versatile technique for detecting target DNA and RNA. The sensitivity of LAMP in early reports has been below that of the standard RT-PCR tests. Here, we report the use of a fluorescence-based RT-LAMP protocol to measure CDX2 expression patterns, which match extremely well to the standards of sophisticated RT-PCR techniques (r = 0.99, p < 0.001). The assay works on diverse sample types such as cDNA, mRNA, and direct tissue sample testing in 25 min compared to more than 3 h for RT-PCR. We have developed a new protocol for designing RT-LAMP primers that reduce false positives due to self-amplification and improve quantification. A simple device with a 3D-printed box enables the measurement of mRNA expression at home, outdoors, and point-of-care setting.
© 2024. The Author(s).
Conflict of interest statement
Authors have disclosed the IP to UCSD. SP and DS are co-founders of the company Shanvi. SP is the President of Shanvi. All other authors have no competing interests.
Figures
Similar articles
-
Development and Validation of a Novel COVID-19 nsp8 One-Tube RT-LAMP-CRISPR Assay for SARS-CoV-2 Diagnosis.Microbiol Spectr. 2022 Dec 21;10(6):e0196222. doi: 10.1128/spectrum.01962-22. Epub 2022 Nov 29. Microbiol Spectr. 2022. PMID: 36445095 Free PMC article.
-
[Detecting human respiratory syncytial virus in respiratory samples collected from children with acute respiratory infections by reverse transcription-loop mediated isothermal amplification].Zhonghua Er Ke Za Zhi. 2013 Apr;51(4):270-5. Zhonghua Er Ke Za Zhi. 2013. PMID: 23927800 Chinese.
-
Development of a reverse transcription loop-mediated isothermal amplification assay for detecting nervous necrosis virus in olive flounder Paralichthys olivaceus.J Microbiol Biotechnol. 2012 Jul;22(7):1021-8. doi: 10.4014/jmb.1201.01005. J Microbiol Biotechnol. 2012. PMID: 22580323
-
Development of a reverse transcription-loop-mediated isothermal amplification (RT-LAMP) assay for the detection of porcine pegivirus.J Virol Methods. 2019 Aug;270:59-65. doi: 10.1016/j.jviromet.2019.04.019. Epub 2019 Apr 22. J Virol Methods. 2019. PMID: 31022411 Free PMC article.
-
Real-time reverse transcription loop-mediated isothermal amplification for rapid and simple quantification of WT1 mRNA.Clin Biochem. 2009 Apr;42(6):515-20. doi: 10.1016/j.clinbiochem.2009.01.013. Clin Biochem. 2009. PMID: 19297684
Cited by
-
Identification of key genes as potential diagnostic biomarkers in sepsis by bioinformatics analysis.PeerJ. 2024 Jun 18;12:e17542. doi: 10.7717/peerj.17542. eCollection 2024. PeerJ. 2024. PMID: 38912048 Free PMC article.
