. 2024 Jan 10;15(1):444.
doi: 10.1038/s41467-023-44593-1.

Cryo-EM structure and B-factor refinement with ensemble representation

Affiliations

Cryo-EM structure and B-factor refinement with ensemble representation

Joseph G Beton et al. Nat Commun. .

Abstract

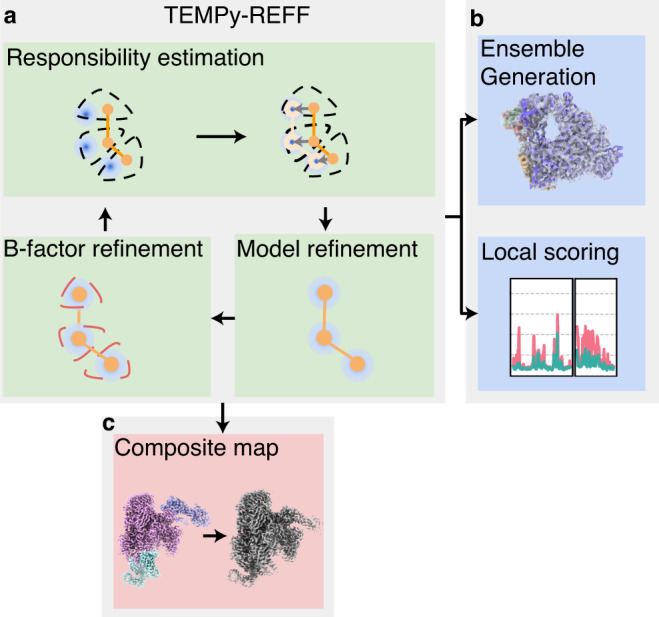
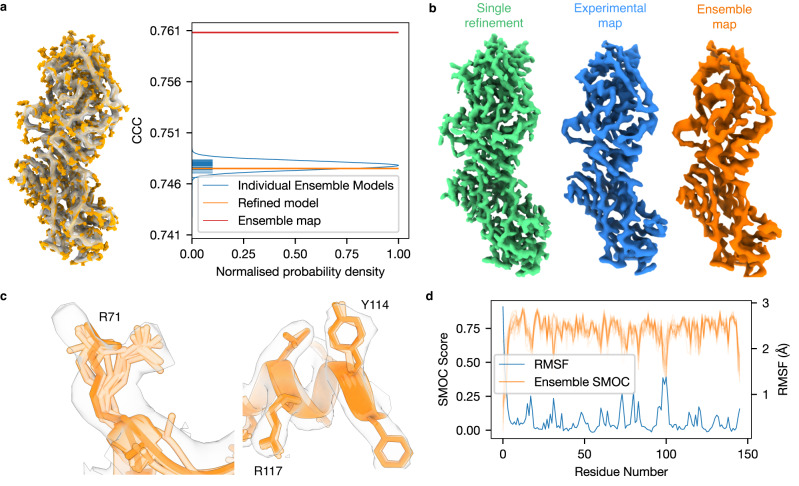
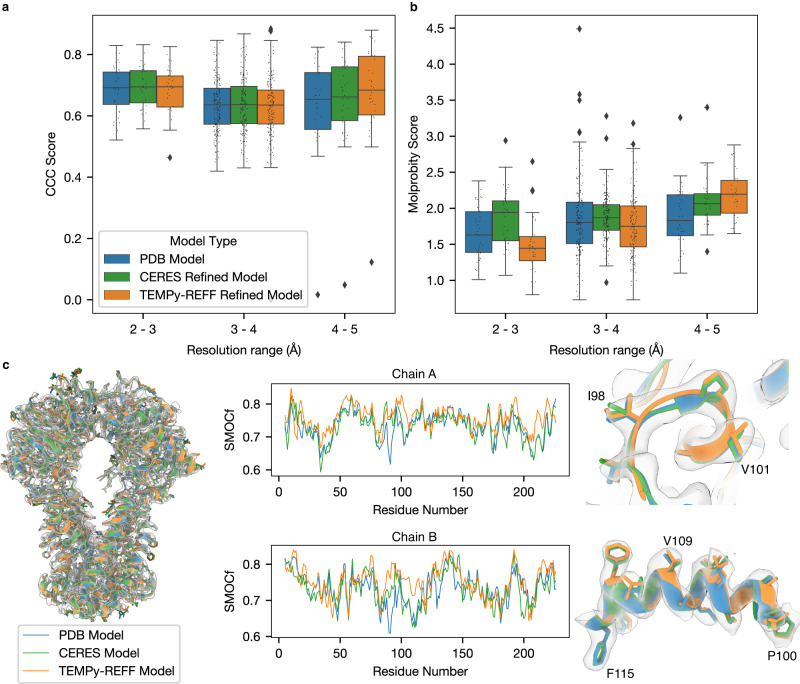
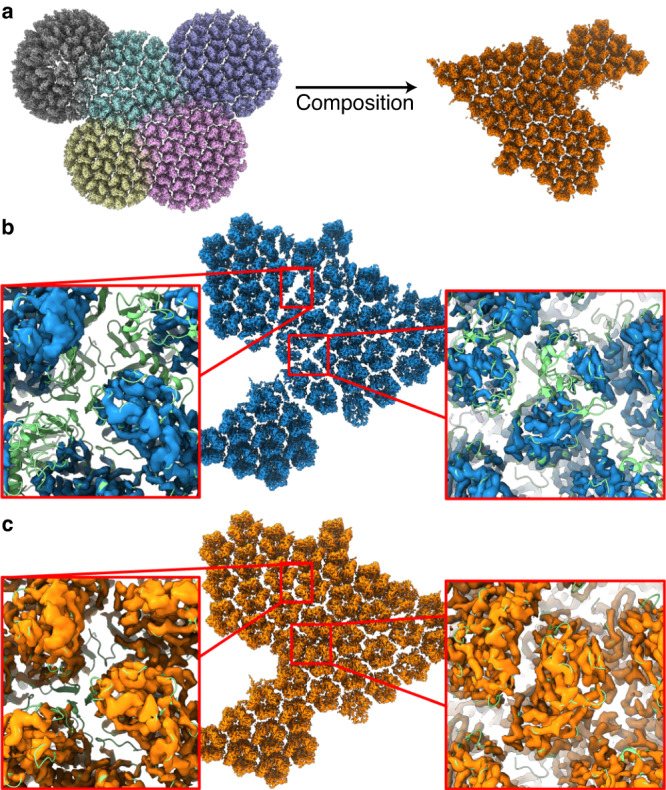
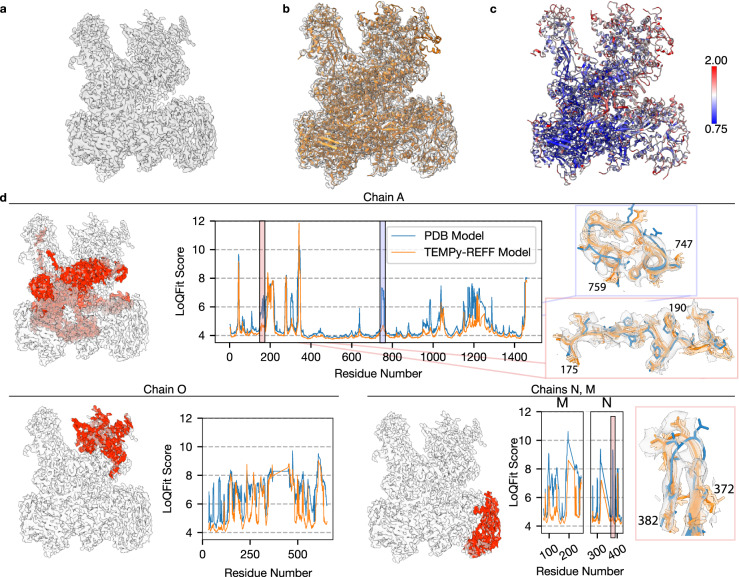
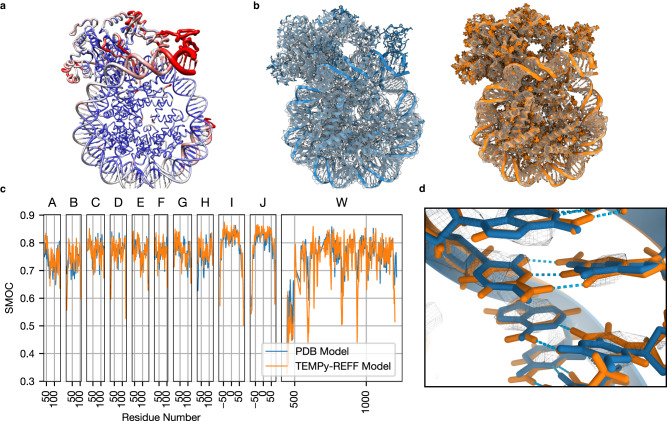
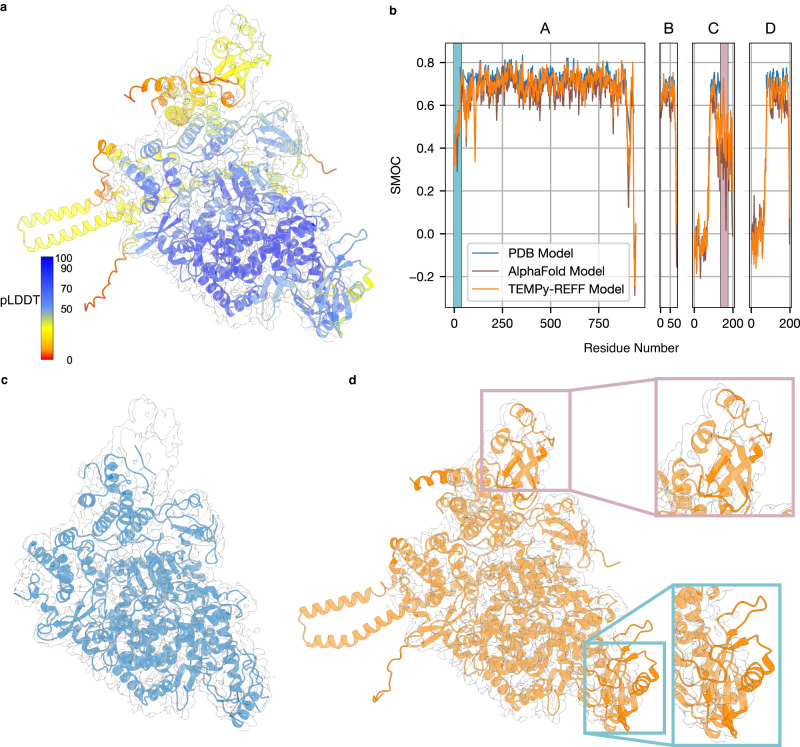
Cryo-EM experiments produce images of macromolecular assemblies that are combined to produce three-dimensional density maps. Typically, atomic models of the constituent molecules are fitted into these maps, followed by a density-guided refinement. We introduce TEMPy-ReFF, a method for atomic structure refinement in cryo-EM density maps. Our method represents atomic positions as components of a Gaussian mixture model, utilising their variances as B-factors, which are used to derive an ensemble description. Extensively tested on a substantial dataset of 229 cryo-EM maps from EMDB ranging in resolution from 2.1-4.9 Å with corresponding PDB and CERES atomic models, our results demonstrate that TEMPy-ReFF ensembles provide a superior representation of cryo-EM maps. On a single-model basis, it performs similarly to the CERES re-refinement protocol, although there are cases where it provides a better fit to the map. Furthermore, our method enables the creation of composite maps free of boundary artefacts. TEMPy-ReFF is useful for better interpretation of flexible structures, such as those involving RNA, DNA or ligands.


Conflict of interest statement

The authors declare no competing interests.

Figures

Fig. 1
Fig. 1. Flow chart summarising the steps in the TEMPy-ReFF algorithm.
a The EM (Expectation-Maximisation) algorithm. Responsibility is an estimation of the part of the data that is represented by a given component in the mixture. New parameters (the mean and variance of each component corresponding to the position and B-factor value) for each component (e.g., for each atom) are then re-estimated using this responsibility and the experimental data. b After refinement, an ensemble can be generated based on the local variance; local scoring provides a view of the quality of fit of all regions of the map, irrespective of the local resolution. c By considering the sum responsibility of all the atoms in a chain, we obtain a natural expression of the part of a map represented by a given chain. This can be used for composition.
Fig. 2
Fig. 2. Ensemble representation of cryo-EM models.
a Depiction of structure ensemble (orange), along with the map (transparent grey); a plot of the CCC of each individual model in the ensemble is shown (blue horizontal lines from y axis), as well as the ensemble map (red). b depiction of a single-model map (green), experimental map, and our computed ensemble map at contour level 0.02. c Differences in the ensemble for different residues, for the ensemble of the Methionine Transporter (PDB ID: 7MC0, EMDB ID: 23752): for residue R71 (left) the ensemble is more widespread, and the side-chain density is more spread out into two peaks, each populated by parts of the ensemble. For high-resolution portions of the map shown on the right side, for example, R117 and Y114, the ensemble is highly constrained, and the side-chain density is well-defined. d SMOCf plot (shown in orange) and RMSFe (shown in blue) for each structure in the ensemble for the Faba bean necrotic stunt virus (PDB ID: 6S44, EMDB ID: 10097, map resolution 3.3 Å); the RMSF and SMOCf score are clearly anticorrelated.
Fig. 3
Fig. 3. Refinement of the CERES benchmark.
a Benchmark comparison using CCC, between the initial (PDB-deposited) models (blue), the CERES re-refined models (green), and TEMPy-ReFF refinement-based model (orange), separated by resolution bands of 1 Å. We evaluated n = 229 individual models. The central line in each boxplot defines the median value, the bounds of each box define the upper and lower quartiles and the whiskers define 1.5 times the interquartile range (IQR). Outliers (points outside this 1.5*IQR range) are marked with rhombus symbols. The individual score for each model is marked with a black point. b Benchmark comparison of the same 229 models using MolProbity score, the colouring and layout of the boxplot is the same as in a. c Comparison between the refinement of the ABC methionine transporter (PDB ID: 7MC0, EMDB ID: 23572, resolution 3.3 Å) with TEMPy-ReFF and the corresponding models from PDB and CERES. For all subpanels the colouring matches that used in a. The left panel shows the overlaid models within the cryo-EM map, which is rendered as a transparent surface. The central panels show the SMOCf scores for residues from chains A (upper panel) and B (lower panel). The left-hand panels show zoomed-in views of sections of chain A (upper panel) and B (lower panel) as highlighted in the respective SMOCf plots with black outlined boxes.
Fig. 4
Fig. 4. Using TEMPy-ReFF for map composition.
a Composition of 5 component maps (EMD-34227, 34229, 34230, 34235, 34236) shown in their overlapping position on the left, combined to create the composite map shown on the right. b Composite map of the Singapore grouper iridovirus capsid (EMD-34815), shown as a blue surface rendering. In order to simplify visual comparison, we masked the original map such that only density around the fitted model (PDB ID: 8HIF) is shown. The deposited composite map retains some artefacts at the borders between the, approximately circular, component maps, where the map density is less intense. This is highlighted in the insets, which also show the fitted model, coloured green. c Composite map, shown as an orange surface rendering, produced using the responsibilities computed by TEMPy-ReFF as weights for each component map. The insets show the map density with the model, again shown in green, at the same location as shown per b. Clearly, the artefacts are no longer present.
Fig. 5
Fig. 5. Case study of RNA polymerase III elongation complex.
a The deposited 3.9 Å cryo-EM map of the RNA polymerase III elongation complex (EMD-3178). b The TEMPy-ReFF refined model of the RNA polymerase III complex deposited structure (PDB ID: 5FJ8) shown within the cryo-EM density. c the TEMPy-ReFF refined model (right) coloured according to the refined B-factors. d LoQFit scoring of individual chains from the RNA polymerase III complex, with the scores for the starting model (obtained from the PDB) shown in blue, and for the TEMPy-ReFF refined mode shown in orange. The position of these chains within the original cryo-EM map are highlighted in red. Insets show several regions before and after refinement coloured as per the LoQFit plots, with the ensemble of models shown in transparent orange.
Fig. 6
Fig. 6. Case studies of Nucleosome-CHD4 complex.
a A nucleosome structure in complex with chromatin remodelling enzyme CHD4 (EMD-10058, PDB ID: 6RYR) is shown (worm representation), with the width proportional to the TEMPy-ReFF refined B-factor, and colour based on local resolution (computed with ResMap). b Deposited model (left, blue) and the ensemble of models and ensemble map calculated with TEMPy-ReFF (right, orange), shown inside the cryo-EM map (transparent grey). c SMOCf plot for each chain. The deposited model is shown in blue, and the TEMPy-ReFF model is shown in orange. d Zoom-in on some of the DNA base pairs (chain I/J, base pair 54) fitted in the map (mesh representation). The deposited model is shown in blue, TEMPy-ReFF model in orange and hydrogen bonds are indicated in cyan.
Fig. 7
Fig. 7. Case studies of SARS-CoV-2 RNA polymerase (AlphaFold2 model refinement).
a AlphaFold2 predicted structure, with the colouring indicating the plDDT confidence measure (blue means higher confidence, red means lower confidence), fitted in the deposited map (EMD-30127, grey) b SMOCf plot of the AlphaFold2 (shown in blue) and TEMPy-ReFF refined model (shown in orange). The regions highlighted in grey and pink (correspond to inset regions in Fig. 7d) contain residues that are not present in the deposited model but are present in the AlphaFold2 model and are well-fitted to the map. c Deposited model for the SARS-CoV-2 RNA polymerase (PDB ID: 6M71, blue) fitted in the deposited map (transparent grey). Unassigned regions are visible, at the top and bottom right of the map. d TEMPy-ReFF model (orange) obtained by refining the AlphaFold2 prediction in the deposited map (transparent grey). Newly modelled regions that fit in the density (as in Fig. 6h) are shown with coloured squares.

Similar articles

Cited by

References

    1. van Zundert GydoCP, Bijvoet Center for Biomolecular Research, Faculty of Science-Chemistry, Utrecht University, Utrecht, the Netherlands. Bonvin AlexandreMJJ. Fast and sensitive rigid-body fitting into cryo-EM density maps with PowerFit. AIMS Biophys. 2015;2:73–87. doi: 10.3934/biophy.2015.2.73. - DOI
    1. Nicholls RA, Tykac M, Kovalevskiy O, Murshudov GN. Current approaches for the fitting and refinement of atomic models into cryo-EM maps using CCP-EM. Acta Crystallogr. D Struct. Biol. 2018;74:492–505. doi: 10.1107/S2059798318007313. - DOI - PMC - PubMed
    1. Ahmed A, Whitford PC, Sanbonmatsu KY, Tama F. Consensus among flexible fitting approaches improves the interpretation of cryo-EM data. J. Struct. Biol. 2012;177:561–570. doi: 10.1016/j.jsb.2011.10.002. - DOI - PMC - PubMed
    1. Singharoy A. et al. Molecular dynamics-based refinement and validation for sub-5 Å cryo-electron microscopy maps. Elife. 5, e16105 (2016). - PMC - PubMed
    1. Chen JZ, Fürst J, Chapman MS, Grigorieff N. Low-resolution structure refinement in electron microscopy. J. Struct. Biol. 2003;144:144–151. doi: 10.1016/j.jsb.2003.09.008. - DOI - PubMed