CHART: a novel system for detector evaluation against toxic chemical aerosols
- PMID: 38200048
- PMCID: PMC10781669
- DOI: 10.1038/s41598-023-50718-9
CHART: a novel system for detector evaluation against toxic chemical aerosols
Abstract
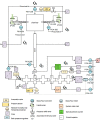
Concern over the possibility of deliberate dispersion of chemical warfare agents and highly toxic pharmaceutical based agents as persistent aerosols has raised the need for experimental assessment of current and future defensive capabilities of armed forces and law enforcement agencies. Therefor we herewith present the design, realization and validation of the Chemical Hot Aerosol Research Tool (CHART) as a validated and safe experimental set-up for performance evaluation of chemical detection and identification equipment against chemical warfare agents and other highly toxic compounds. In the CHART liquid and solid compounds in solution or suspension are being dispersed as aerosols in a nebulization chamber. A broad dynamic particle size range can be generated, including particles known to be able to reach the lower respiratory tract. The aerosol generated is presented to the detection system-under-test while being monitored and characterized in real-time, using an optical particle counter and a time-of-flight aerosol analyzer, respectively. Additionally, the chemical composition of the aerosol is ex situ measured by analytical chemical methods. Evidently, in the design of the CHART significant emphasis was placed on laboratory safety and containment of toxic chemicals. The CHART presented in this paper has proven to be an indispensable experimental tool to study detectors and fieldable identification equipment against toxic chemical aerosols.
© 2024. The Author(s).
Conflict of interest statement
The authors declare no competing interests.
Figures


Similar articles
-
Gas-particle partitioning of semivolatile organic compounds (SOCs) on mixtures of aerosols in a smog chamber.Environ Sci Technol. 2003 Sep 15;37(18):4113-21. doi: 10.1021/es026287c. Environ Sci Technol. 2003. PMID: 14524443
-
Evaluation of cell sorting aerosols and containment by an optical airborne particle counter.Cytometry A. 2015 Aug;87(8):784-9. doi: 10.1002/cyto.a.22684. Epub 2015 May 26. Cytometry A. 2015. PMID: 26012776
-
Characterization of Experimental and Clinical Bioaerosol Generation During Potential Aerosol-Generating Procedures.Chest. 2020 Dec;158(6):2467-2473. doi: 10.1016/j.chest.2020.07.026. Epub 2020 Jul 21. Chest. 2020. PMID: 32707180 Free PMC article.
-
Methods for characterization of organic compounds in atmospheric aerosol particles.Anal Bioanal Chem. 2015 Aug;407(20):5877-97. doi: 10.1007/s00216-014-8394-3. Epub 2014 Dec 27. Anal Bioanal Chem. 2015. PMID: 25542579 Review.
-
Medical management of the traumatic consequences of civil unrest incidents: causation, clinical approaches, needs and advanced planning criteria.Toxicol Rev. 2006;25(3):155-97. doi: 10.2165/00139709-200625030-00003. Toxicol Rev. 2006. PMID: 17192122 Review.
References
-
- Jindal MK, Mainuddin M, Veerabuthiran S, Razdan AK. Laser-based systems for standoff detection of CWA: A short review. IEEE Sens. J. 2021;21:4085–4096. doi: 10.1109/JSEN.2020.3030672. - DOI
Grants and funding
LinkOut - more resources
Full Text Sources

