. 2024 Jan 10;10(1):18.
doi: 10.1038/s41531-023-00628-4.

Candidate biomarkers of EV-microRNA in detecting REM sleep behavior disorder and Parkinson's disease

Affiliations

Candidate biomarkers of EV-microRNA in detecting REM sleep behavior disorder and Parkinson's disease

Yuanyuan Li et al. NPJ Parkinsons Dis. .

Abstract

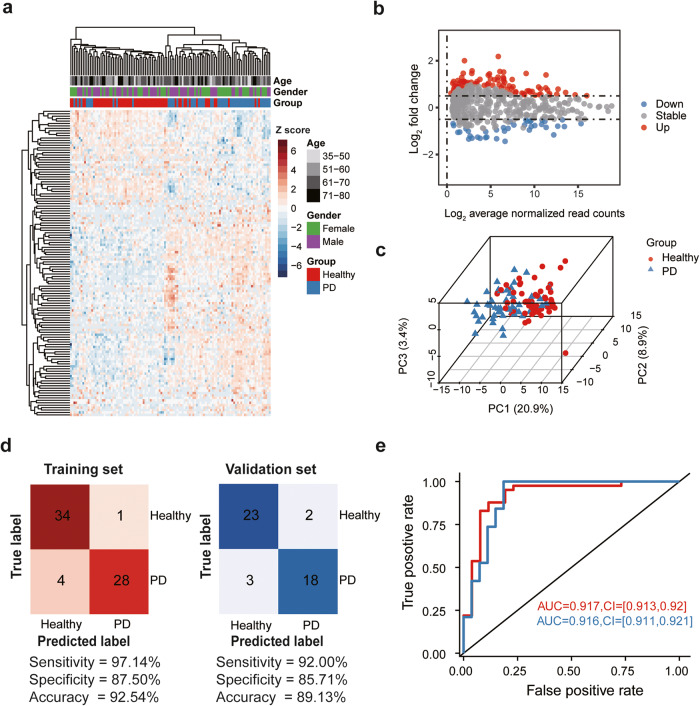
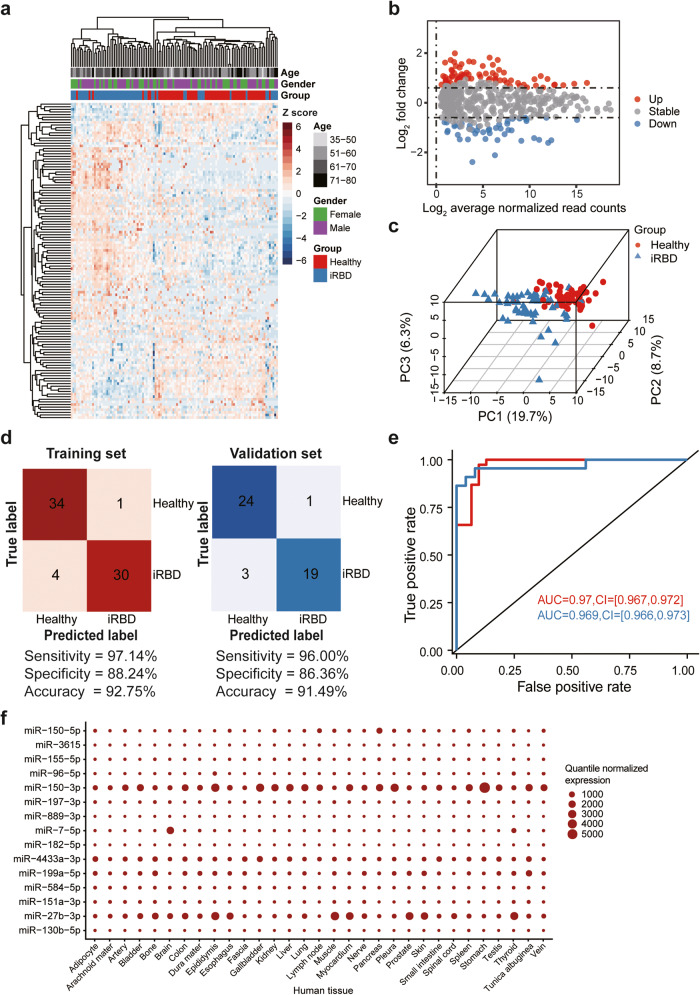
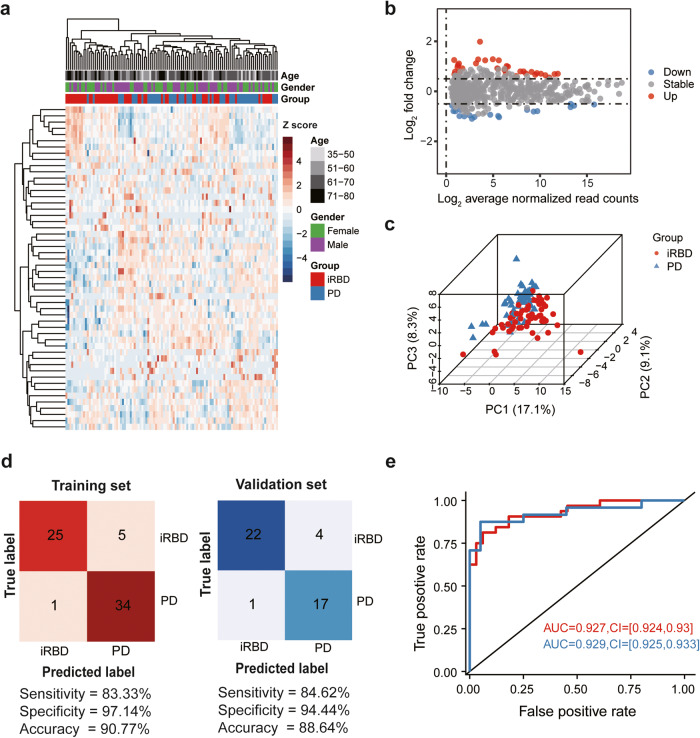
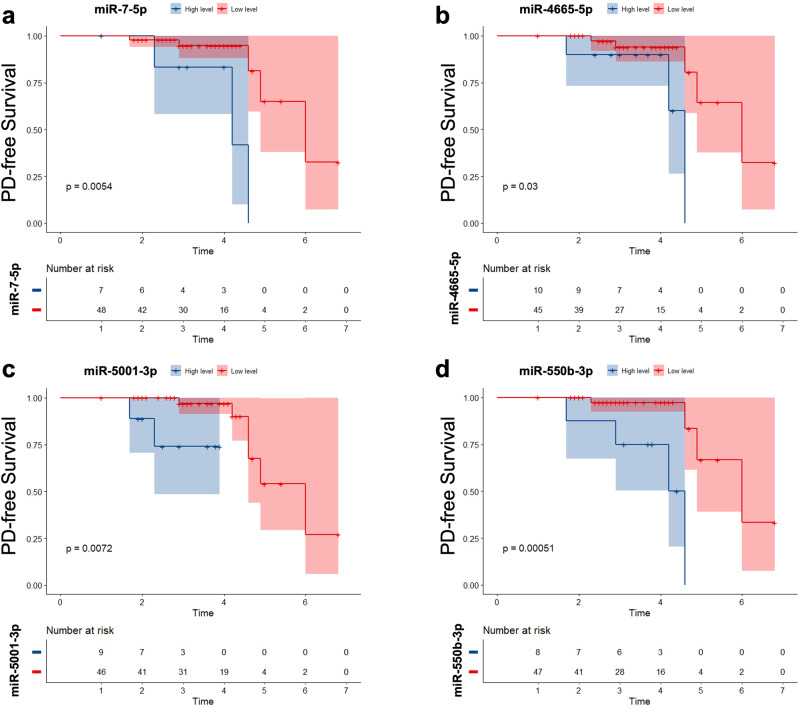
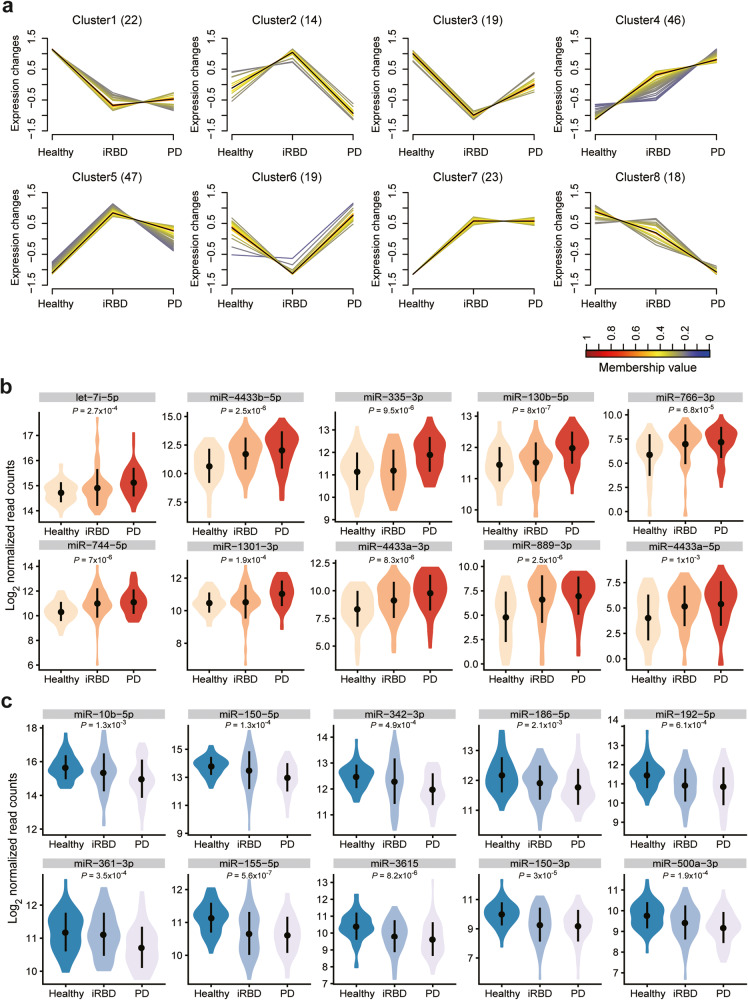
Parkinson's disease (PD) lacks reliable, non-invasive biomarker tests for early intervention and management. Thus, a minimally invasive test for the early detection and monitoring of PD and REM sleep behavior disorder (iRBD) is a highly unmet need for developing drugs and planning patient care. Extracellular vehicles (EVs) are found in a wide variety of biofluids, including plasma. EV-mediated functional transfer of microRNAs (miRNAs) may be viable candidates as biomarkers for PD and iRBD. Next-generation sequencing (NGS) of EV-derived small RNAs was performed in 60 normal controls, 56 iRBD patients and 53 PD patients to profile small non-coding RNAs (sncRNAs). Moreover, prospective follow-up was performed for these 56 iRBD patients for an average of 3.3 years. Full-scale miRNA profiles of plasma EVs were evaluated by machine-learning methods. After optimizing the library construction method for low RNA inputs (named EVsmall-seq), we built a machine learning algorithm that identified diagnostic miRNA signatures for distinguishing iRBD patients (AUC 0.969) and PD patients (AUC 0.916) from healthy individuals; and PD patients (AUC 0.929) from iRBD patients. We illustrated all the possible expression patterns across healthy-iRBD-PD hierarchy. We also showed 20 examples of miRNAs with consistently increasing or decreasing expression levels from controls to iRBD to PD. In addition, four miRNAs were found to be correlated with iRBD conversion. Distinct characteristics of the miRNA profiles among normal, iRBD and PD samples were discovered, which provides a panel of promising biomarkers for the identification of PD patients and those in the prodromal stage iRBD.


Conflict of interest statement

The authors declare no competing interests.

Figures

Fig. 1
Fig. 1. EV-associated miRNA biomarkers for detecting PD.
a Unsupervised clustering heatmap of differentially expressed miRNAs for PD patients (blue) and healthy individuals (red). Each row represents a differentially expressed miRNA. b MA-plot of differentially expressed miRNAs between PD patients and healthy individuals by transforming read abundance onto M (log2 fold change) and A (log2 average normalized read counts) scales. Up- or down-regulated miRNAs are shown in red or blue, respectively. c Three-dimensional scatter plot of principal component analysis (PCA) for the differentially expressed miRNAs between PD patients and healthy individuals. The percentage of variance explained by PC1, PC2, and PC3 are shown in the label. d Confusion matrix of the support vector machine (SVM) classifier for PD patients and healthy individuals in the training set (left) and validation set (right). The sensitivity, specificity, and accuracy are shown at the bottom. e The receiver operating characteristic (ROC) curve of the SVM classifier in the training set (Red, n = 67) and validation set (blue, n = 46). The values of area under the curve (AUC) and 95% confidence interval (CI) are shown in the plot.
Fig. 2
Fig. 2. EV-associated miRNA biomarkers for detecting iRBD.
a Unsupervised clustering heatmap of differentially expressed miRNAs of iRBD patients and healthy individuals (red). Each row represents a differentially expressed miRNA. b MA-plot of the differentially expressed miRNAs between iRBD patients and healthy individuals. The up- or down-regulated miRNAs are shown in red or blue, respectively. c Three-dimensional scatter plot of PCA for the differentially expressed miRNAs between iRBD patients and healthy individuals. d Confusion matrix of the SVM classifier for iRBD patients and healthy individuals in the training set (left) and validation set (right). The sensitivity, specificity, and accuracy are shown at the bottom. e The ROC curve of the SVM classifier in training set (red, n = 69) and validation set (blue, n = 47). The values of AUC and 95% confidence interval are shown in the plot. f The expression levels of PD- and iRBD-specific miRNA biomarkers in human tissues.
Fig. 3
Fig. 3. EV-associated miRNAs for distinguishing iRBD and PD.
a Unsupervised clustering heatmap of differentially expressed miRNAs in PD patients (blue) and iRBD patients (red). Each row represents a differentially expressed miRNA. b MA-plot of the differentially expressed miRNAs between PD patients and iRBD patients. The up- or down-regulated miRNAs are shown in red or blue, respectively. c Three-dimensional scatter plot of PCA for the differentially expressed miRNAs between PD patients and iRBD patients. d Confusion matrix of the SVM classifier for PD patients and iRBD patients in the training (left) and validation (right) sets. Sensitivity, specificity, and accuracy are shown at the bottom. e ROC curve of the SVM classifier in the training (red, n = 65) and validation (blue, n = 44) sets. AUC values and 95% confidence intervals are shown in the plot.
Fig. 4
Fig. 4. Longitudinal evaluation of candidate EV-miRNAs for conversion of iRBD.
Kaplan-Meier plot of disease-free survival of patients with idiopathic REM sleep behavior disorder (iRBD), stratified according to EV-miRNA levels. a EV miR-7-5p; b EV miR-4665-5p; c EV miR-5001-3p; d EV miR-550b-3p. The solid line indicates patients with less or equal relevant levels.
Fig. 5
Fig. 5. Identification of different miRNA expression patterns from healthy controls to iRBD to PD samples.
a An expression pattern composed of 8 different miRNAs were identified in healthy controls, iRBD and PD groups. The number of miRNA species in the clusters is indicated in the figure. Each line represents a specific miRNA. The black line represents the cluster center. The membership values of miRNAs and the cluster center are indicated by the color gradient. Examples of 10 miRNAs with an expression that progressively increases (b) or decreases (c) from healthy controls to iRBD to PD samples. The p-values of a Kruskal-Wallis rank sum test for comparisons among the three groups are shown in the boxplot for each miRNA. The mean and standard deviation of miRNA expression levels are shown in black.

Similar articles

Cited by

References

    1. de Lau LML, Breteler MMB. Epidemiology of Parkinson’s disease. Lancet Neurol. 2006;5:525–535. doi: 10.1016/S1474-4422(06)70471-9. - DOI - PubMed
    1. Ascherio A, Schwarzschild MA. The epidemiology of Parkinson’s disease: risk factors and prevention. Lancet Neurol. 2016;15:1257–1272. doi: 10.1016/S1474-4422(16)30230-7. - DOI - PubMed
    1. Matar E, Lewis SJ. REM sleep behaviour disorder: not just a bad dream. Med. J. Aust. 2017;207:262–268. doi: 10.5694/mja17.00321. - DOI - PubMed
    1. Kalia LV, Lang AE. Parkinson’s disease. Lancet. 2015;386:896–912. doi: 10.1016/S0140-6736(14)61393-3. - DOI - PubMed
    1. Miller DB, O’Callaghan JP. Biomarkers of Parkinson’s disease: present and future. Metabolism. 2015;64:S40–S46. doi: 10.1016/j.metabol.2014.10.030. - DOI - PMC - PubMed