. 2024 Jan 10;15(1):447.
doi: 10.1038/s41467-024-44732-2.

Disruption of lysosomal proteolysis in astrocytes facilitates midbrain organoid proteostasis failure in an early-onset Parkinson's disease model

Affiliations

Disruption of lysosomal proteolysis in astrocytes facilitates midbrain organoid proteostasis failure in an early-onset Parkinson's disease model

Gustavo Morrone Parfitt et al. Nat Commun. .

Abstract

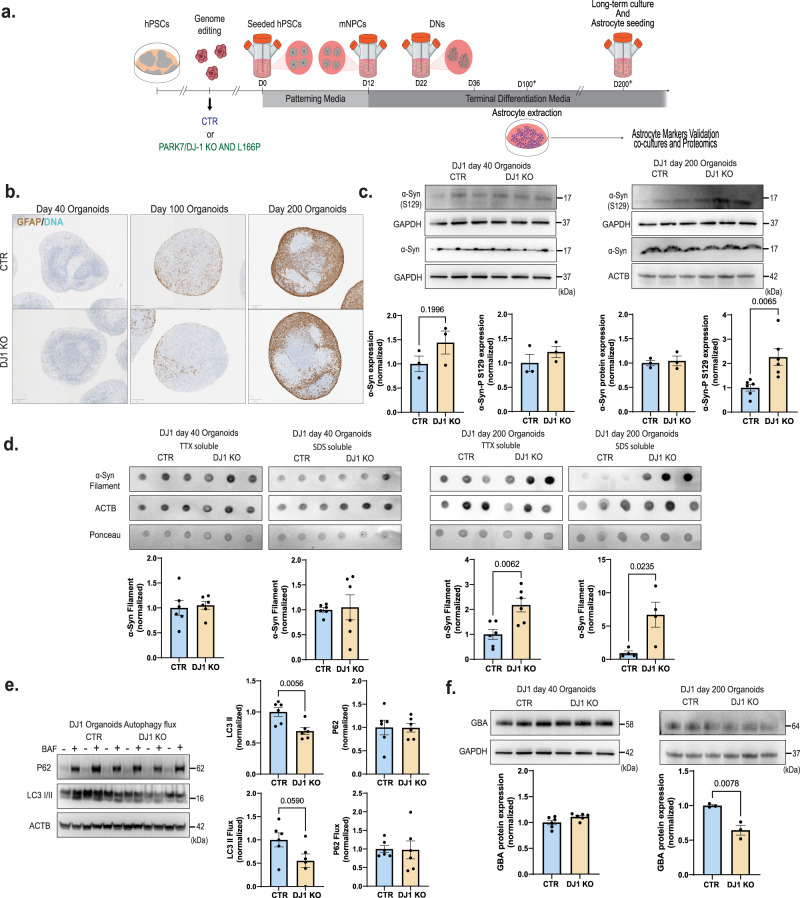
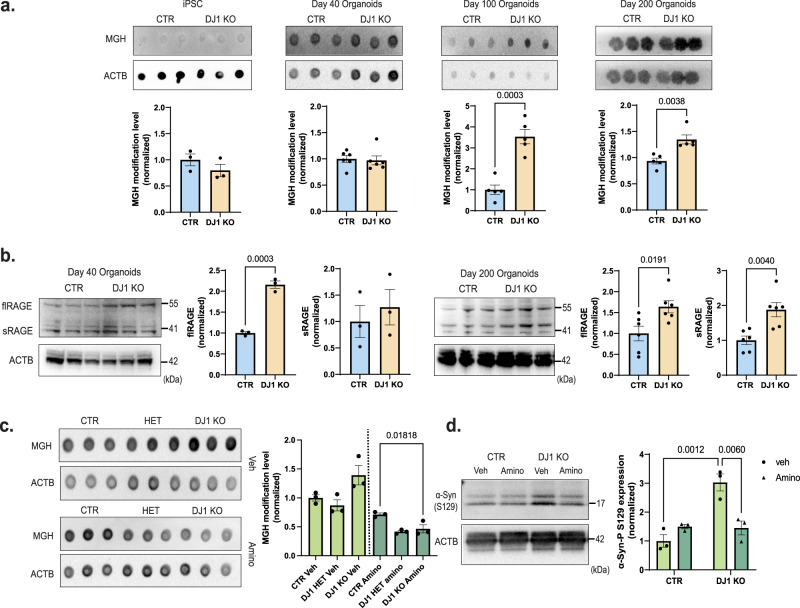
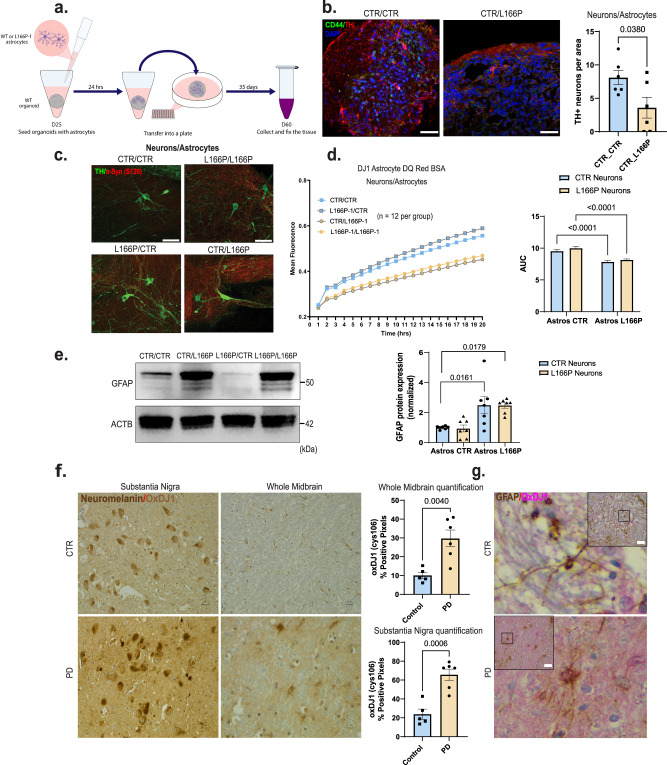
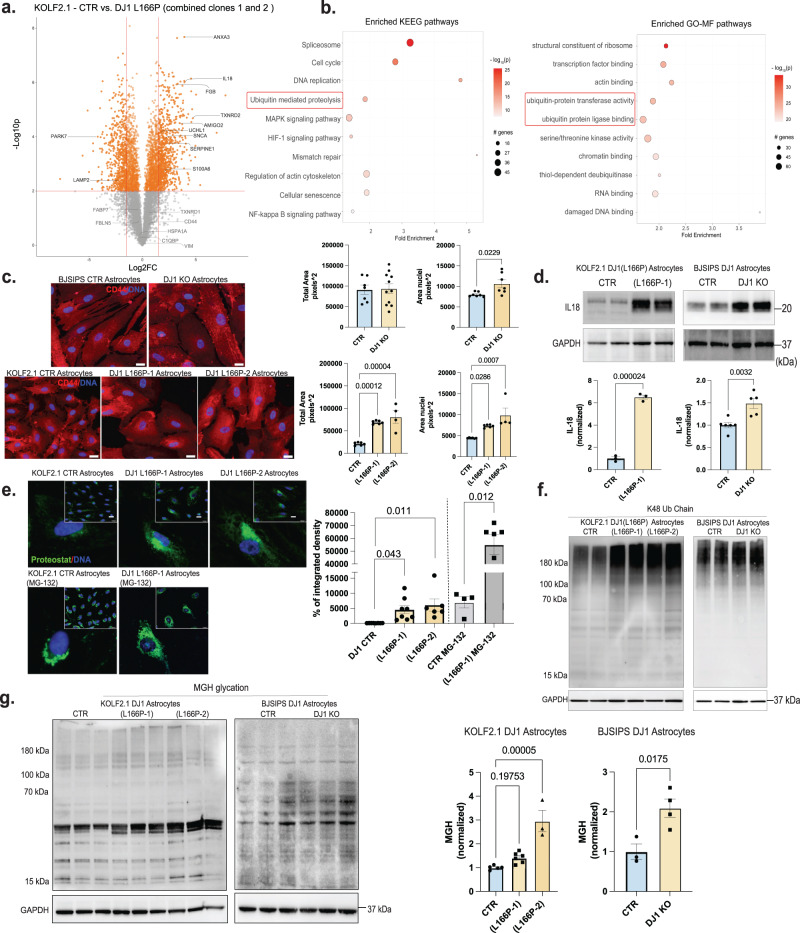
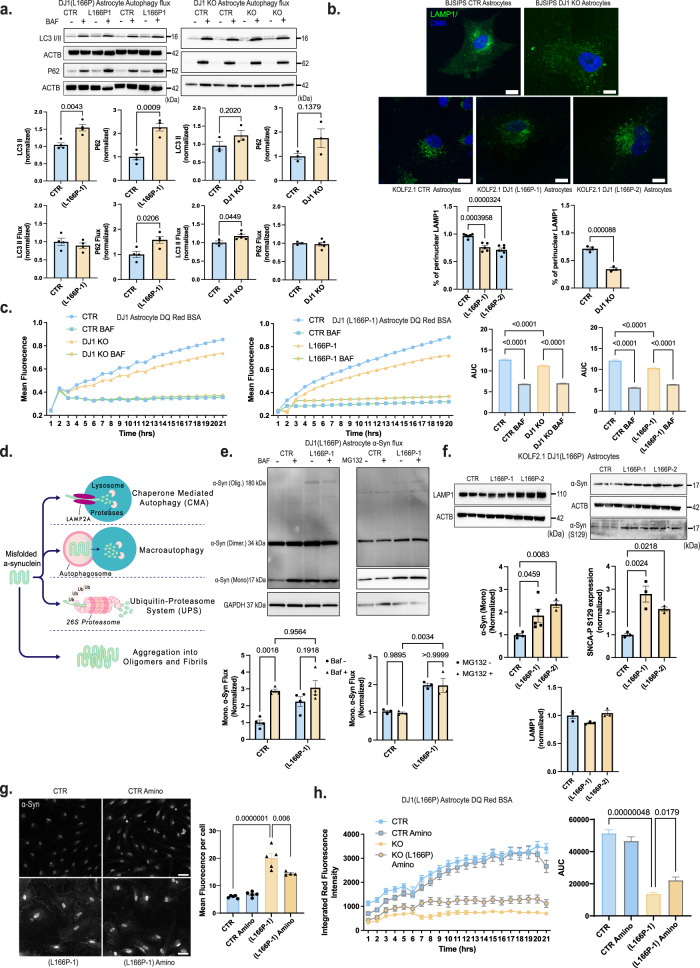
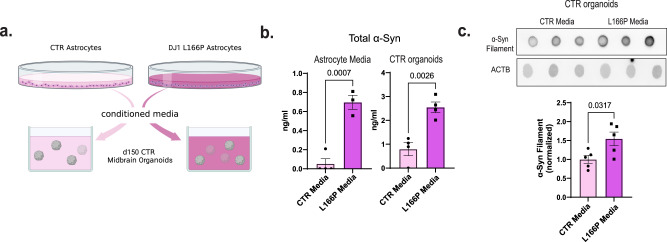
Accumulation of advanced glycation end products (AGEs) on biopolymers accompanies cellular aging and drives poorly understood disease processes. Here, we studied how AGEs contribute to development of early onset Parkinson's Disease (PD) caused by loss-of-function of DJ1, a protein deglycase. In induced pluripotent stem cell (iPSC)-derived midbrain organoid models deficient for DJ1 activity, we find that lysosomal proteolysis is impaired, causing AGEs to accumulate, α-synuclein (α-syn) phosphorylation to increase, and proteins to aggregate. We demonstrated these processes are at least partly driven by astrocytes, as DJ1 loss reduces their capacity to provide metabolic support and triggers acquisition of a pro-inflammatory phenotype. Consistently, in co-cultures, we find that DJ1-expressing astrocytes are able to reverse the proteolysis deficits of DJ1 knockout midbrain neurons. In conclusion, astrocytes' capacity to clear toxic damaged proteins is critical to preserve neuronal function and their dysfunction contributes to the neurodegeneration observed in a DJ1 loss-of-function PD model.


Conflict of interest statement

The authors declare no competing interests.

Figures

Fig. 1
Fig. 1. DJ1 KO human midbrain organoids α-syn and autophagy phenotypes.
a Micrography GFAP staining of CTR and DJ1 KO day 40, 100, and 200 midbrain organoids. b Midbrain differentiation and astrocytes extraction protocol schematic. c Immunoblots for α-syn, phospho-α-syn (S129) (n = 3, Two-tailed t-test), and corresponding loading controls actin (ACTB) and GAPDH for CTR and DJ1 KO day 40 (α-syn n = 3, phospho-α-syn (S129), n = 3) and day 200 midbrain organoids (α-syn n = 3; phospho-α-syn (S129), n = 6). d Dot blots for oligomeric α-syn and actin (ACTB)/Ponceau loading control for CTR and DJ1 KO day 40 TTX soluble (n = 6); SDS soluble fractions (n = 6) and day 200 TTX soluble (n = 6) and SDS soluble fractions (n = 3) in midbrain organoids. e Immunoblots for LC3 I/II, P62, actin (ACTB) loading control in BAF – and + treated CTR and DJ1 KO day 100 midbrain organoids, graphs report LC3 I/II basal (n = 6), LC3 I/II flux (n = 6), P62 basal (n = 6), P62 flux (n = 6). f Immunoblots for GBA and ACTB/GAPDH loading control for CTR and DJ1 KO day 40 (n = 6) and day 200 (n = 3) midbrain organoids. All data are represented in mean ± S.E.M, data points are individual well differentiation, and the p-value was reported on the graph highlighted comparison. For all the comparisons, a Two-tailed t-test was applied. Panels c and f share the same loading controls. All measurements were taken from distinct samples.
Fig. 2
Fig. 2. DJ1 KO midbrain organoids have increased protein glycation.
a Dot blots for MGH protein modification and actin (ACTB)/Ponceau loading control for CTR and DJ1 KO iPSCs (n = 3), day 40 (n = 6), 100 (n = 5), and 200 (n = 5) midbrain organoids (Two-tailed t-test was used for mean comparisons). b Immunoblots for flRAGE, for CTR and DJ1 KO day 40 (n = 3) and day 200 (n = 6) and sRAGE CTR and DJ1 KO day 40 (n = 3) and day 200 (n = 6) in midbrain organoids; actin (ACTB) was used as loading control (Two-tailed t-test was used for mean comparisons). c Dot blots for MGH protein modification and actin (ACTB) loading control in vehicle (Veh) or aminoguanidine (Amino) treated CTR and DJ1 KO day 100 midbrain organoids (n = 3, Two-way ANOVA followed by Tukey’s for the multiple comparisons test). d Immunoblots for phospho-α-syn (S129) and actin (ACTB) loading control in vehicle (Veh) or aminoguanidine (Amino) treated CTR and DJ1 KO day 200 midbrain organoids (n = 3, Two-way ANOVA followed by Bonferroni’s for the multiple comparisons test). All data are represented in mean ± S.E.M, data points are individual well differentiation, and the p-value was reported on the graph highlighted comparison. All measurements were taken from distinct samples.
Fig. 3
Fig. 3. Astrocyte DJ1 LOF are reactive and produce toxicity in the midbrain.
a Astrocytes seeding procedure schematic. b Images of organoids seeded with astrocytes stained for TH (Red), CD44 (green), and DAPI and quantification of TH+ positive neurons per organoid area (n = 6, Two-tailed t-test was used for mean comparisons). c 40× images of day 50 NPC/Astrocyte co-cultures stained for TH (green), phospho-α-syn (S129) (Red). d DQ BSA proteolysis live imaging in mixed genetic neuron/astrocytes co-cultures (n = 12, Two-way ANOVA followed by Tukey’s for the multiple comparisons test). e Western blot for GFAP and actin (ACTB) loading control for Neurons/Astrocytes co-cultures and quantification (n = 7, Two-way ANOVA followed by Tukey’s for the multiple comparisons test). f 40× micrography of the substantia nigra and midbrain of PD patients and age-matched controls showing OxDJ1 staining in light brown. QuPAth of OxDJ1 positive pixel quantification (CTR n = 5 and PD n = 6, Two-tailed t test was used for mean comparisons). g 40× micrography GFAP positive midbrain astrocytes (brown) and OxDJ1 (red). All data are represented in mean ± S.E.M. Scale bars, 50 µm for (c), (f), and (g); 70 µm for (b). Data points are individual well differentiation or individual patients, and the p-value was reported on the graph highlighted comparison. All measurements were taken from distinct samples.
Fig. 4
Fig. 4. Pro-inflammatory and aggregated proteins are increased in DJ1 LOF astrocytes.
a Volcano plot representation of TMT-labelled proteomics in KOLF 2.1 J (n = 3) and DJ1 L166P-1 (n = 3) and L166P-2 (n = 3) midbrain astrocytes with selected proteins labeled (fold prioritization of LogFC vs. control of 1.5; Welch’s t-test was used for the comparisons). b KEEG and FO-MF pathways enrichment analysis using pathfindR (p values were adjusted by the Bonferroni method) showing the selected top 10 terms. c 40× micrography of CD44 (red) and DAPI (blue) staining in BJ-SiPS CTR (n = 7) and KO (n = 11) astrocytes (Two-tailed t-test was used for mean comparisons) and KOLF 2.1 J CTR (n = 6), DJ1 L166P-1 (n = 6), and L166P-2 (n = 4) astrocytes (One-way ANOVA followed by Tukey’s for the multiple comparisons test). Quantification of cell total area based on CD44 staining and nuclear area based on DAPI staining. d IL18 in BJ-SIPS CTR (n = 6) and KO (n = 5) astrocytes and KOLF 2.1 J CTR (n = 3), DJ1 L166P-1 (n = 3) astrocytes (Two-tailed t-test was used for mean comparisons). e 40x micrography and quantification proteostat fluorescence levels in KOLF 2.1 J CTR (n = 8), L166P-1 (n = 8) and L166P-2 (n = 6) (One-way ANOVA followed by Tukey’s for the multiple comparisons test). 40× micrography and quantification proteostat fluorescence levels in KOLF 2.1 J CTR + MG132 (n = 4), DJ1 L166P (n = 60) (Two-tailed t-test was used for mean comparisons). f Immunoblots for K48 ubiquitin chain and g MGH protein modification in KOLF 2.1 J CTR (n = 5), L166P-1 (n = 6), and L166P-2 (n = 3) (One-way ANOVA followed by Tukey’s for the multiple comparisons test). MGH protein modification in BJ-SIPS CTR (n = 3) and KO (n = 4) (Two-tailed t-test was used for mean comparisons). All data are represented in mean ± S.E.M., data points are individual well differentiation, and the p-value was reported on the graph highlighted comparison. Proteomics data related to KN073-96 dataset. Scale bars, 20 µm. All measurements were taken from distinct samples.
Fig. 5
Fig. 5. DJ1 loss of function impairs proteostasis in astrocytes.
a Immunoblots for P62, LC3 I/II, actin (ACTB) loading control in BAF – and + treated CTR and DJ1 KO in KOLF 2.1 J and BJ-SIPS midbrain astrocytes. Immunoblots for LC3 I/II, P62, actin (ACTB) loading control in BAF – and + treated KOLF 2.1 J CTR, DJ1 L166P-1 astrocytes, graphs report LC3 I/II basal (n = 4), LC3 I/II flux (n = 4), P62 basal (n = 4), P62 flux (n = 4). Immunoblots for LC3 I/II, P62, actin (ACTB) loading control in BAF – and + treated CTR and DJ1 KO astrocytes, graphs report LC3 I/II basal (n = 3), LC3 I/II flux (CTR, n = 3 and DJ1 KO, n = 5), P62 basal (n = 3), P62 flux (CTR, n = 3 and DJ1 KO, n = 5) (Two-tailed t-test was used for mean comparisons). b LAMP1 (green) and DAPI (blue) staining of astrocytes 40x images. Quantification of LAMP1 distribution staining in BJ-SiPS CTR (n = 3) and KO (n = 3) astrocytes (Two-tailed t-test was used for mean comparisons) and KOLF 2.1 J CTR (n = 6), DJ1 L166P-1 (n = 5), and L166P-2 (n = 7) astrocytes (One-way ANOVA followed by Tukey’s). c DQBSA proteolysis live imaging assay treated CTR and DJ1 L166P-1 KOLF 2.1 J astrocytes (BAF −, n = 40, BAF + n = 7) or CTR and DJ1 KO BJ-SIPS (BAF −, n = 39, BAF + n = 8) treated with BAF- and BAF + astrocytes (Two-way ANOVA followed by Tukey’s). d Schematics showing α-syn degradation pathways. e Immunoblots for α-syn in BAF (n = 4) and MG132 (n = 3) – and + treated CTR and DJ1 L166P-1 KOLF 2.1 J astrocytes (Two-way ANOVA followed by Tukey’s). f Immunoblots for LAMP1 (n = 3), α-syn (CTR, n = 3; L166P-1, n = 5; and L166P-2, n = 3), phospho-α-syn (S129) (n = 3), and GAPDH loading control in and KOLF 2.1 J CTR, L166P-1, and L166P-2 astrocytes (One-way ANOVA followed by Tukey’s). g 40× images of total α-syn (gray) staining of astrocytes and quantification of vehicle (Veh) or aminoguanidine (Amino) treated astrocytes of CTR (CTR, n = 5; and CTR Amino, n = 5) or DJ1 L166P genotypes (L166P-1, n = 5; and L166P-1 Amino, n = 4) (Two-way ANOVA followed by Tukey’s). h DQBSA proteolysis live imaging assay of vehicle (Veh) or aminoguanidine (Amino) treated astrocytes of CTR or DJ1 L166P-1 genotypes (n = 24, Two-way ANOVA followed by Tukey’s). Scale bars, for b-15 µm; g-40 µm. All data are represented in mean ± S.E.M., data points are individual well differentiation, and the p-value was reported on the graph highlighted comparison. All measurements were taken from distinct samples.
Fig. 6
Fig. 6. Astrocyte DJ1 loss of function conditioned media leads to α-syn increase in midbrain organoids.
a Experimental design for conditioned media experiment, created with BioRender.com. b Competitive ELISA test for α-syn in media (CTR Media, n = 3; and L166P-1 Media, n = 4) and CTR organoid tissue (n = 4). c Dot blots for oligomeric α-syn and actin (ACTB) loading control for CTR (n = 5) and L166P (n = 5) astrocyte media treated midbrain organoids. All data are represented in mean ± S.E.M., data points are individual well differentiation, and the p-value was reported on the graph highlighted comparison. All measurements were taken from distinct samples. For all the comparisons, a Two-tailed t-test was applied.

Similar articles

Cited by

References

    1. Reeve A, Simcox E, Turnbull D. Ageing and Parkinson’s disease: why is advancing age the biggest risk factor? Ageing Res. Rev. 2014;14:19–30. doi: 10.1016/j.arr.2014.01.004. - DOI - PMC - PubMed
    1. Chaudhuri, J. et al. The role of advanced glycation end products in aging and metabolic diseases: bridging association and causality. Cell Metabolism28, 337–352 (2018). - PMC - PubMed
    1. Billingsley, K. J., Bandres-Ciga, S., Saez-Atienzar, S. & Singleton, A. B. Genetic risk factors in Parkinson’s disease. Cell Tissue Res.373, 9–20 (2018). - PMC - PubMed
    1. Schneider SA, Hizli B, Alcalay RN. Emerging targeted therapeutics for genetic subtypes of Parkinsonism. Neurotherapeutics. 2020;17:1378–1392. doi: 10.1007/s13311-020-00920-8. - DOI - PMC - PubMed
    1. Stojkovska, I. et al. Rescue of α-synuclein aggregation in Parkinson’s patient neurons by synergistic enhancement of ER proteostasis and protein trafficking. Neuron10.1016/j.neuron.2021.10.032 (2021). - PMC - PubMed