. 2024 Nov;42(11):1726-1734.
doi: 10.1038/s41587-023-02082-2. Epub 2024 Jan 10.

Prediction of single-cell RNA expression profiles in live cells by Raman microscopy with Raman2RNA

Affiliations

Prediction of single-cell RNA expression profiles in live cells by Raman microscopy with Raman2RNA

Koseki J Kobayashi-Kirschvink et al. Nat Biotechnol. 2024 Nov.

Abstract

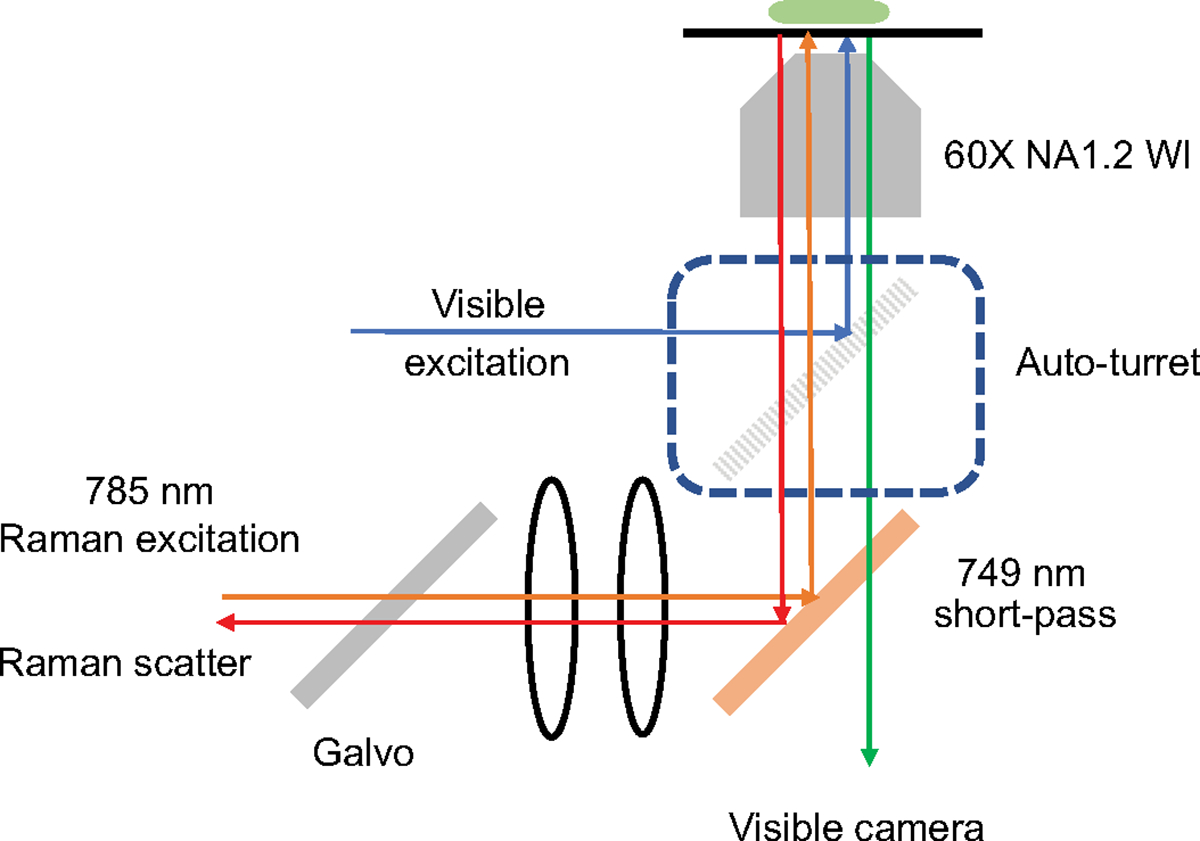
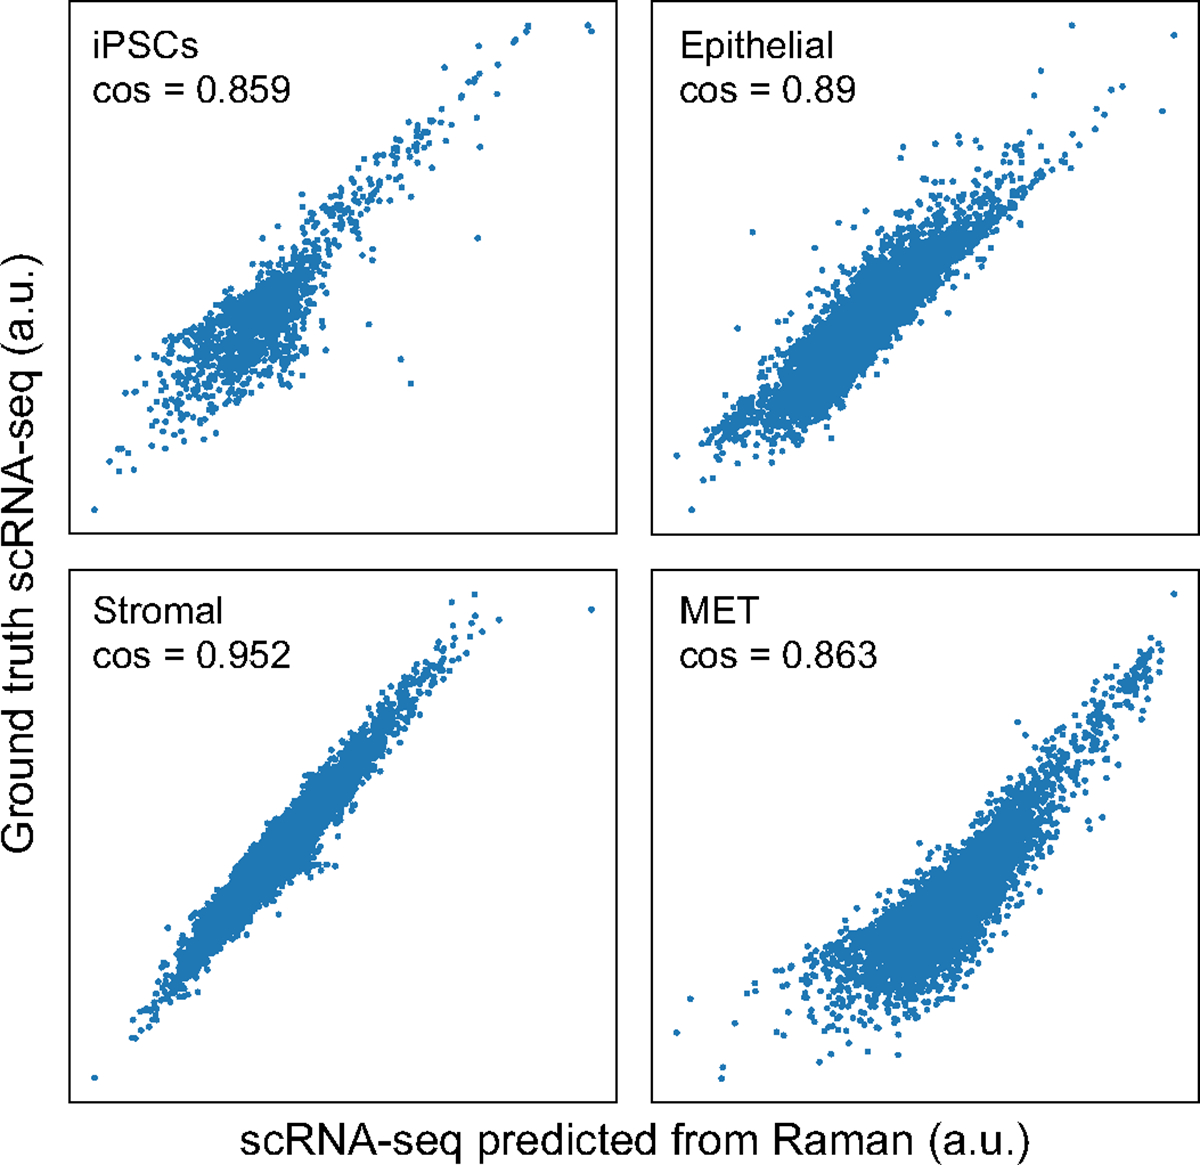
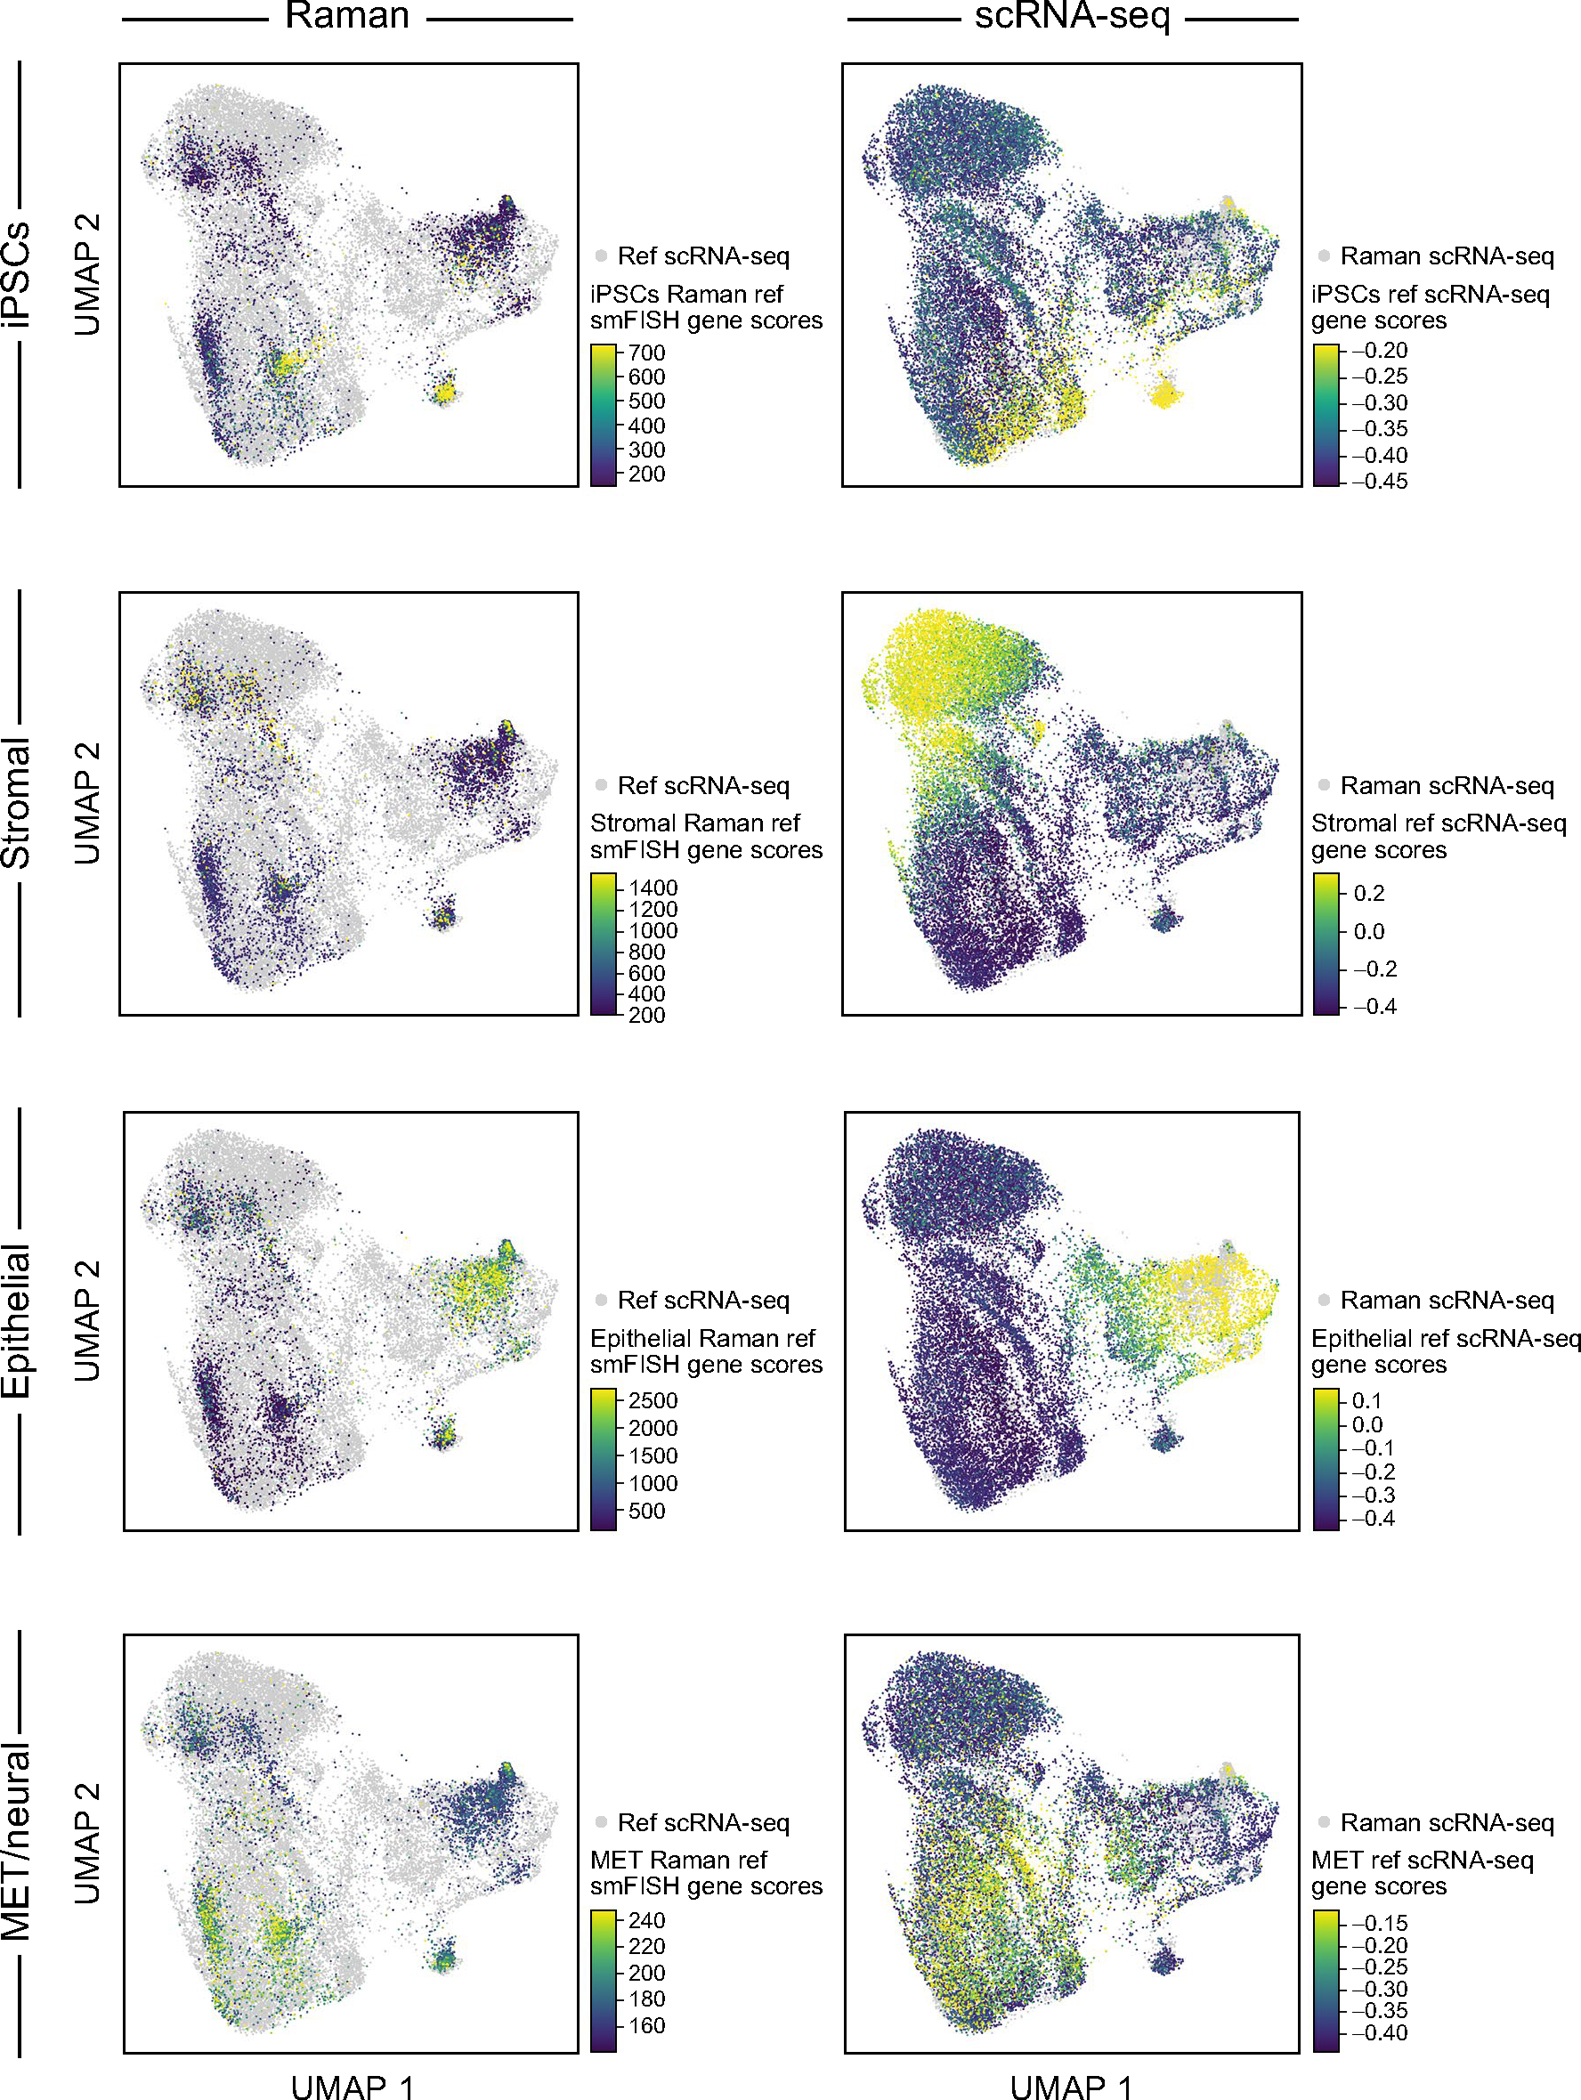
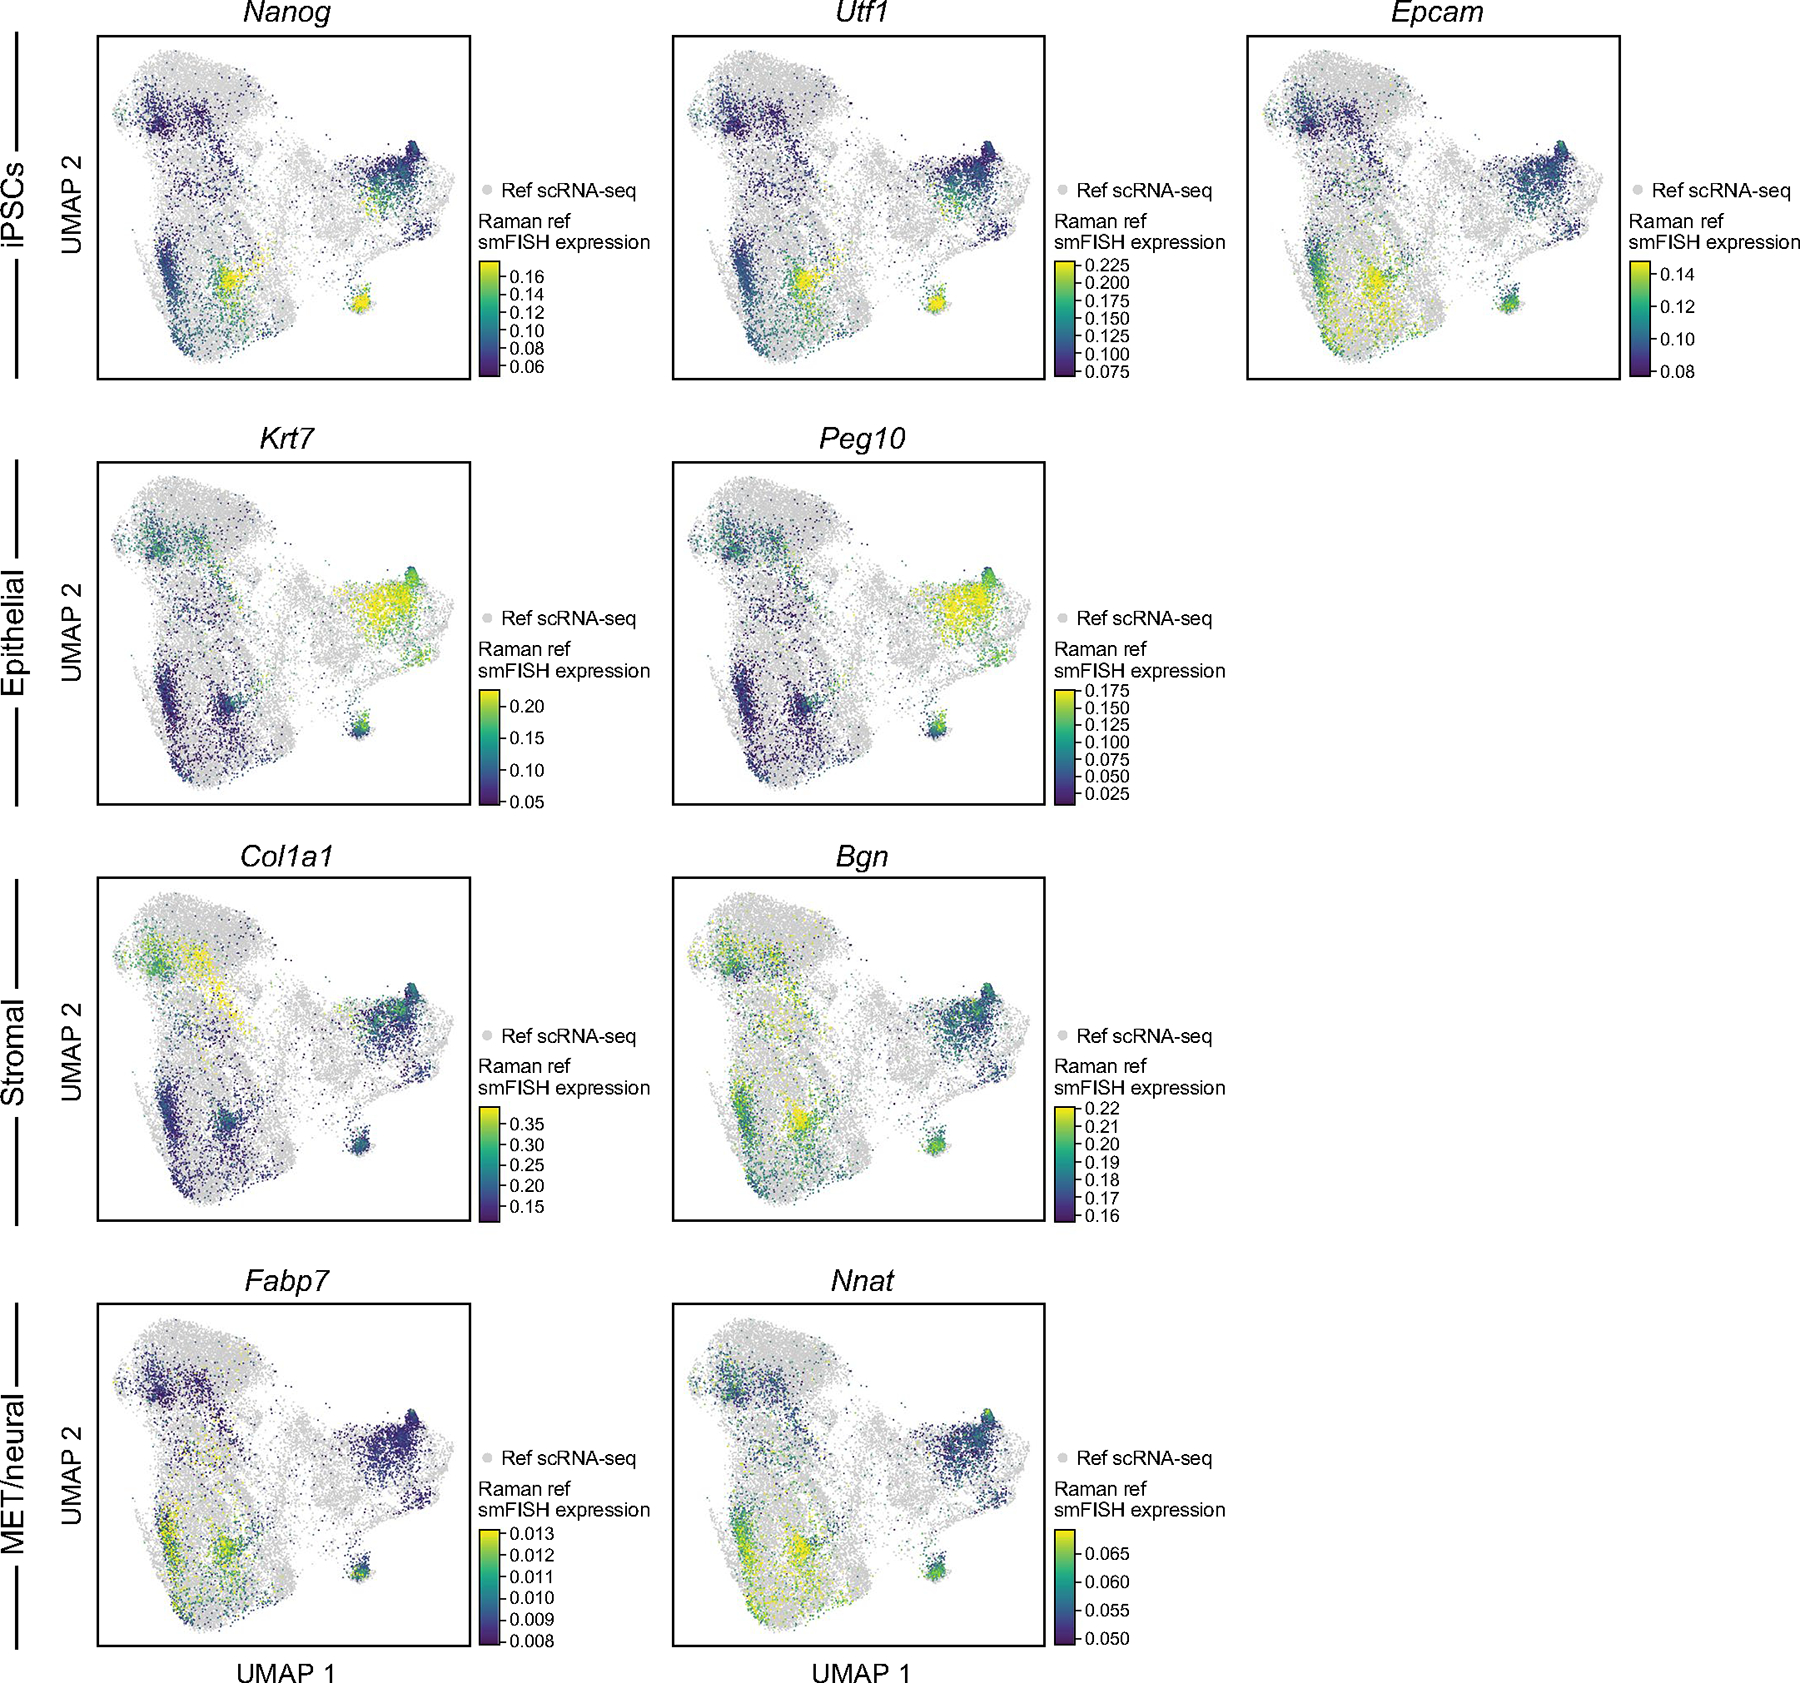
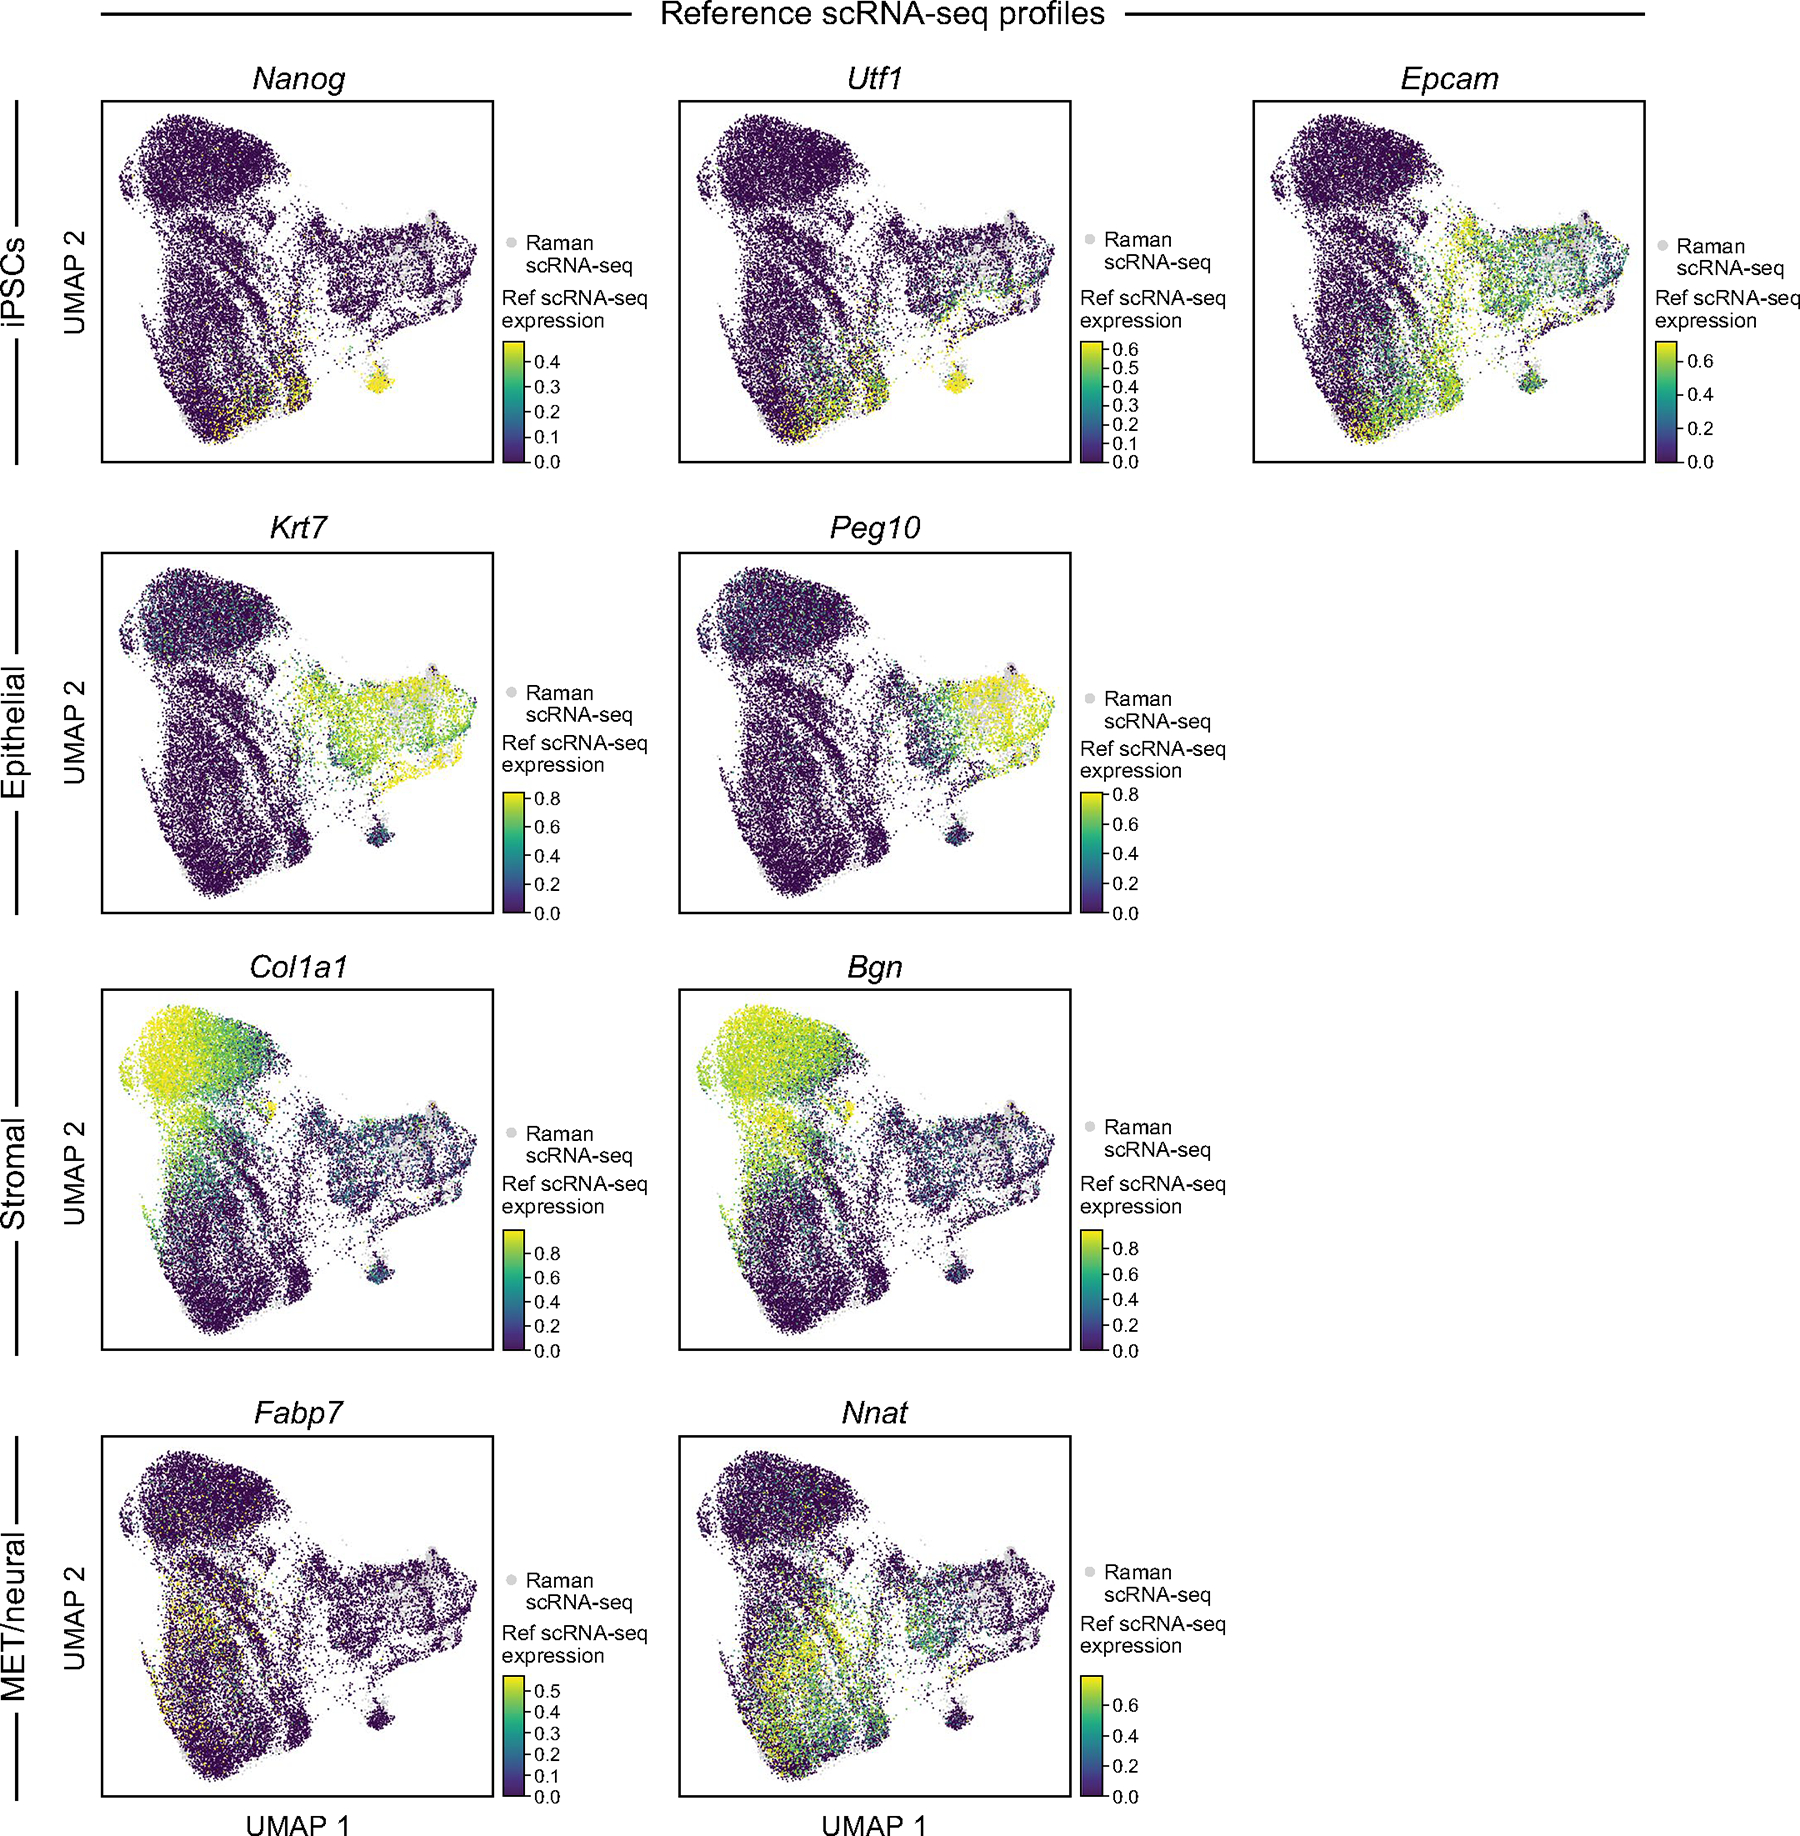
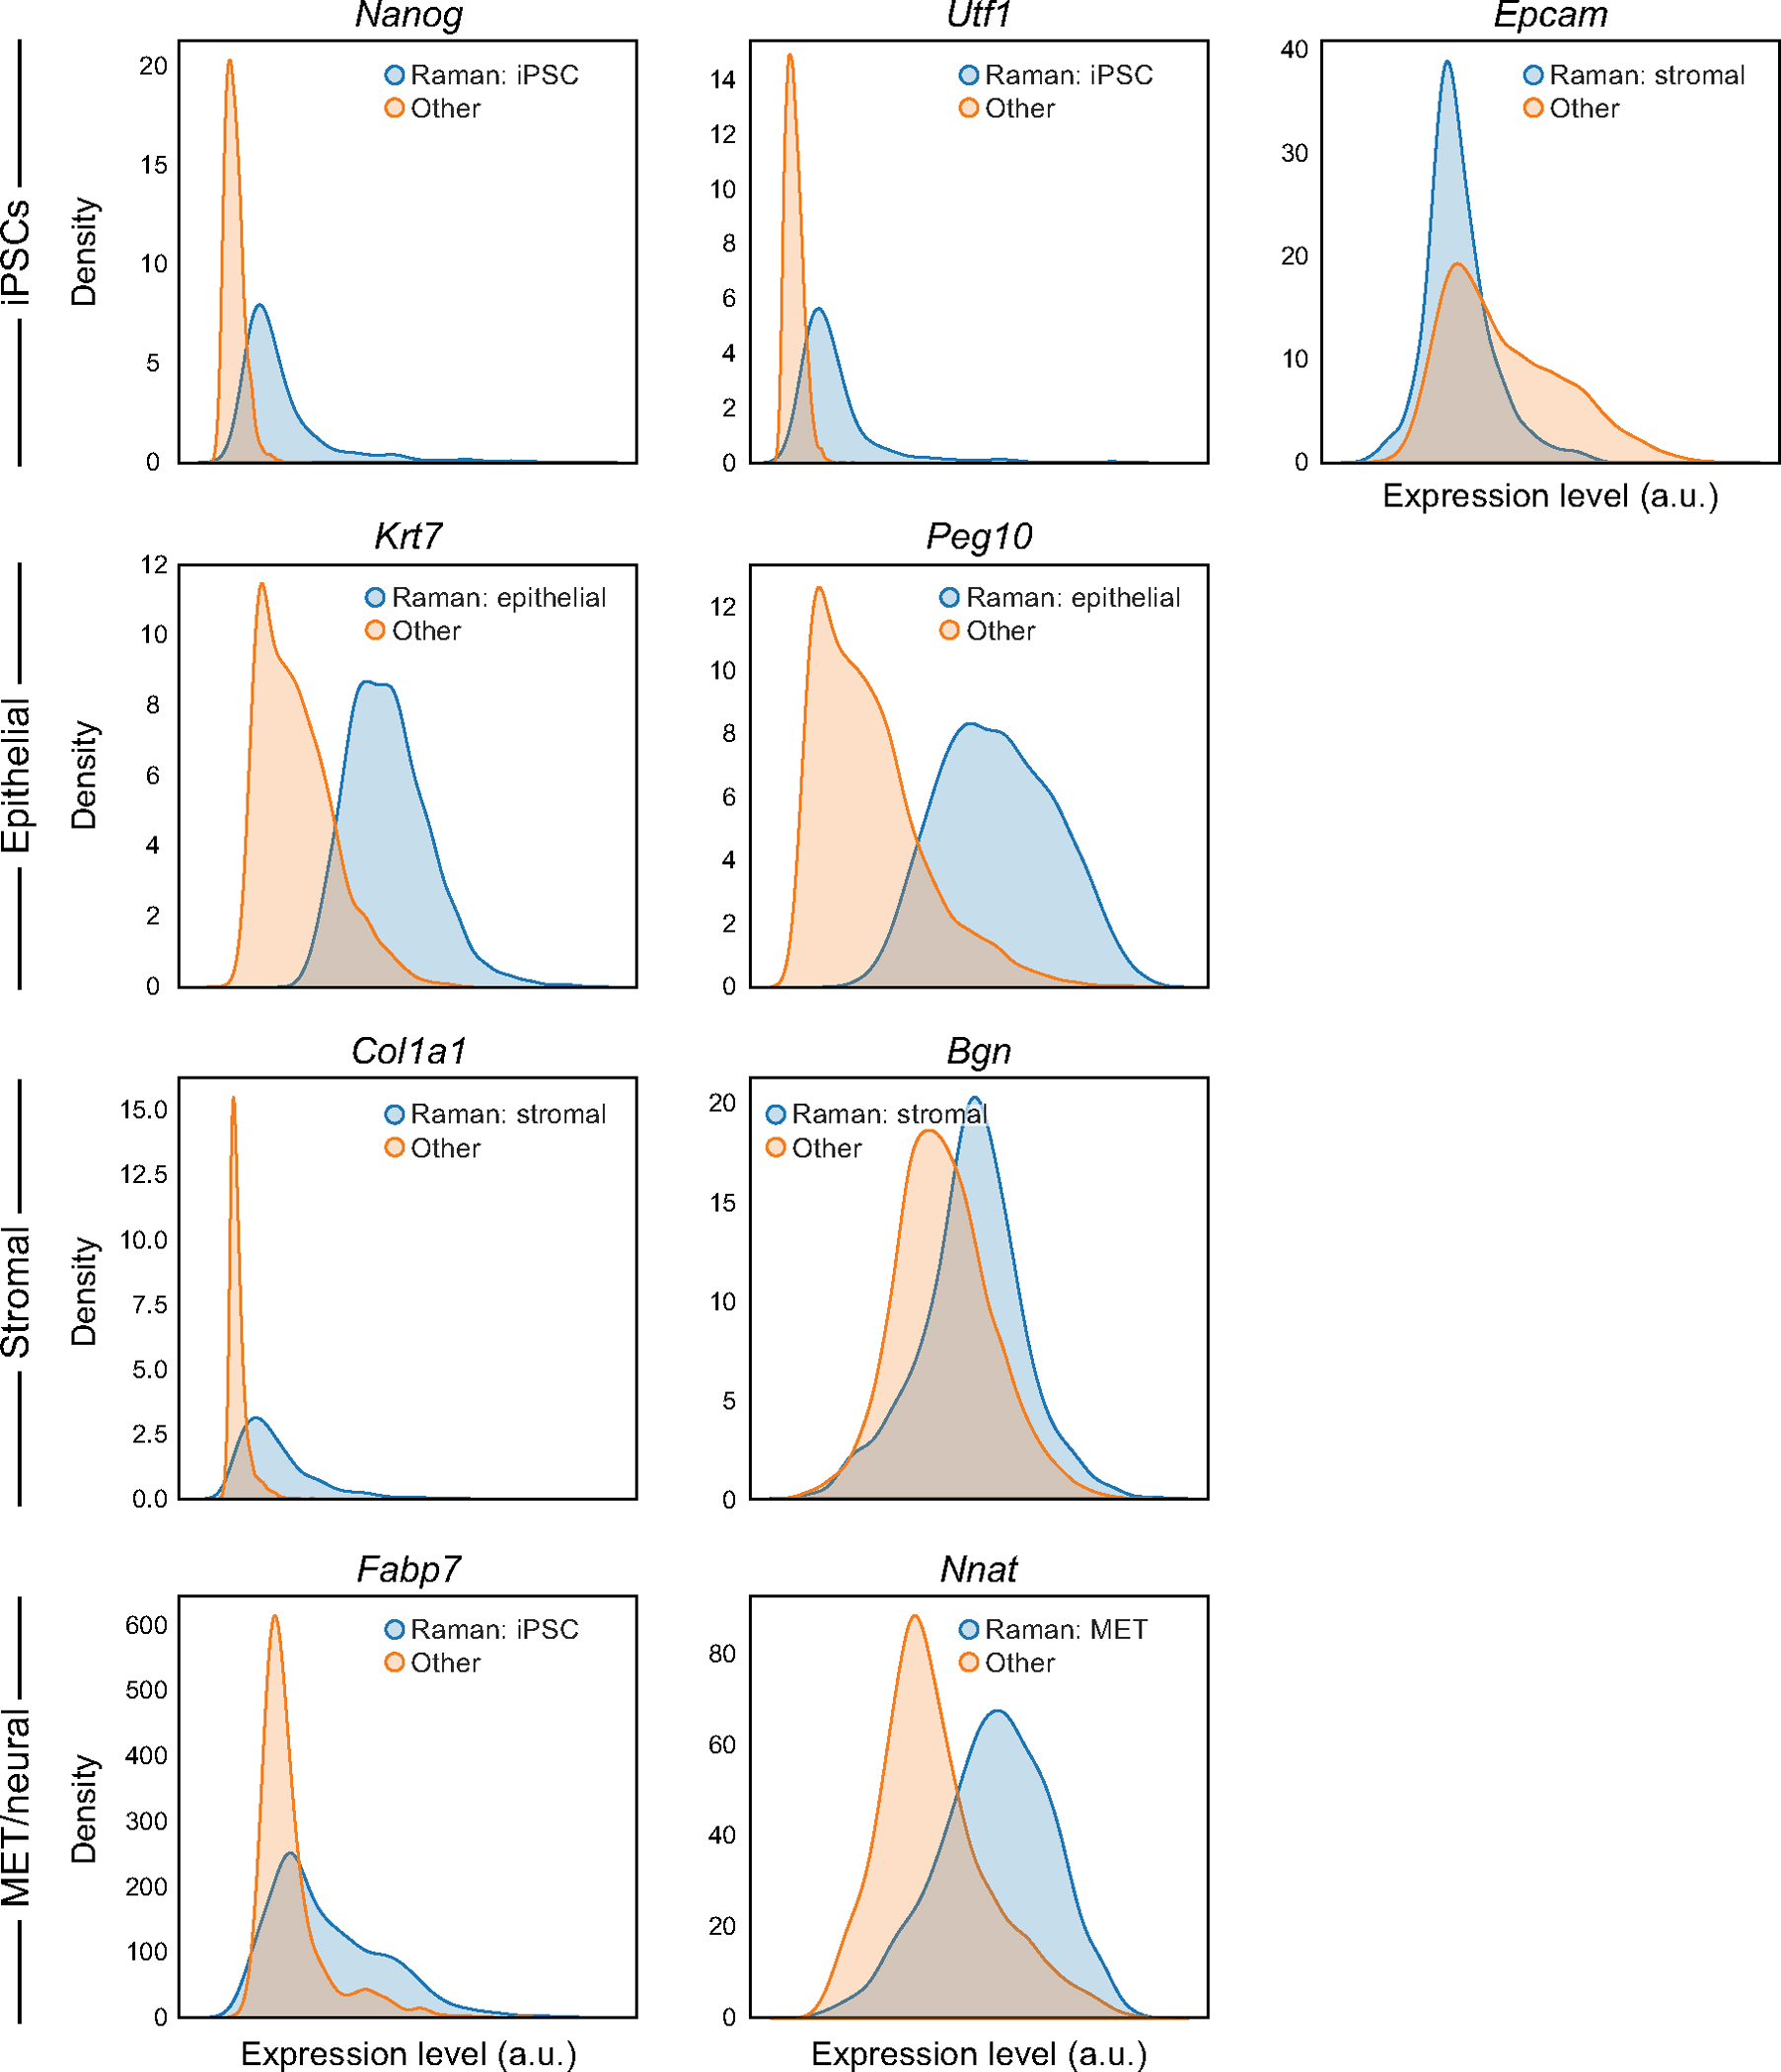
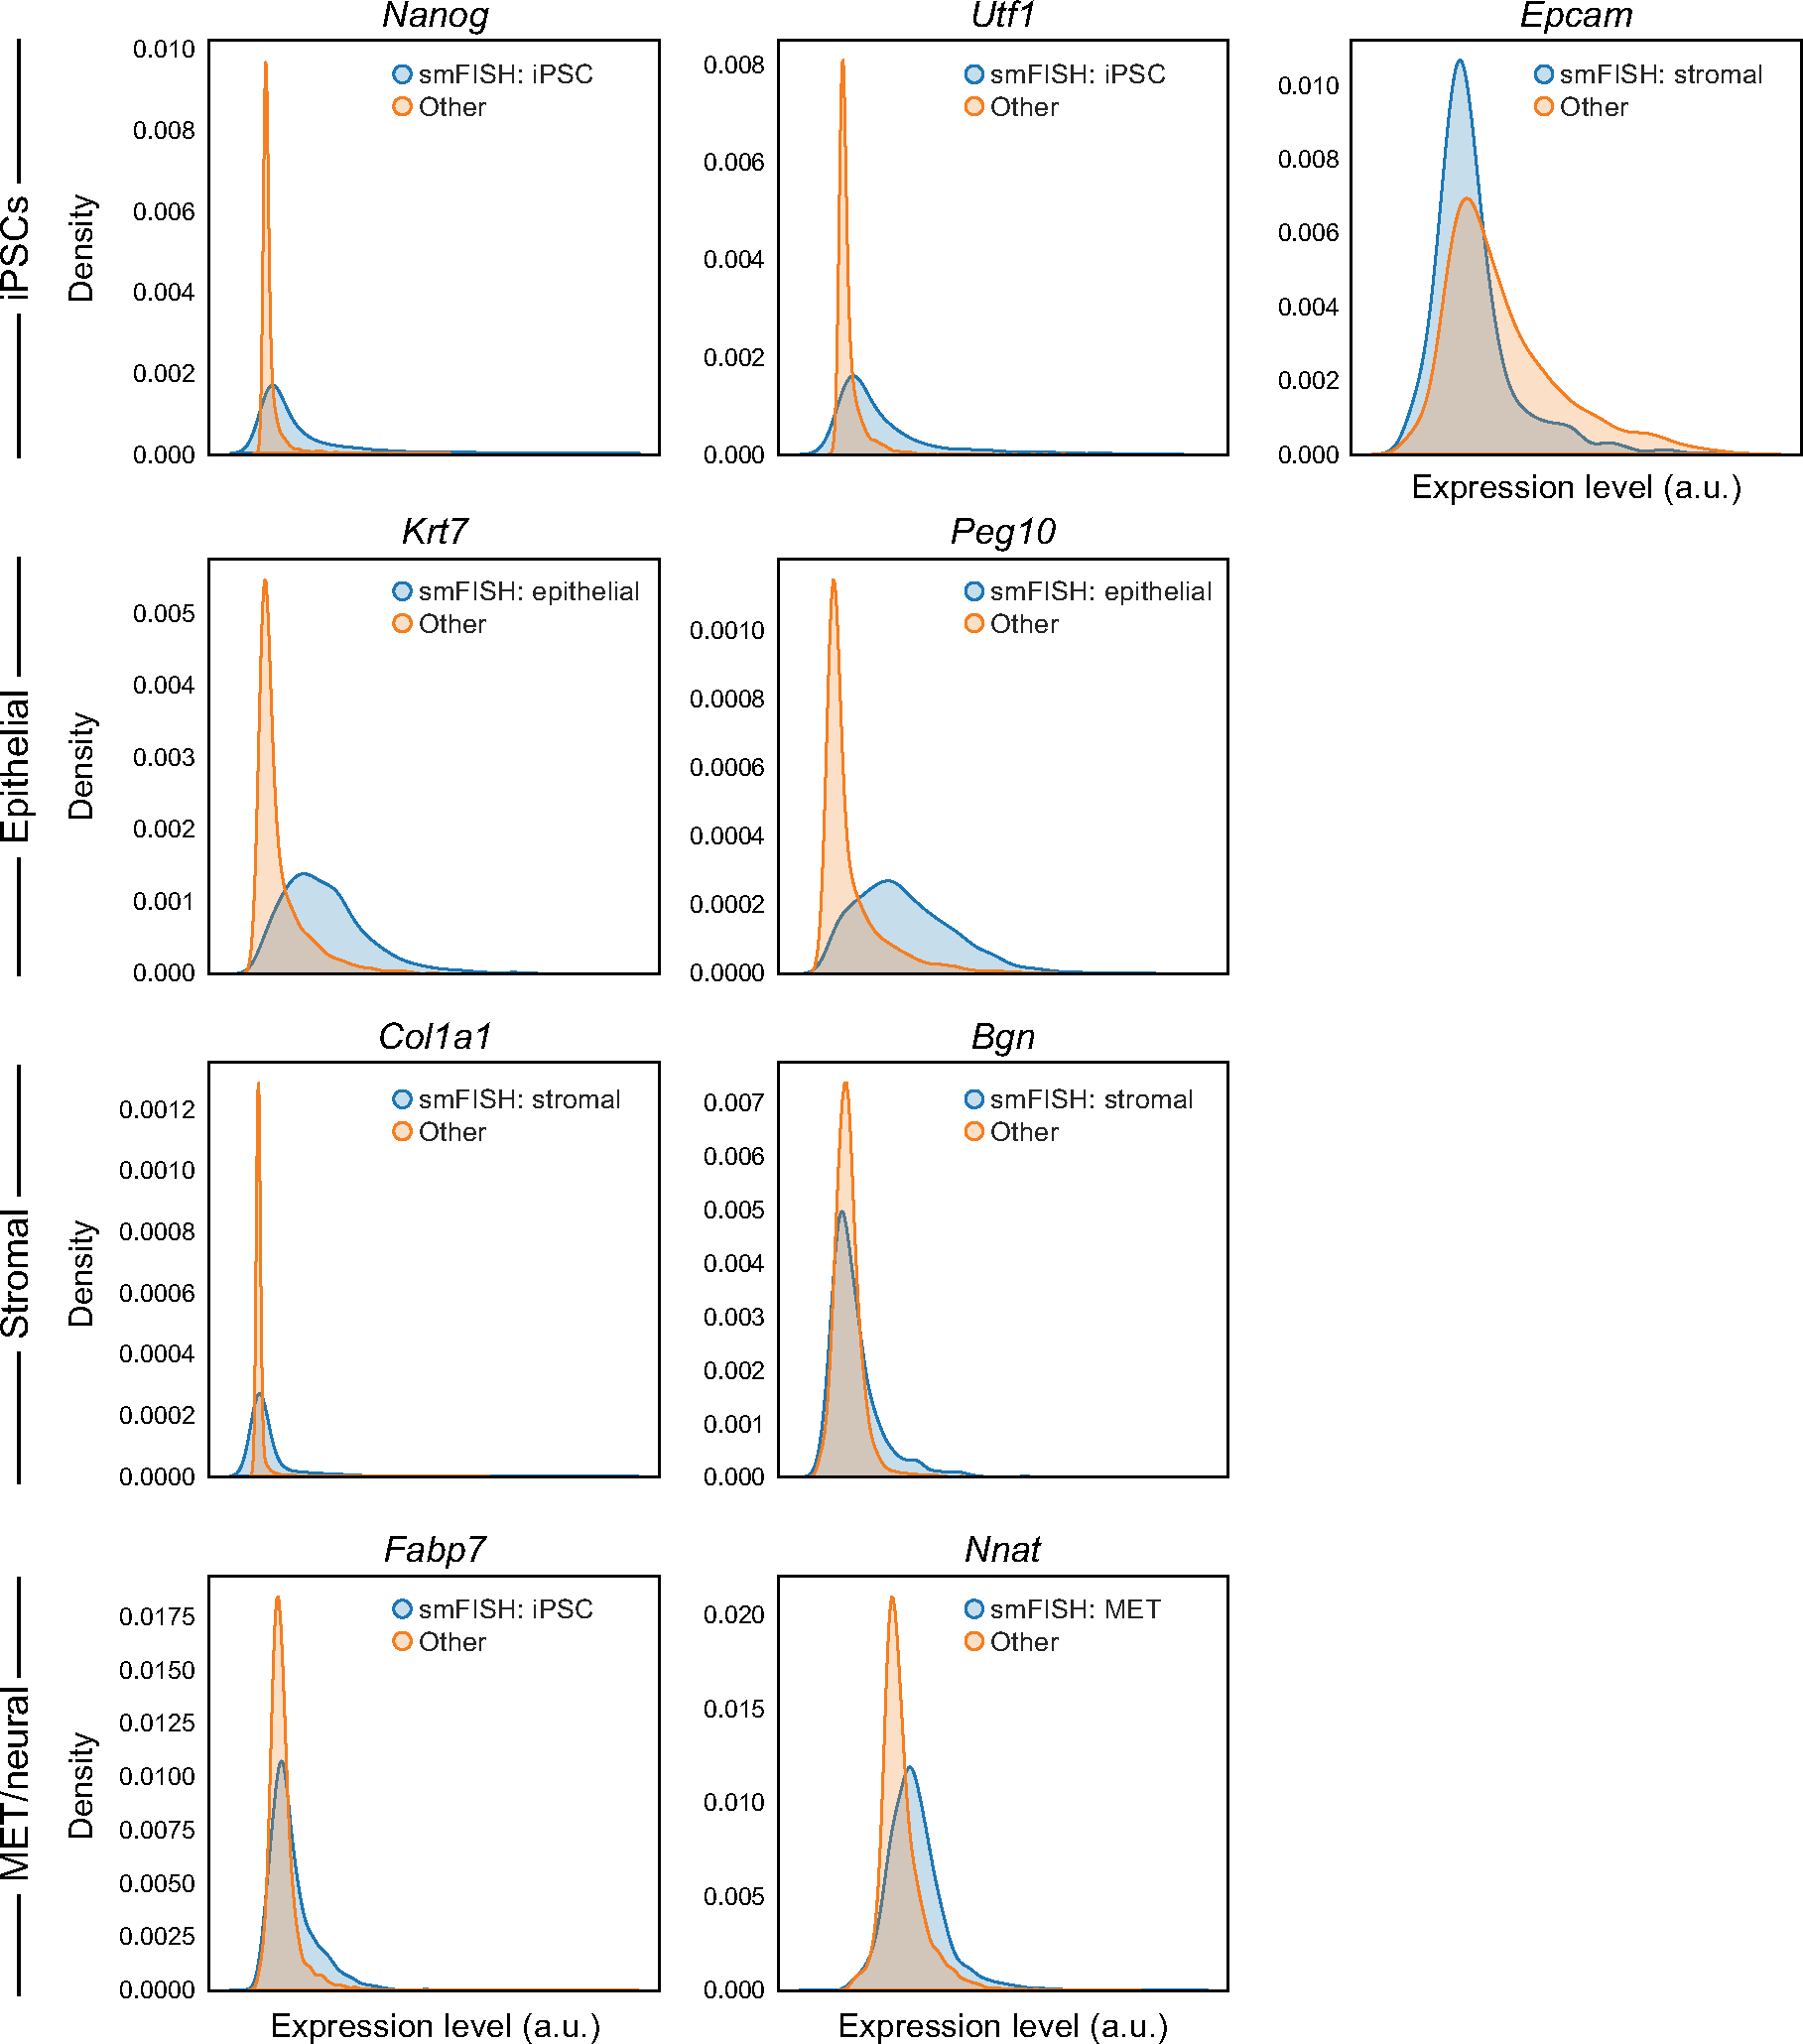
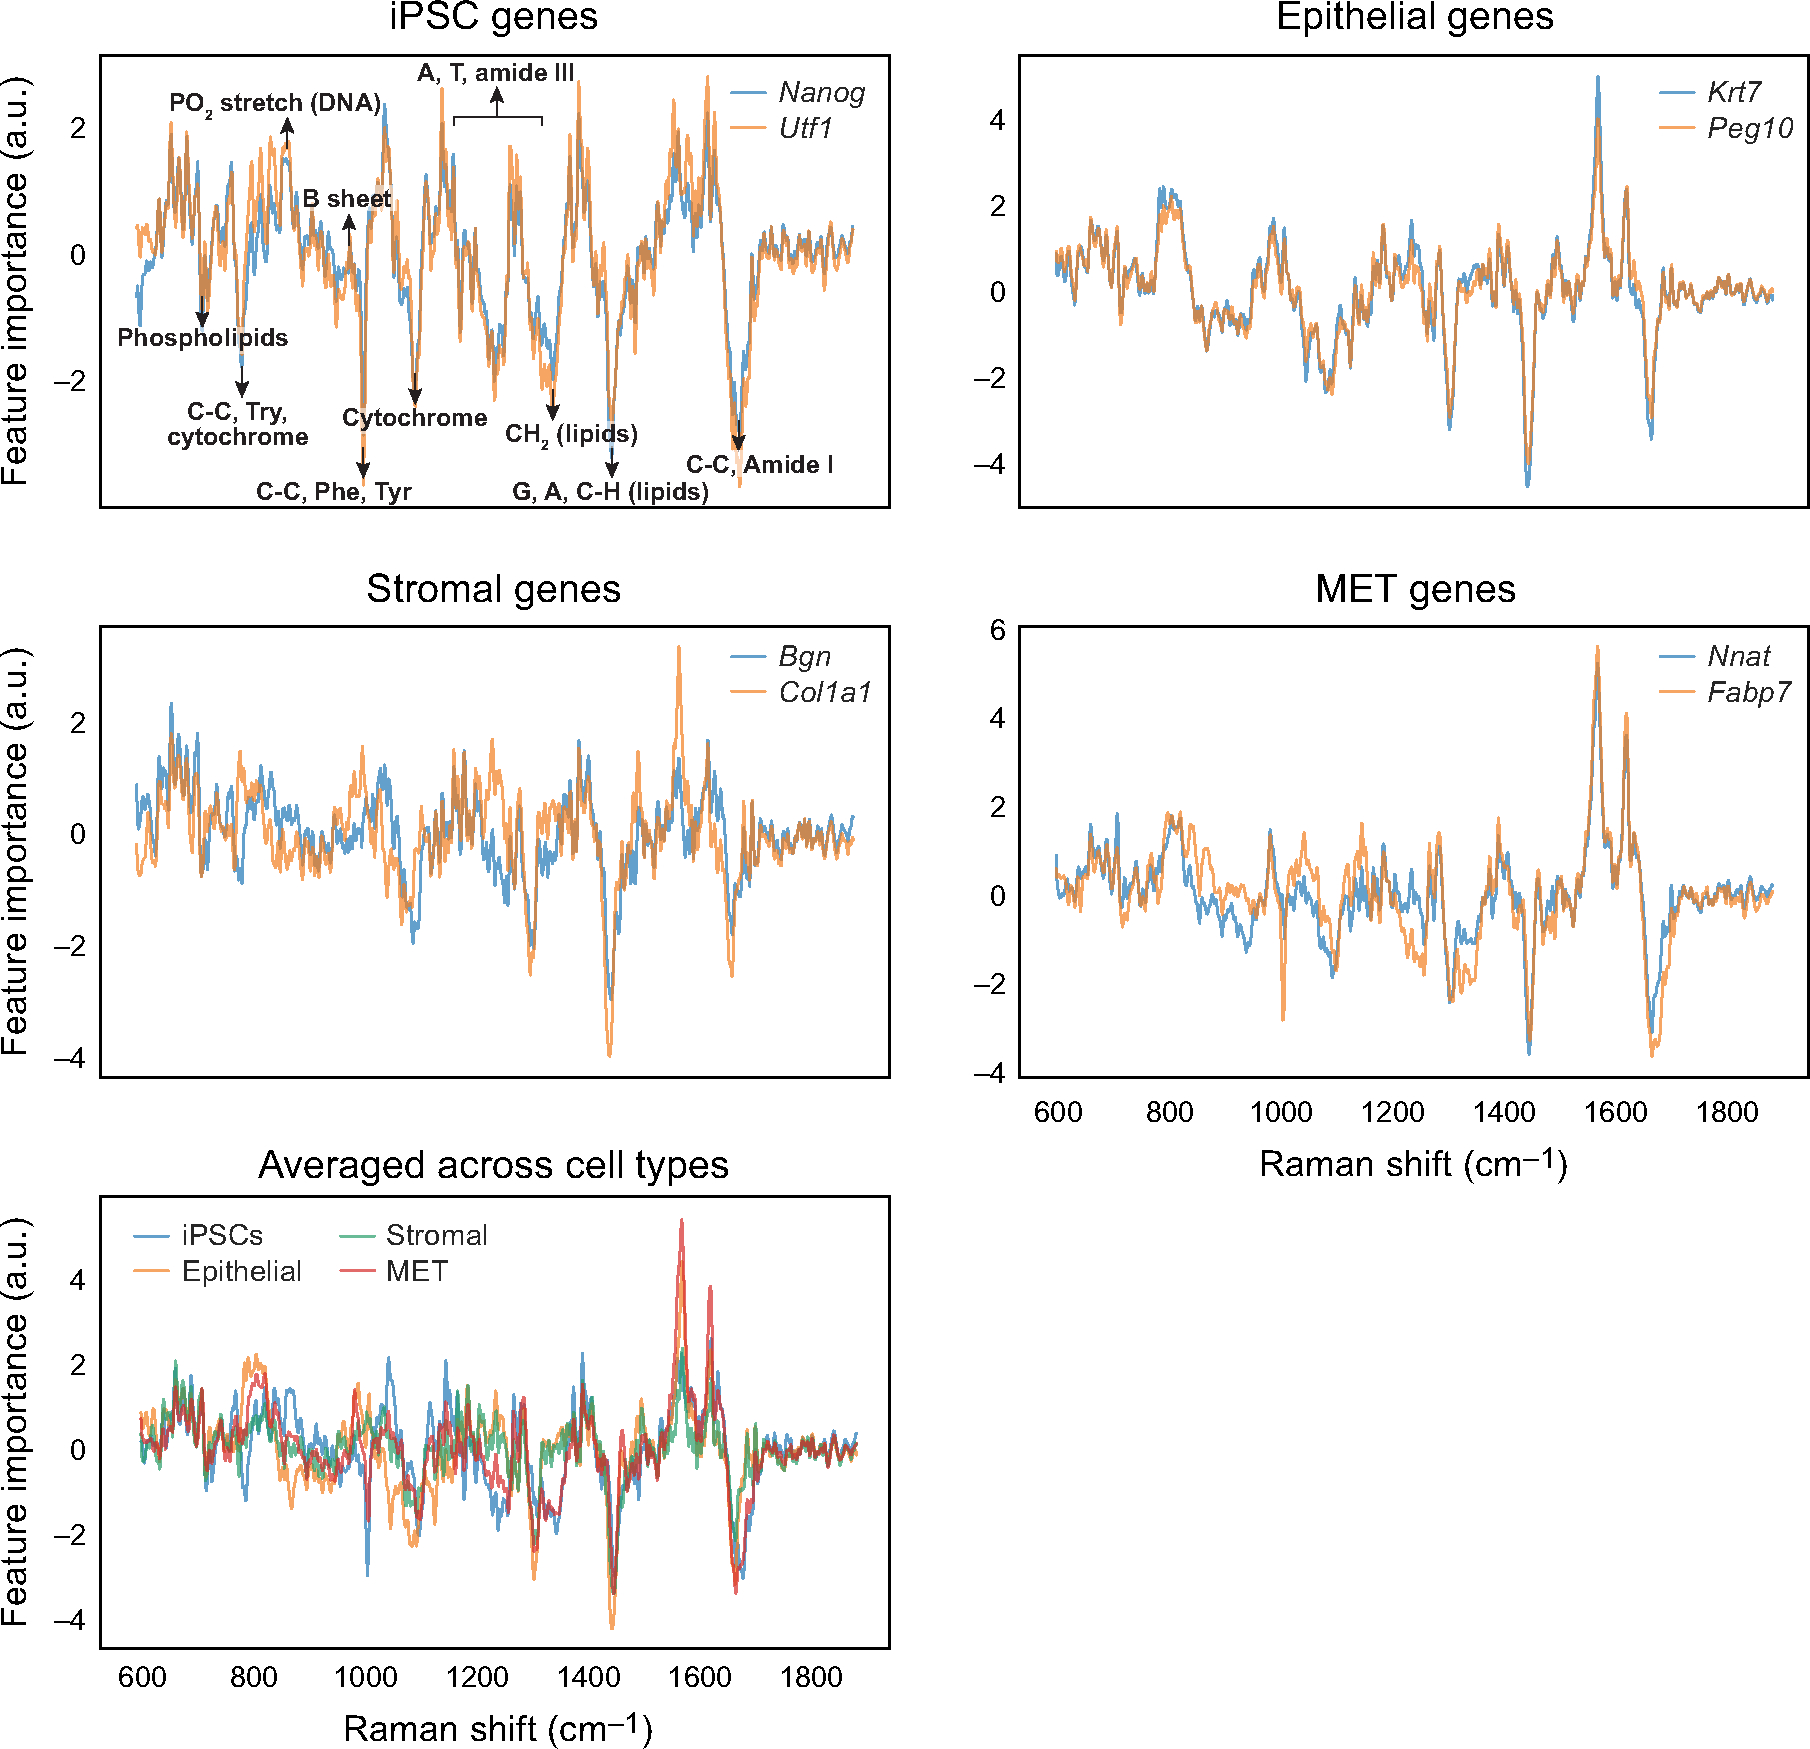
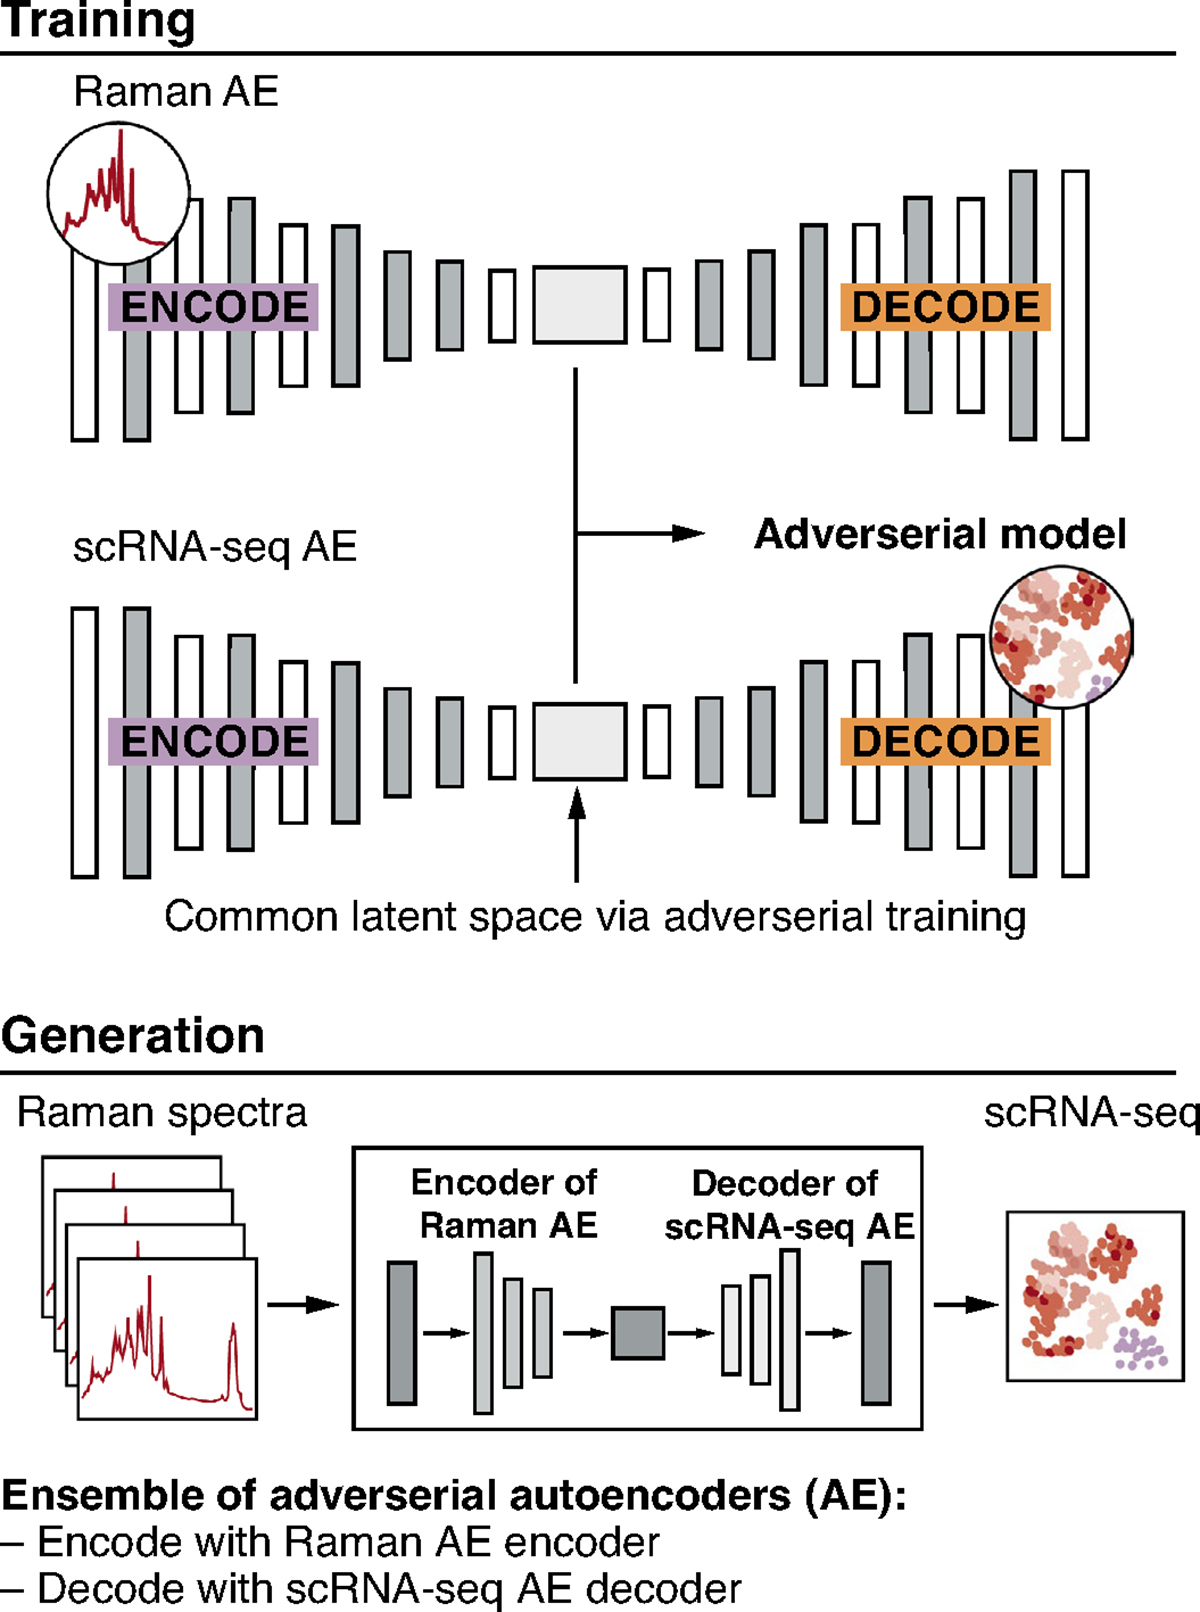
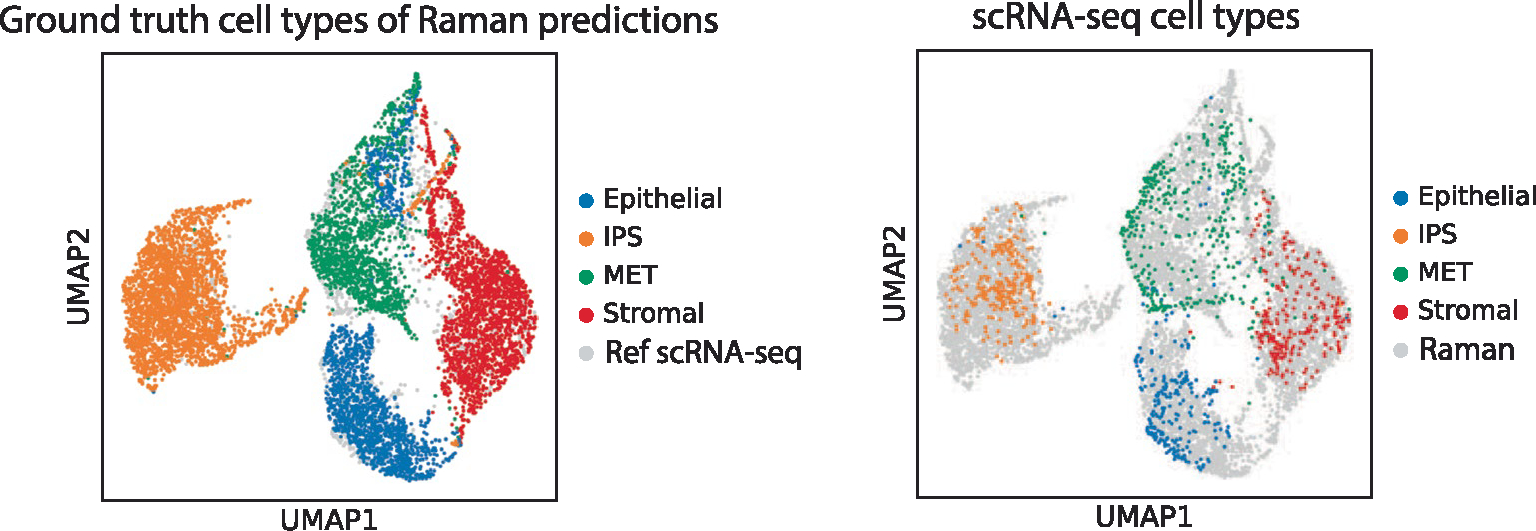
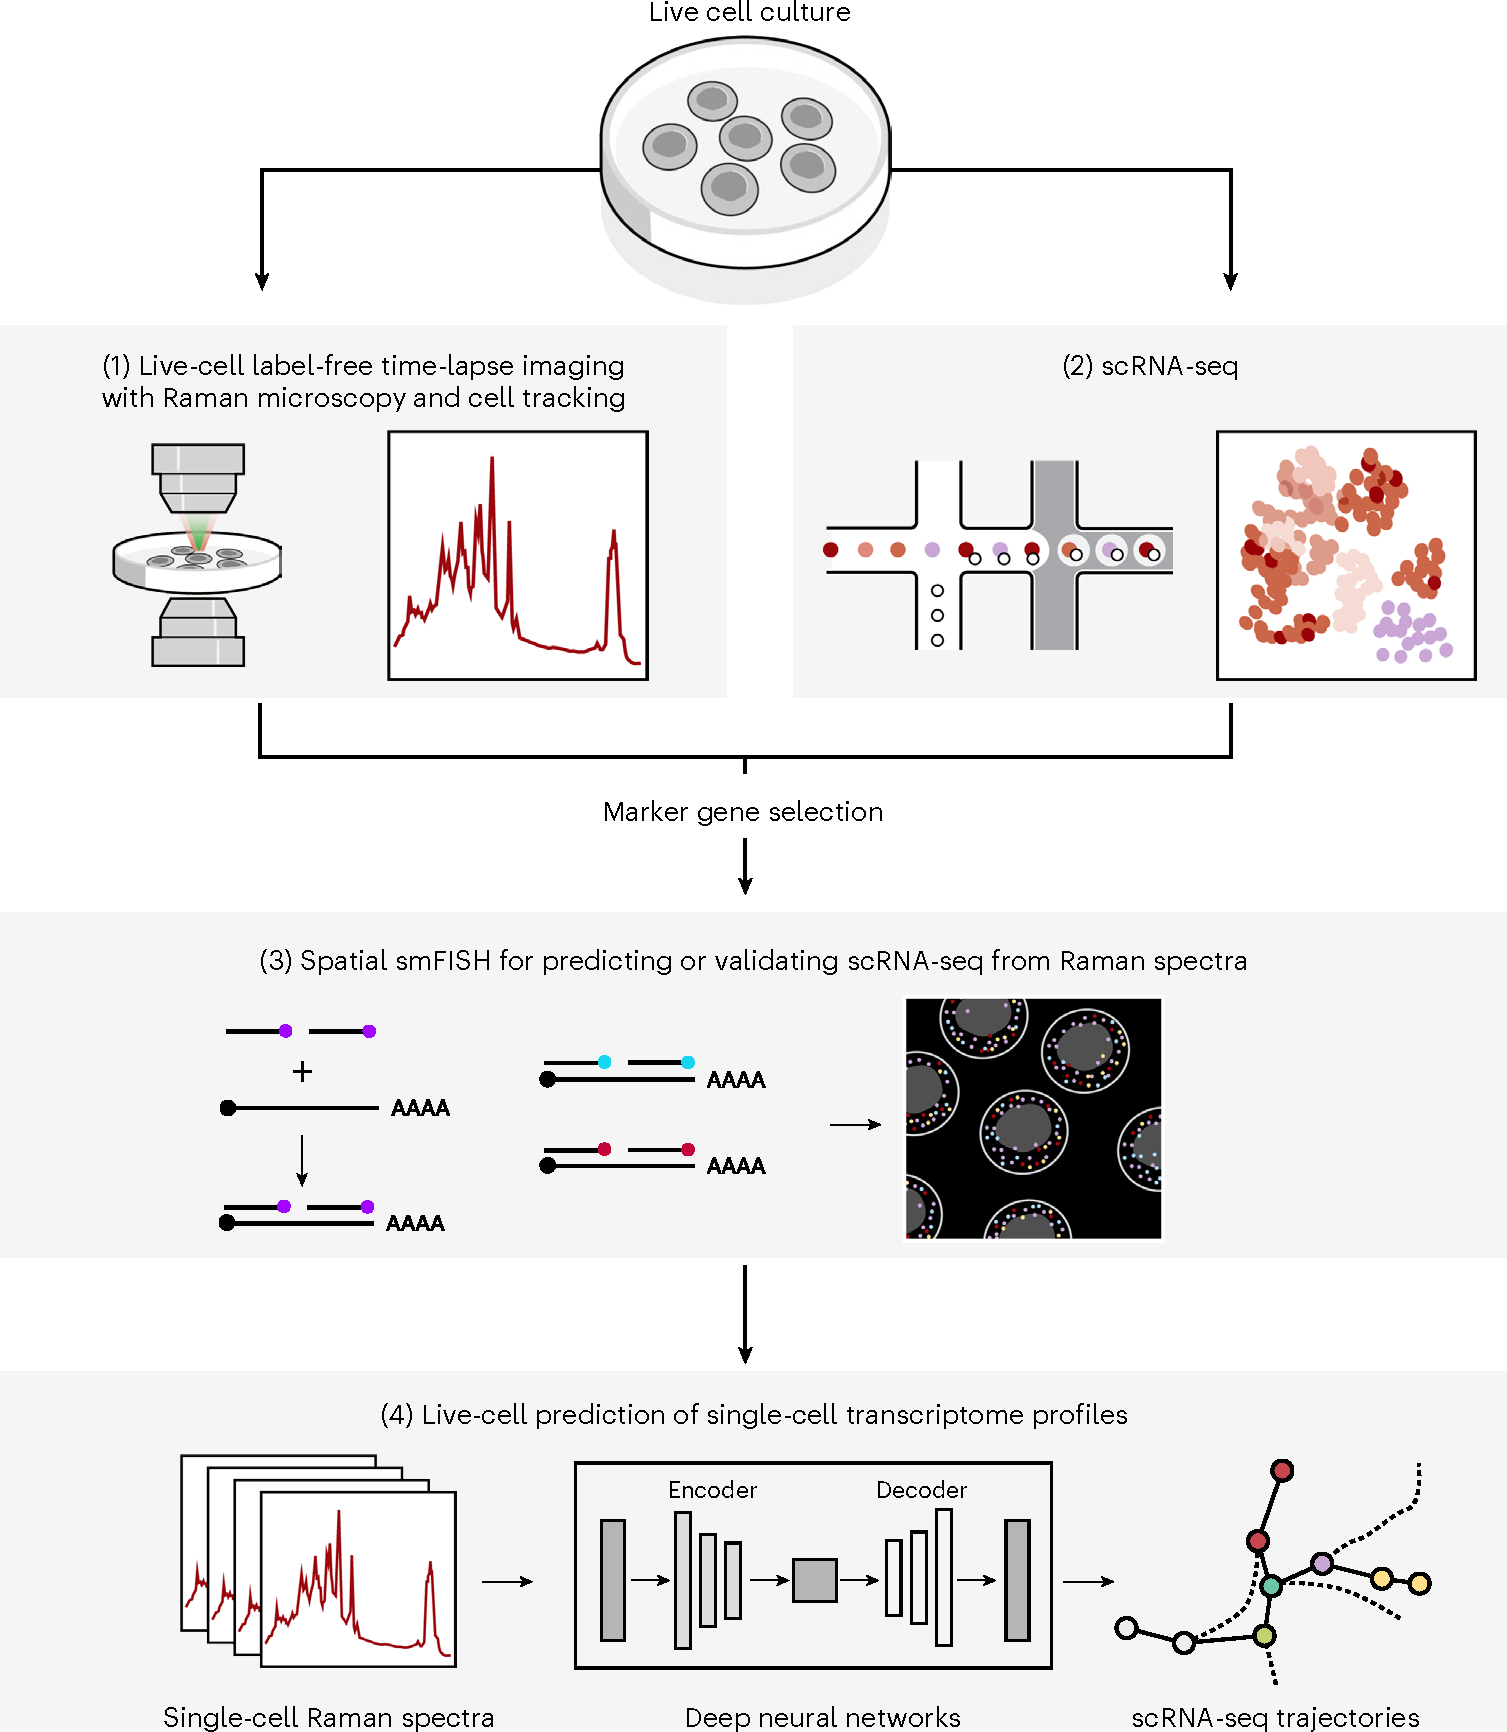
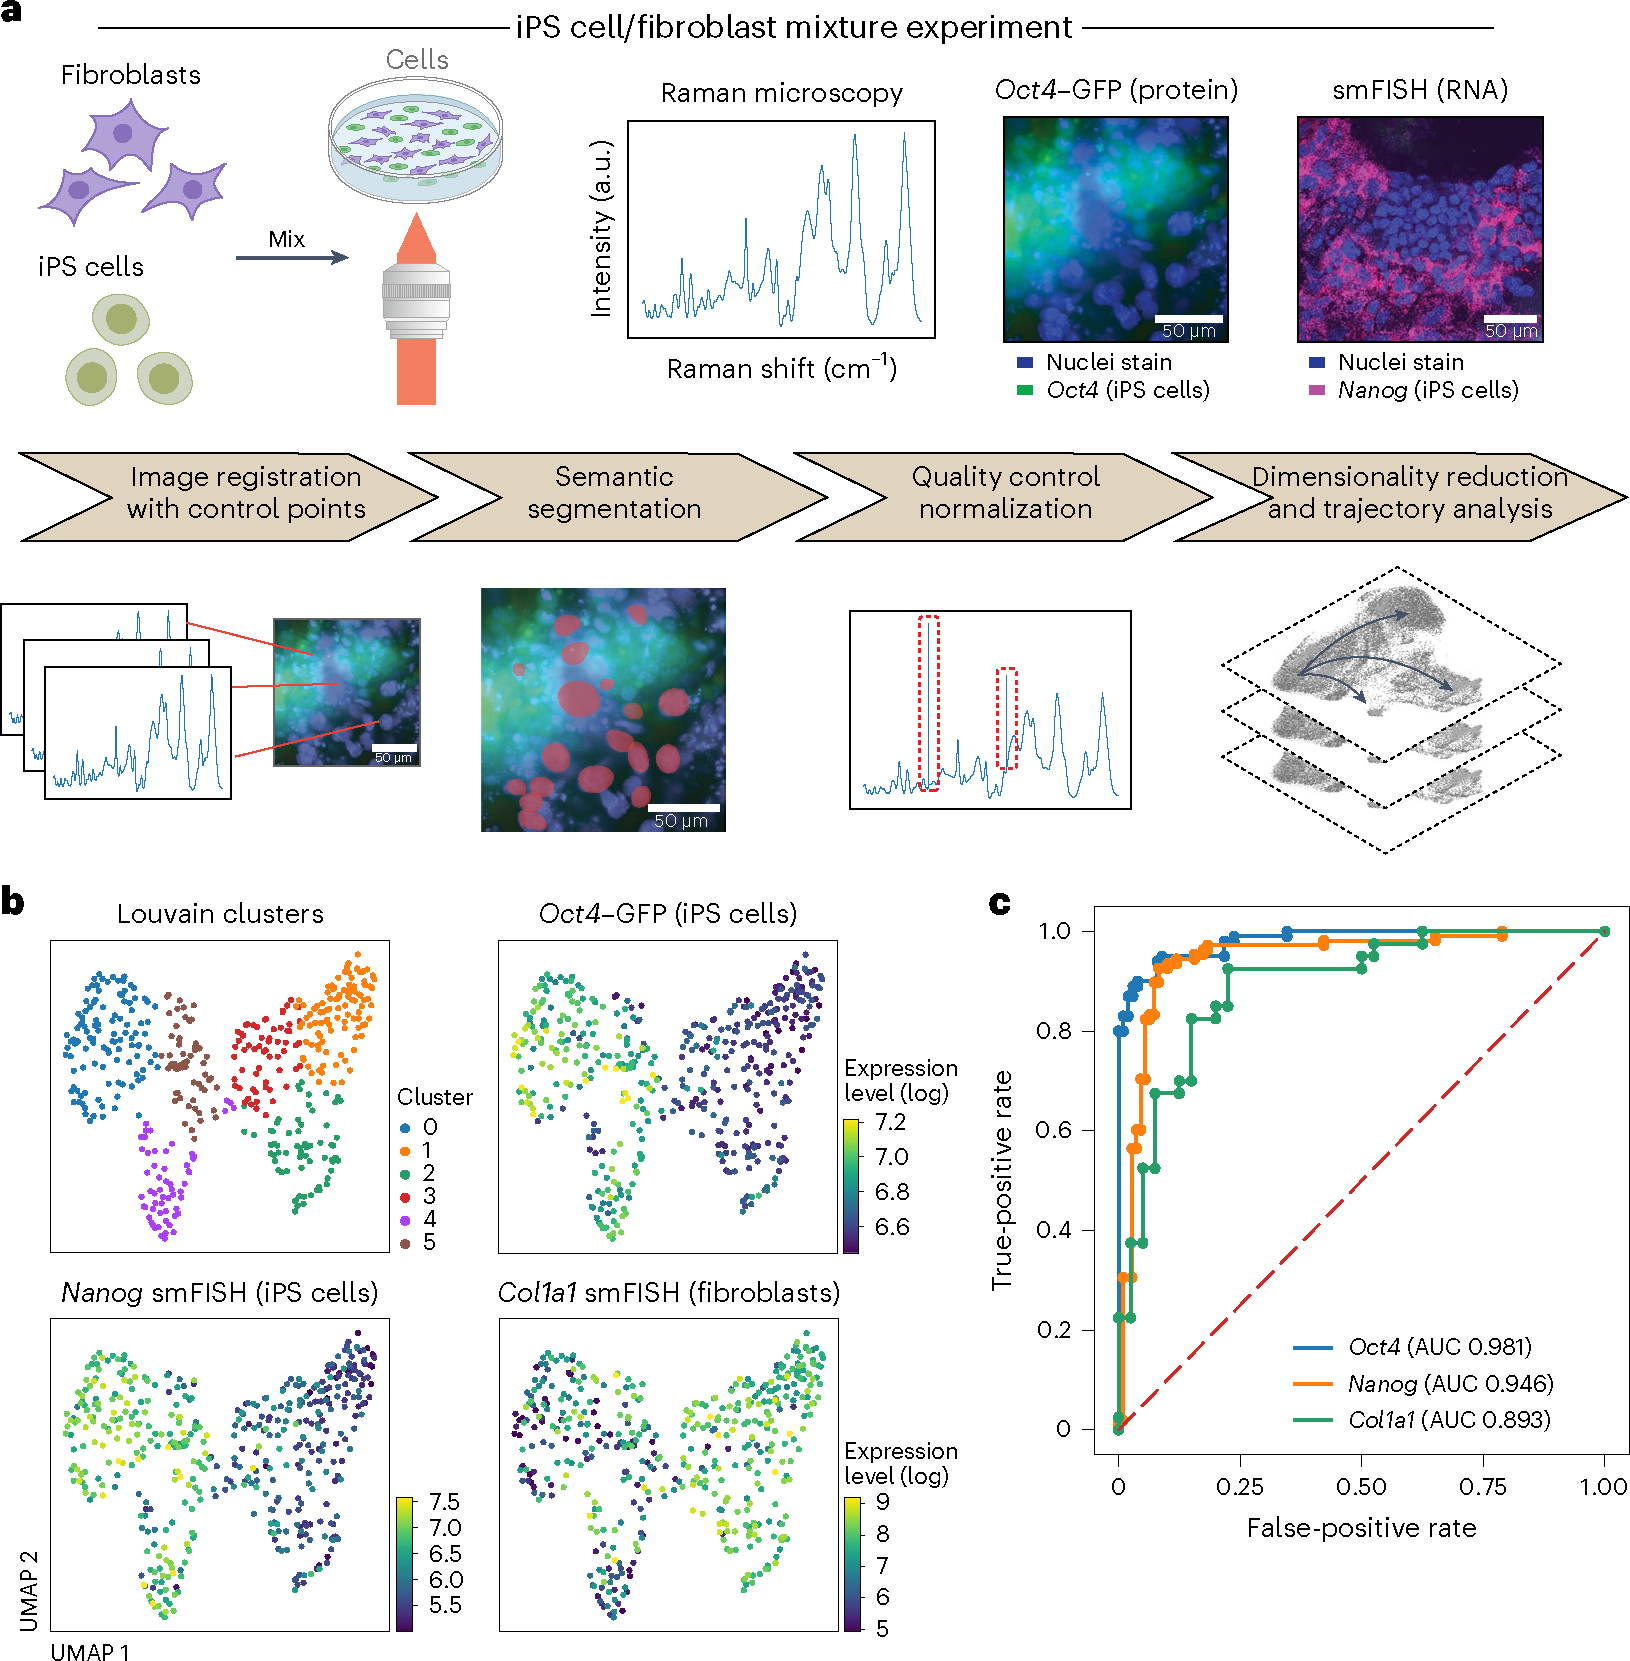
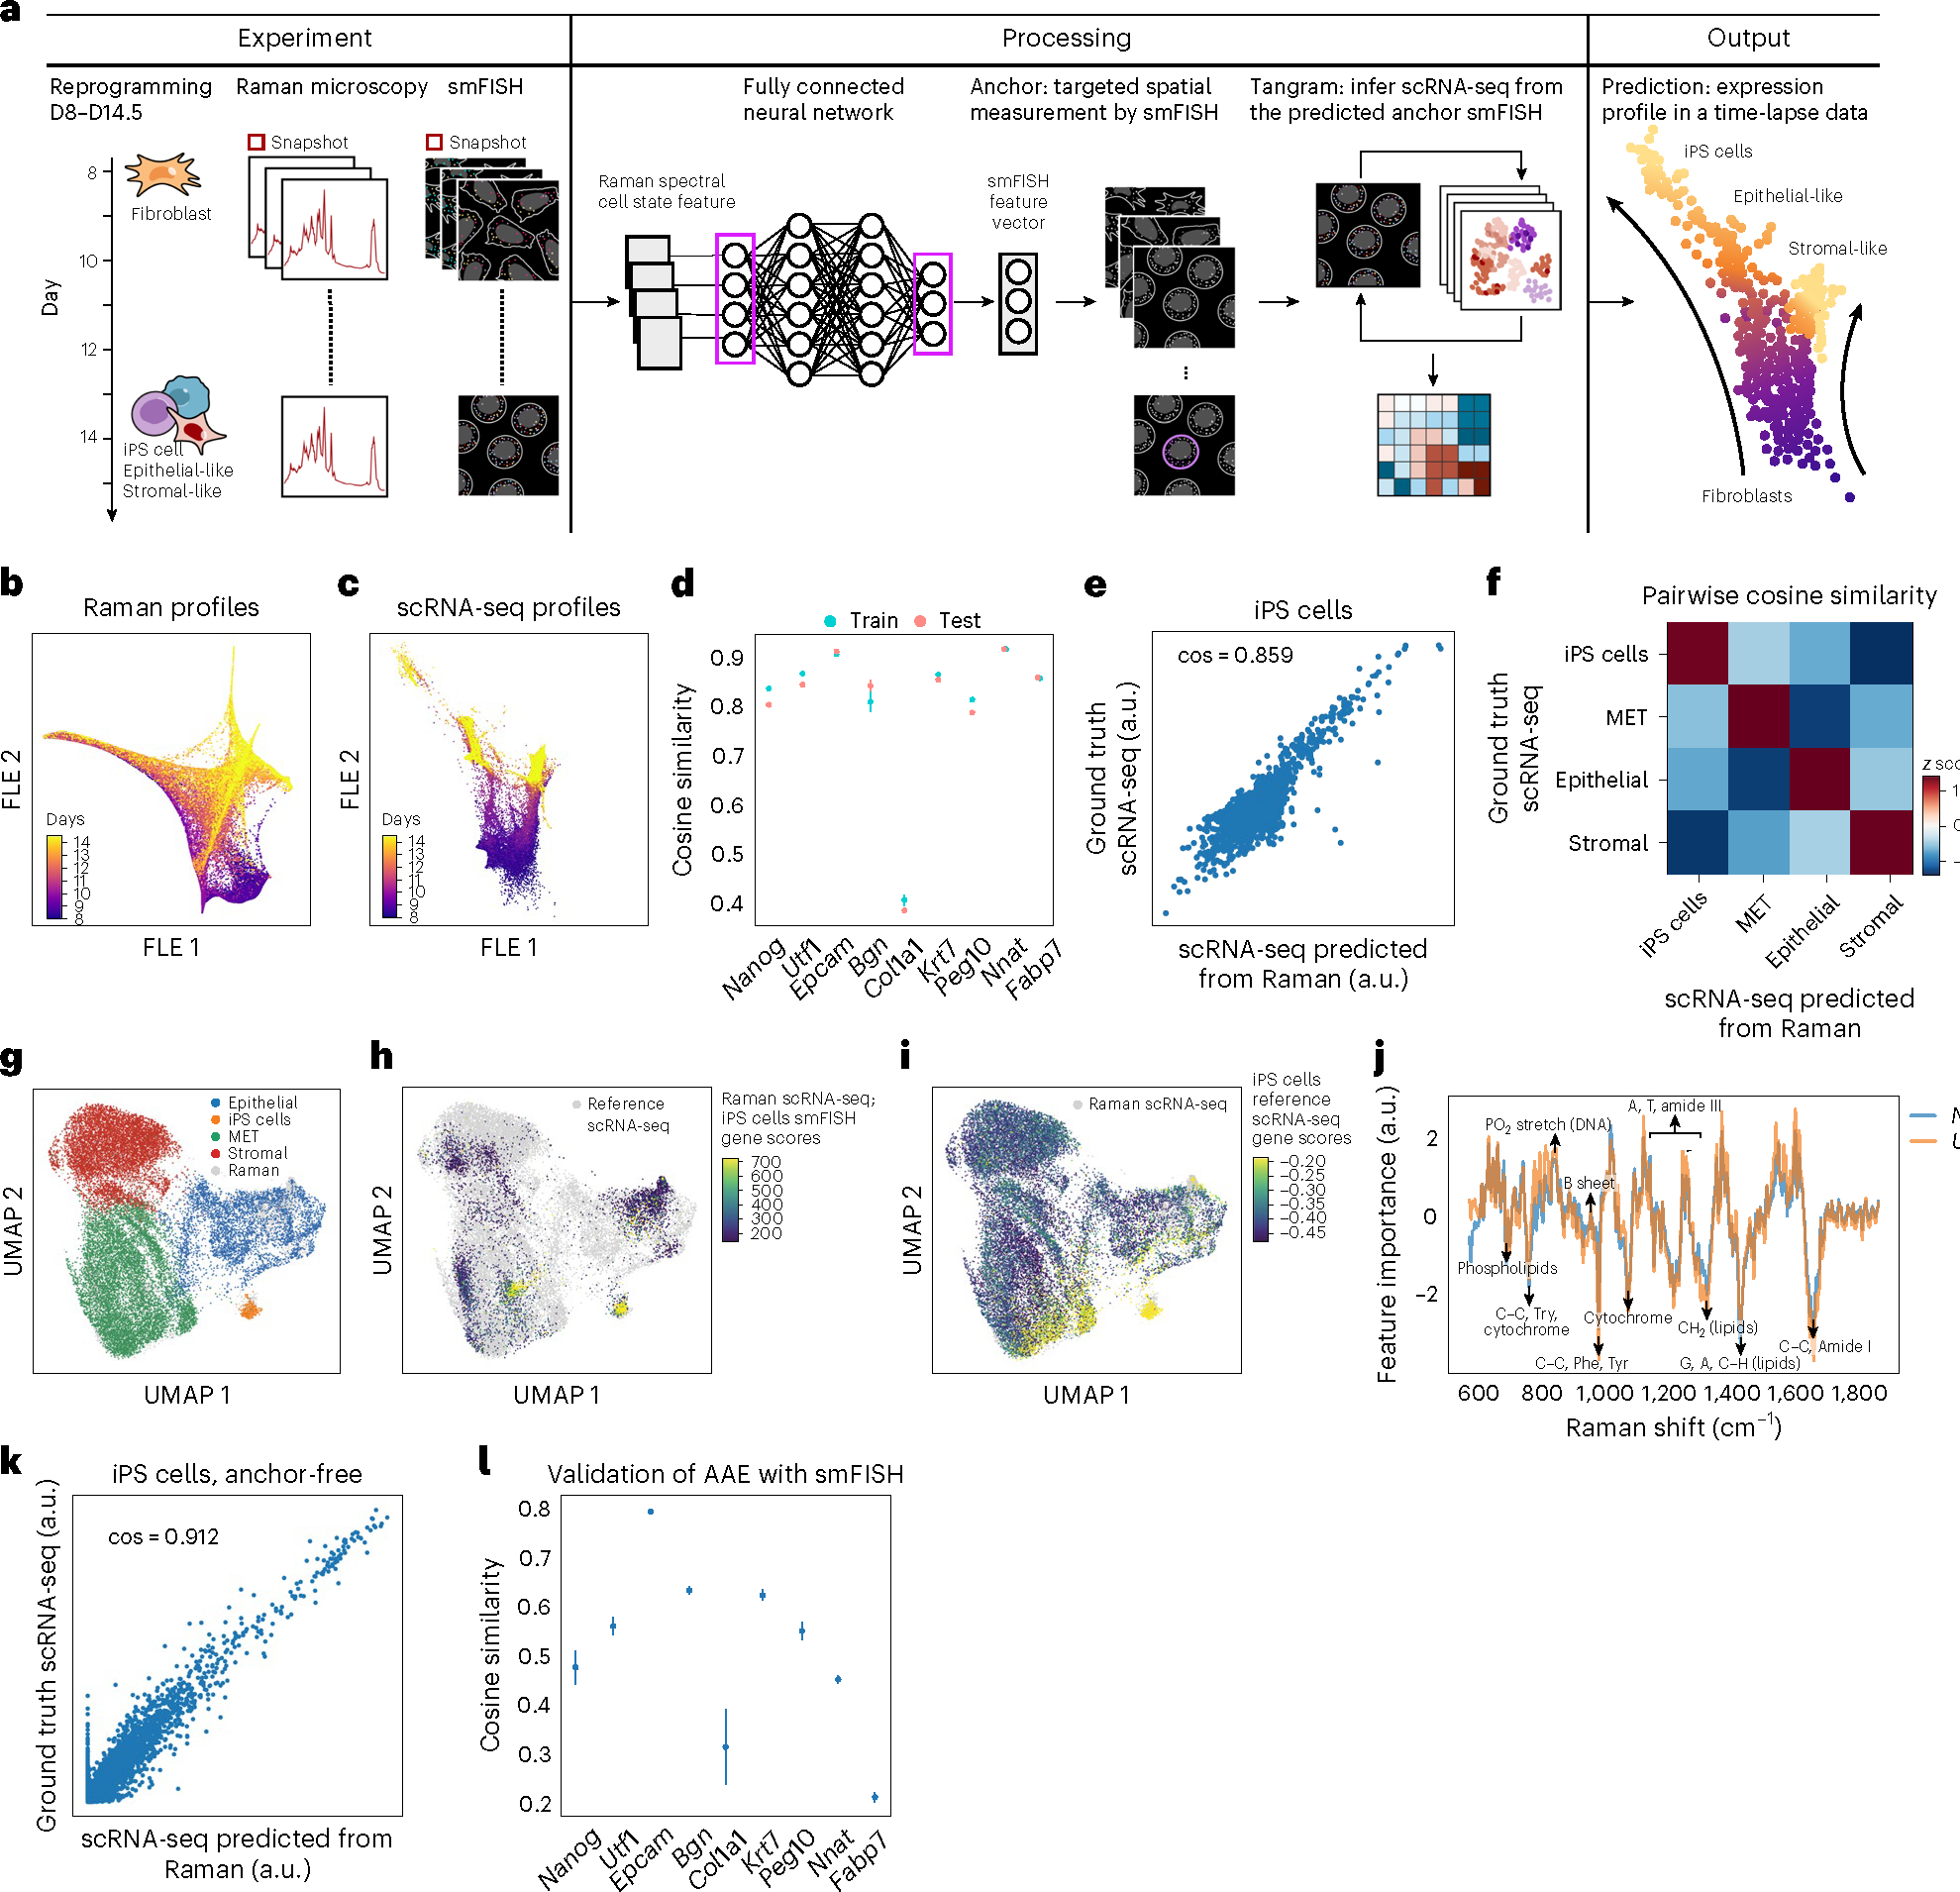
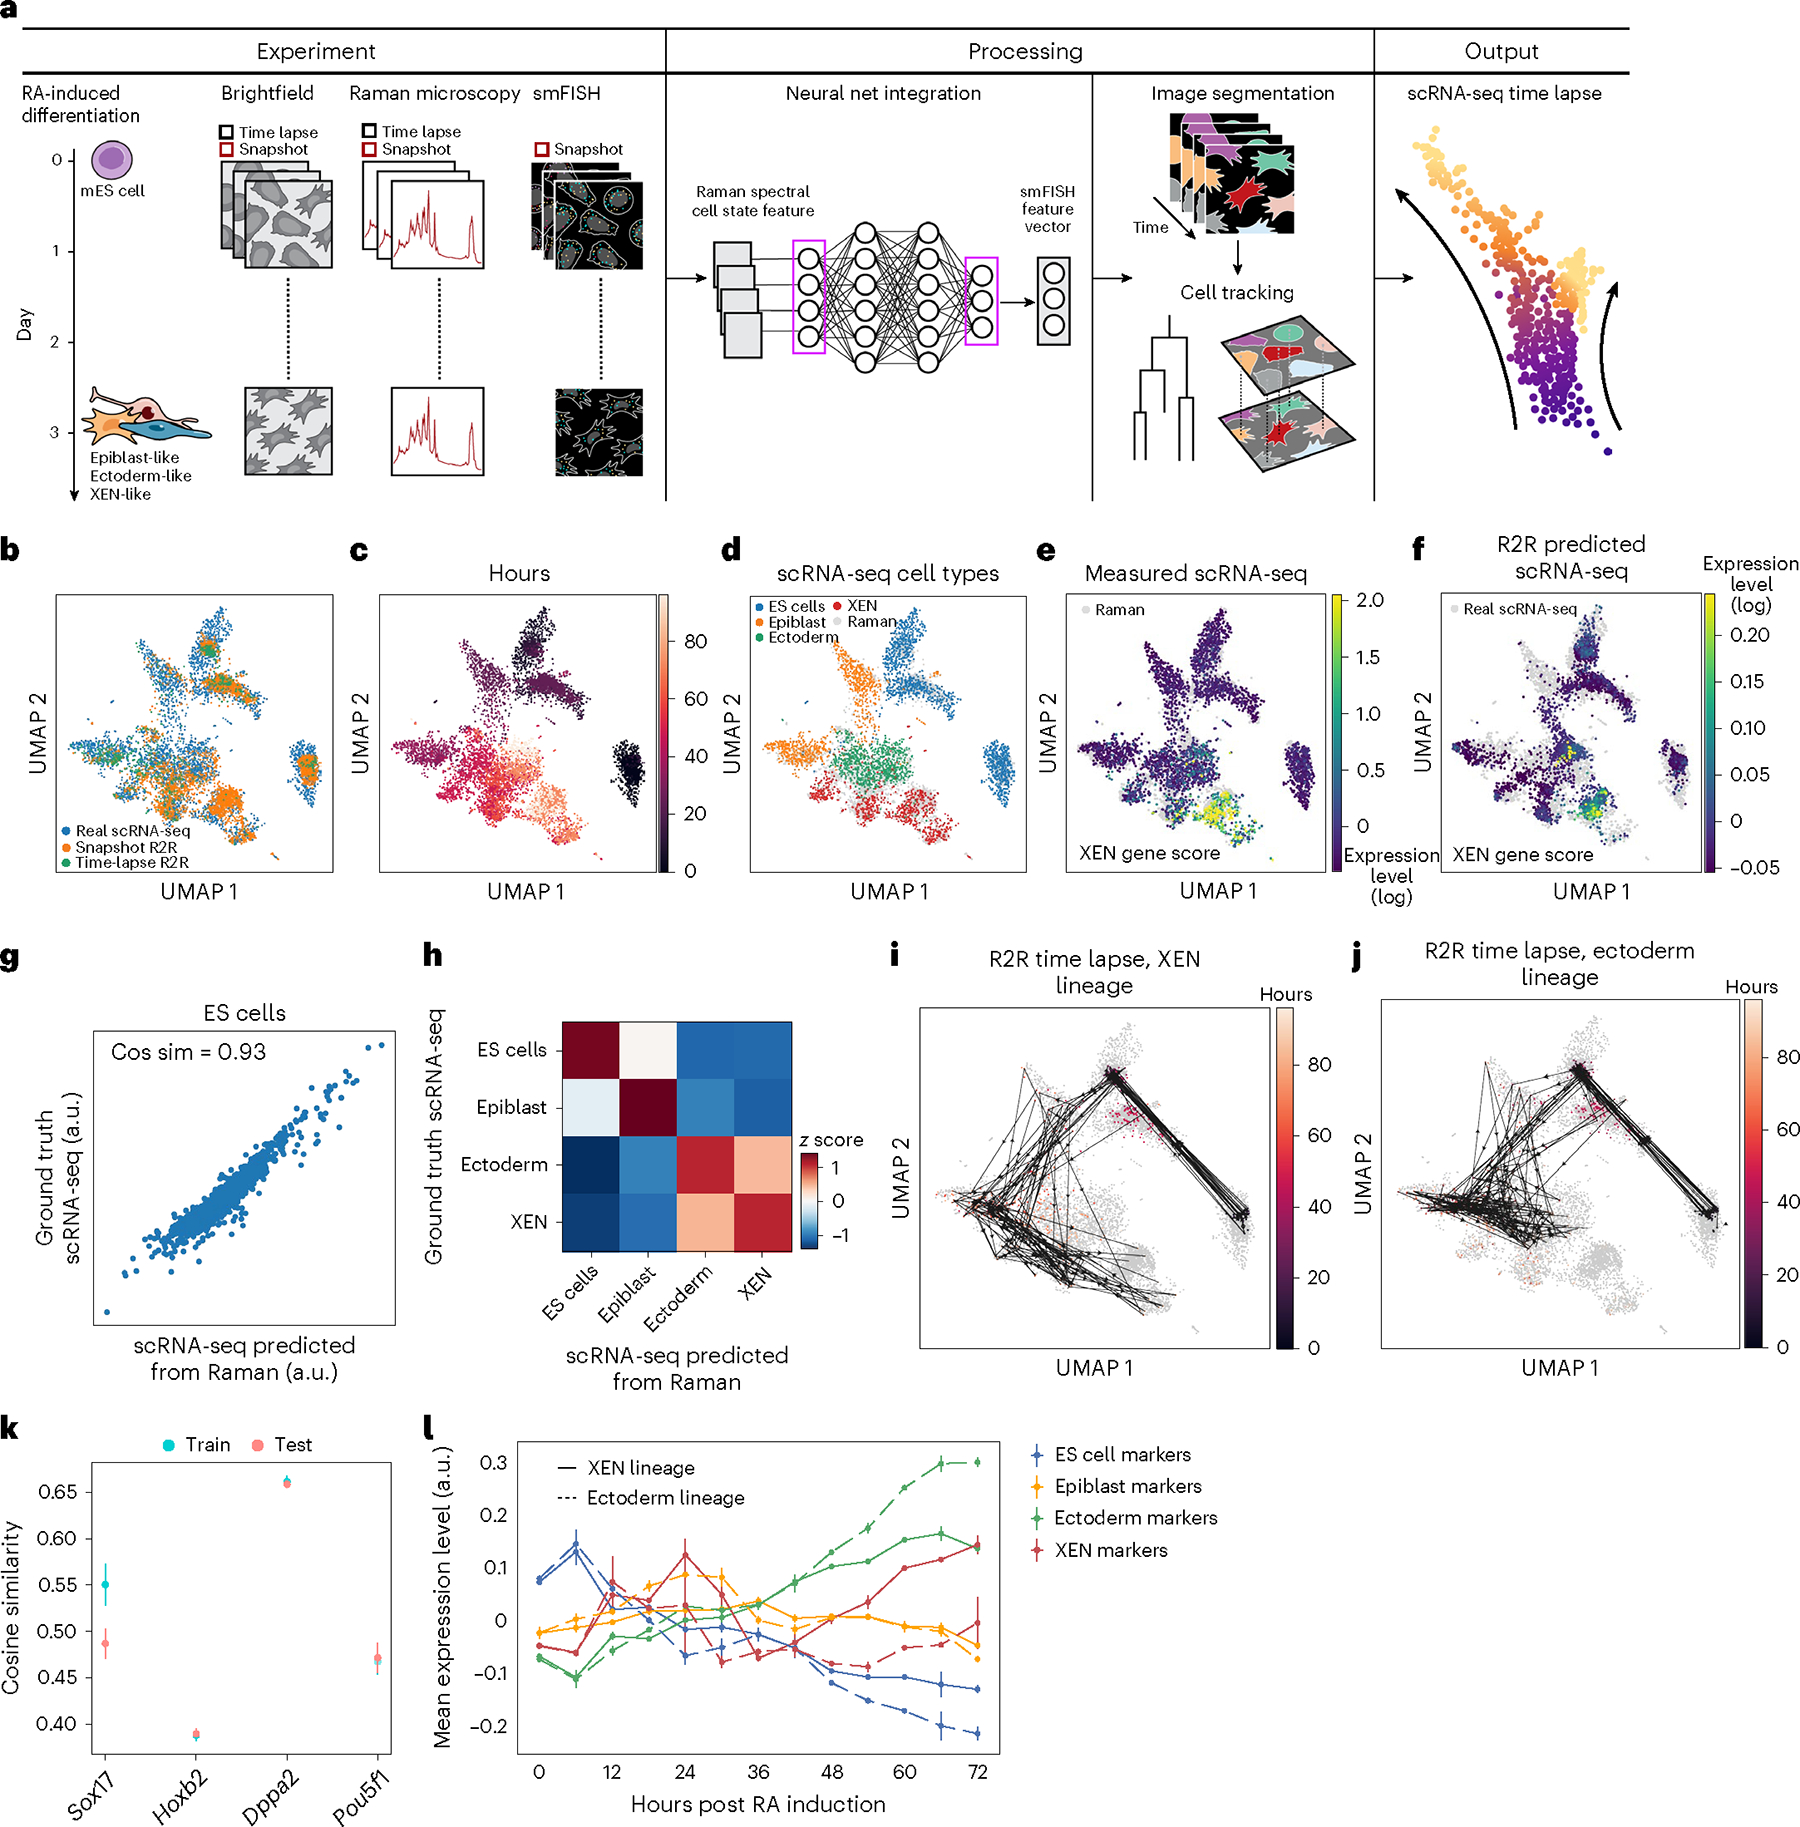
Single-cell RNA sequencing and other profiling assays have helped interrogate cells at unprecedented resolution and scale, but are inherently destructive. Raman microscopy reports on the vibrational energy levels of proteins and metabolites in a label-free and nondestructive manner at subcellular spatial resolution, but it lacks genetic and molecular interpretability. Here we present Raman2RNA (R2R), a method to infer single-cell expression profiles in live cells through label-free hyperspectral Raman microscopy images and domain translation. We predict single-cell RNA sequencing profiles nondestructively from Raman images using either anchor-based integration with single molecule fluorescence in situ hybridization, or anchor-free generation with adversarial autoencoders. R2R outperformed inference from brightfield images (cosine similarities: R2R >0.85 and brightfield <0.15). In reprogramming of mouse fibroblasts into induced pluripotent stem cells, R2R inferred the expression profiles of various cell states. With live-cell tracking of mouse embryonic stem cell differentiation, R2R traced the early emergence of lineage divergence and differentiation trajectories, overcoming discontinuities in expression space. R2R lays a foundation for future exploration of live genomic dynamics.


Conflict of interest statement

Competing interests A.R. is a co-founder and equity holder of Celsius Therapeutics, an equity holder in Immunitas, and was a scientific advisory board member of ThermoFisher Scientific, Syros Pharmaceuticals, Neogene Therapeutics and Asimov until 31 July 2020. A.R. is an employee of Genentech from 1 August 2020 with equity in Roche. T.B., S.G. and T.J. are employees of Genentech from 1 Feburary 2021, 29 March 2021 and 5 June 2023, respectively. J.S. is a scientific advisor for Arcadia Science. A patent application has been filed by the Broad Institute related to this work. The other authors declare no competing interests.

Figures

Extended Data Fig. 1 |
Extended Data Fig. 1 |. A multi-modal Raman microscope capable of fluorescence imaging and Raman microscopy.
Schematic of a Raman microscope integrated with a wide-field fluorescence microscope for simultaneous detection of nuclei staining, bright field, fluorescence channels, and Raman images.
Extended Data Fig. 2 |
Extended Data Fig. 2 |. Raman-predicted and scRNA-seq measured pseudo-bulk profiles are well correlated across cell types.
scRNA-seq measured (y axis) and R2R-predicted (x axis) expression for each gene (dot) in pseudo-bulk RNA profiles averaged across cells labeled as iPSC (top left), epithelial (top right), stromal (bottom left) and MET (bottom right). Cosine similarity is denoted at the top left corner.
Extended Data Fig. 3 |
Extended Data Fig. 3 |. Measured and Raman-predicted single cell profiles co-embed well as reflected by gene scores for each cell type.
UMAP co-embedding of Raman predicted RNA profiles and measured scRNA-seq profiles (dots) colored by scores of marker gene for different cell types (rows) determined by smFISH measurements (left, for cells with Raman-predicted profiles) or real scRNA-seq measurements (right, for cells with scRNA-seq profiles).
Extended Data Fig. 4 |
Extended Data Fig. 4 |. Measured and Raman-predicted single cell profiles co-embed well as reflected by smFISH measurement of Raman cells.
UMAP co-embedding of Raman predicted RNA profiles and measured scRNA-seq profiles (dots) where the Raman cells are colored by smFISH measurement of each of nine anchor genes.
Extended Data Fig. 5 |
Extended Data Fig. 5 |. Measured and Raman-predicted single cell profiles co-embed well as reflected by scRNA-seq based expression of nine anchor genes.
UMAP co-embedding of Raman predicted RNA profiles and measured scRNA-Seq profiles (dots) where the scRNA-seq profiled cells are colored by scRNA-seq measured expression of each of nine anchor genes.
Extended Data Fig. 6 |
Extended Data Fig. 6 |. Distributions of expression of marker genes based on R2R-predicted profiles.
Distributions (density plots) of the predicted expression in Raman2RNA inferred profiles for each marker gene (panel) in its expected corresponding cell type (blue, based on the predicted expression profiles) and all other cells (orange).
Extended Data Fig. 7 |
Extended Data Fig. 7 |. Distributions of expression of marker genes based on real smFISH profiles.
Distributions (density plots) of the real smFISH profiles for each marker gene (panel) in its expected corresponding cell type (blue, based on the R2R predicted expression profiles) and all other cells (orange).
Extended Data Fig. 8 |
Extended Data Fig. 8 |. Raman spectral feature importance scores for each smFISH anchor gene and its average across all genes for a cell type.
Feature importance scores (y axis) for marker genes of each cell type (top two rows), and for all cell types (bottom row), along the Raman spectrum (x axis). Known signals are annotated in the top left panel (identical to Fig. 3j).
Extended Data Fig. 9 |
Extended Data Fig. 9 |. Adversarial autoencoder (AAE) based model for anchor-free generation of scRNA-seq from Raman profiles.
Top: Two autoencoders (AEs) – one for Raman and the other for scRNA-seq – are trained adversarially to learn two indistinguishable latent spaces. Once a common latent space is found, new Raman spectra are encoded using the encoder part of the Raman AE and decoded to scRNA-seq using the decoder part of the scRNA-seq AE (bottom).
Extended Data Fig. 10 |
Extended Data Fig. 10 |. Anchor-free R2R profiles capture variance in single cell profiles as indicated by co-embedding.
UMAP co-embedding of anchor-free R2R-generated profiles and real scRNA-seq (dots) colored by cell types determined by Tangram label-transfer on smFISH measurements (left, for cells with R2R-generated profiles) or by ground truth scRNA-seq (right, for cells with scRNA-seq profiles).
Fig. 1 |
Fig. 1 |. R2R.
Live cells were cultured on gelatin-coated quartz glass-bottom plates (top) and Raman spectra were then measured at each pixel (at subcellular spatial resolution) within an image frame, and after time-lapse imaging and cell tracking (1), smFISH imaging in the same area was carried out (3). In an independent experiment, cells in the same system were dissociated into a single-cell suspension and profiled by scRNA-seq (2). scRNA-seq profiles were used to select nine marker genes for five major cell clusters for mouse iPS cell reprogramming and four marker genes for three major cell lineages in mES cell differentiation, and those were measured with spatial smFISH (3). Lastly, single-cell expression profiles were generated from Raman spectra of individual cells, by either anchor-based (measured by smFISH) or anchor-free methods (4) using fully connected neural networks and AAEs, respectively. Marker gene profiles measured by smFISH are used for either training or validation.
Fig. 2 |
Fig. 2 |. R2R accurately distinguishes cell types and predicts binary expression of marker genes in a mixture of mouse fibroblasts and iPS cells.
a, Overview. Top: experimental procedures. Mouse fibroblasts and iPS cells were mixed 1:1 and plated on glass-bottom plates, followed by Raman imaging of live cells, nucleus staining and measurement of endogenous Oct4–GFP (iPS cell marker) reporter by fluorescence imaging, and cell fixation and processing for smFISH with DAPI and probes for Nanog (iPS cells, magenta) and Col1a1 (fibroblasts). Bottom: preprocessing and analysis. From left: image registration with control points (Methods), followed by semantic cell segmentation, outlier removal/normalization and dimensionality reduction/trajectory analysis. b, R2R distinguishes cell states from Raman spectra. UMAP embedding of single-cell Raman spectra (dots) colored by Louvain clustering labels (top left) or smFISH measured expression of Oct4 (top right), Nanog (bottom left) and Col1a1 (bottom right). c, R2R accurately predicts binary (on/off) expression of marker genes. Receiver operating characteristic (ROC) plots and area under the curve (AUC) obtained by classifying the ‘on’ and ‘off’ states of Oct4 (blue), Nanog (orange) and Col1a1 (green).
Fig. 3 |
Fig. 3 |. R2R predicts single-cell RNA profiles during reprogramming of mouse fibroblasts to iPS cells.
a, Anchor-based approach overview. From left: mouse fibroblasts were reprogrammed into iPS cells over the course of 14.5 days (‘D’), and, at half-day intervals from days 8 to 14.5, spatial Raman spectra, smFISH for nine anchor genes, and nucleus stains by fluorescence imaging were measured. Domain translation methods (fully connected neural network and Tangram) were used to predict scRNA-seq profiles from Raman spectra using smFISH as anchor. b,c, Low-dimensionality embedding by force-directed layout embedding (FLE) of Raman spectra (b, dots) or scRNA-seq (c, dots) profiles colored by measurement day (color bar). d, Cosine similarity (y axis) between measured (smFISH) and Raman-predicted levels for each smFISH anchor (x axis) in LOOCV where eight out of nine smFISH anchor genes were used for training, and the left-out gene was predicted. Error bars: standard error of five trials with different subset of cells, and mean value at center. e, Measured (y axis) and R2R-generated (x axis) pseudo-bulk RNA profiles (Supplementary Fig. 7) averaged across iPS cells of test cells for each of the top 2,000 highly variable genes (HVGs; dots). f, Pairwise cosine similarity (color bar, z score) between R2R-generated and scRNA-seq measured pseudo-bulk profiles (top 2,000 HVGs) in each cell type (rows, columns). gi, UMAP co-embedding of R2R-generated RNA profiles on Raman test cells (not used for training) and measured scRNA-seq profiles (dots) colored by cell type annotations (g) or by iPS cell gene signature scores (Methods) of Raman-predicted profiles (h) or of real scRNA-seq (i). j, Feature importance scores of Raman spectra in predicting iPS cell-related marker genes (y axis) along the Raman spectrum (x axis). Known Raman peaks were annotated. k, Measured (y axis) and R2R-generated (x axis; anchor-free method) pseudo-bulk RNA profiles averaged across iPS cells for each of the top 2,000 HVGs (dots). l, Cosine similarity (y axis) between measured (smFISH) and anchor-free Raman-generated levels for each smFISH anchor (x axis). Error bars: standard error of five trials with different subset of cells, and mean value at center.
Fig. 4 |
Fig. 4 |. R2R tracks and predicts gene expression dynamics in live single cells during mES cell differentiation.
a, Overview. Snapshot Raman, smFISH and brightfield images were obtained every 12 h, and time-lapse Raman and brightfield were collected every 6 h and 30 min, respectively. scRNA-seq was collected in an independent experiment. Anchor-based R2R was trained on the paired Raman and smFISH data and applied to generate scRNA-seq from the Raman time-lapse data. bf, Anchor-based R2R generates cell profiles consistent with a scRNA-seq time course. UMAP co-embedding of R2R-generated and measured (scRNA-seq) profiles (dots) colored by source of cell (b), time point (c), scRNA-seq cell types (d), scRNA-seq measured gene score of XEN marker gene expression (e), or R2R-predicted gene score of XEN marker gene expression (f). g, scRNA-seq measured (y axis) and R2R-predicted (x axis) for each gene (dot) in pseudo-bulk RNA profiles averaged across mES cells at day 0. h, Pairwise correlation (color bar) between anchor-free Raman-predicted and scRNA-seq measured pseudo-bulk profiles in each cell type (rows, columns). i,j, Live cell tracking layered on R2R-generated profiles. UMAP as in c but with R2R-generated profiles connected by live cell tracking of underlying cells from brightfield time-lapse images that lead either to XEN-like (i) or ectoderm-like (j) cell fate. k, Prediction of smFISH anchors from Raman spectra. Cosine similarity (y axis) between measured (smFISH) and Raman-predicted levels for each smFISH anchor (x axis) in LOOCV, where three out of four smFISH anchor genes were used for training, and the left-out gene was predicted. Error bars: standard error of five trials with different subset of cells, and mean values at center. l, Mean expression (y axis) of marker genes (color) of each lineage (color) at different time points (x axis) post RA induction along XEN-like (solid) and ectoderm-like (dashed) trajectories. Error bars: standard error of expression level across cells with same lineage (nectoderm = 148, nXEN = 200).

References

    1. Tanay A & Regev A Scaling single-cell genomics from phenomenology to mechanism. Nature 541, 331–338 (2017). - PMC - PubMed
    1. Trapnell C et al. The dynamics and regulators of cell fate decisions are revealed by pseudotemporal ordering of single cells. Nat. Biotechnol. 32, 381–386 (2014). - PMC - PubMed
    1. Schiebinger G et al. Optimal-transport analysis of single-cell gene expression identifies developmental trajectories in reprogramming. Cell 176, 928–943.e22 (2019). - PMC - PubMed
    1. La Manno G et al. RNA velocity of single cells. Nature 560, 494–498 (2018). - PMC - PubMed
    1. Bergen V, Lange M, Peidli S, Wolf FA & Theis FJ Generalizing RNA velocity to transient cell states through dynamical modeling. Nat. Biotechnol. 38, 1408–1414 (2020). - PubMed

MeSH terms

LinkOut - more resources