. 2024 Feb;56(2):258-272.
doi: 10.1038/s41588-023-01626-1. Epub 2024 Jan 10.

Integrative functional genomic analyses identify genetic variants influencing skin pigmentation in Africans

Affiliations

Integrative functional genomic analyses identify genetic variants influencing skin pigmentation in Africans

Yuanqing Feng et al. Nat Genet. 2024 Feb.

Abstract

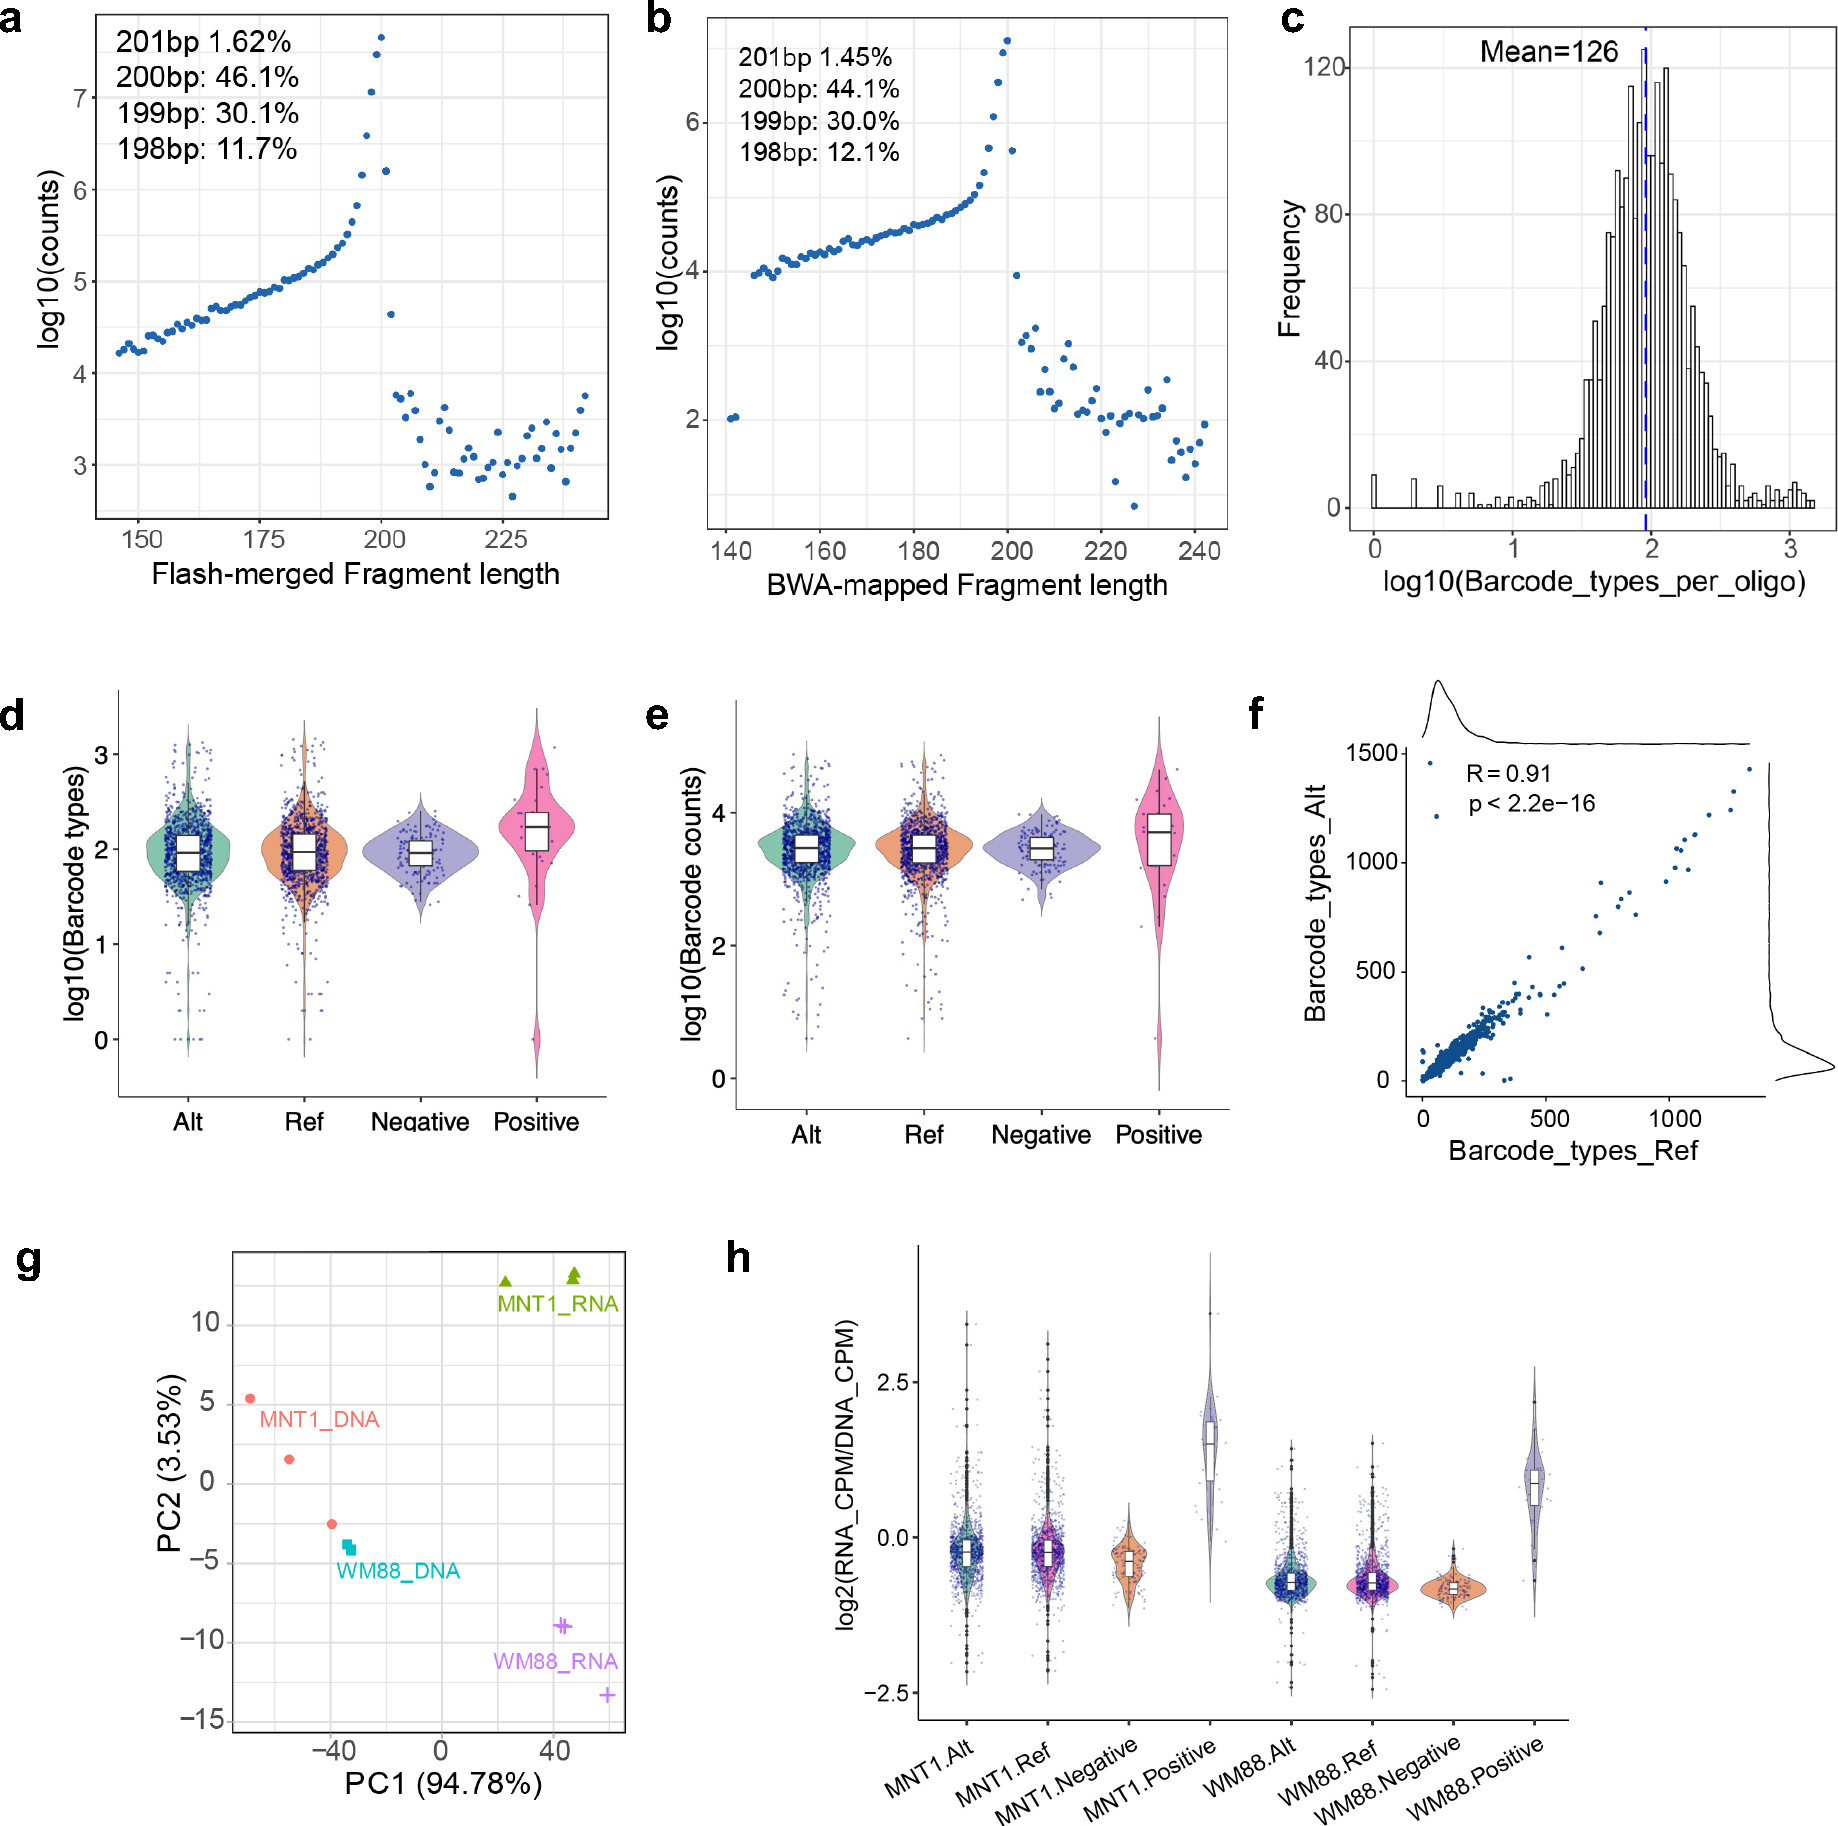
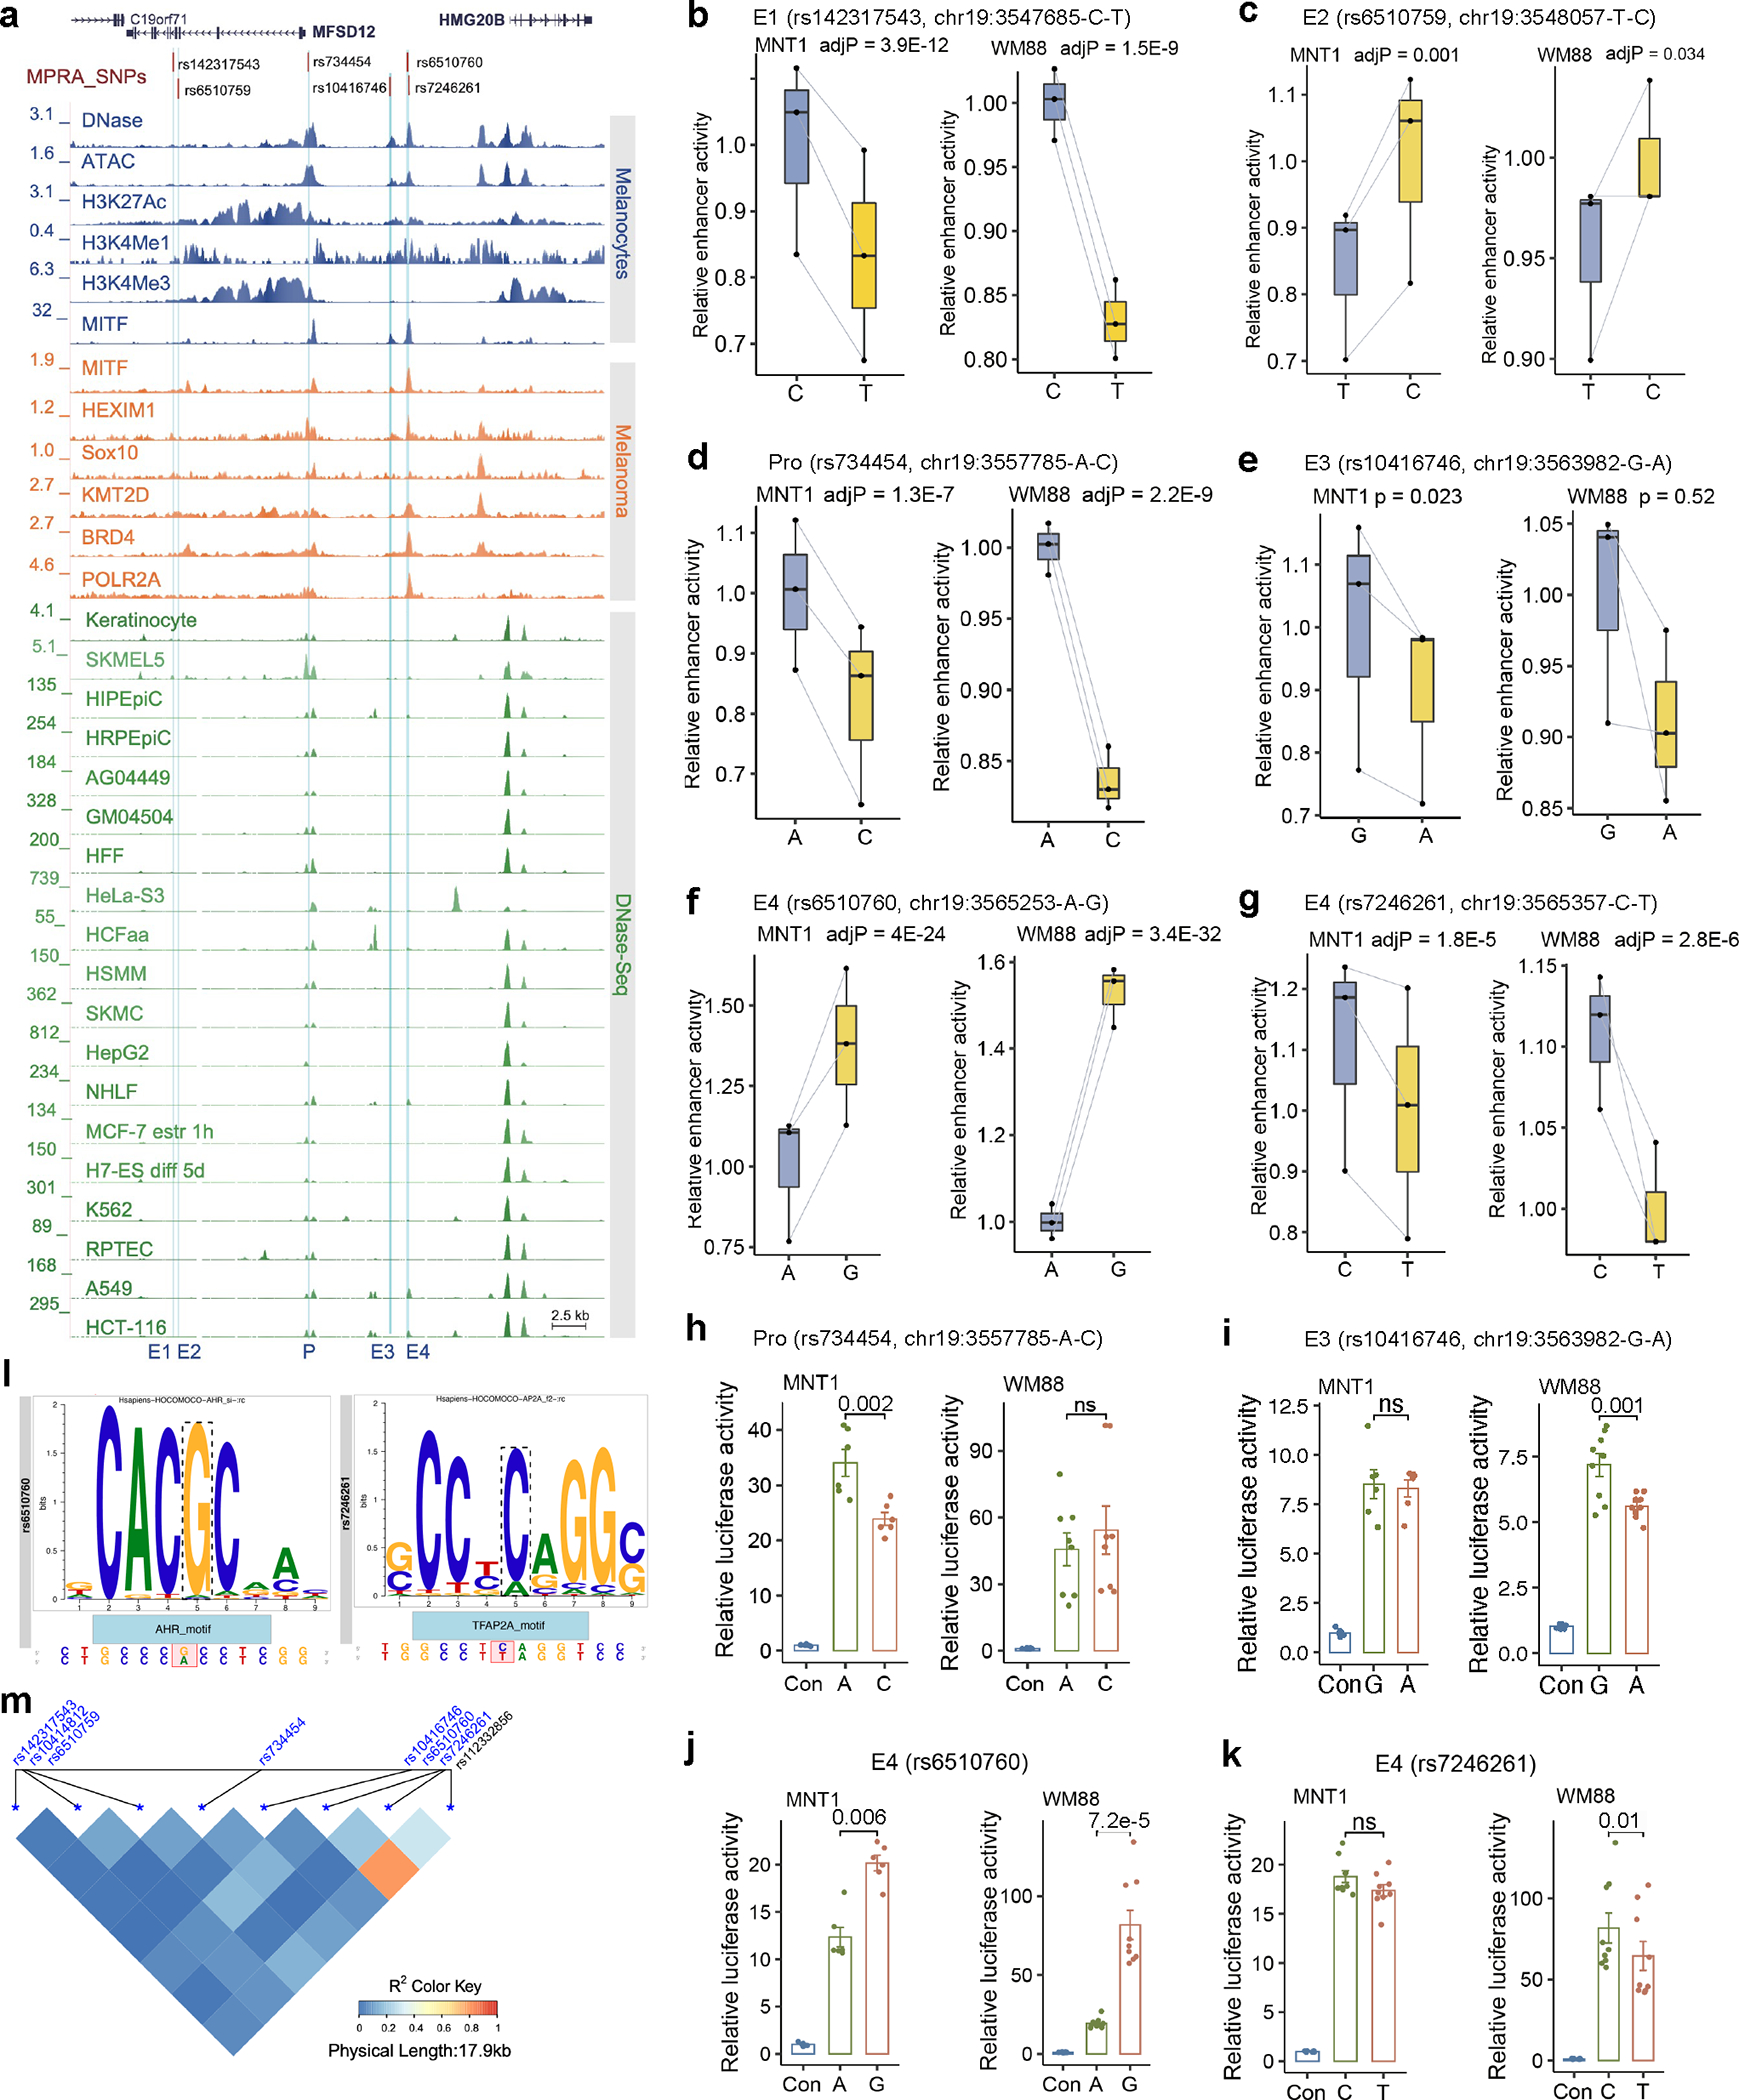
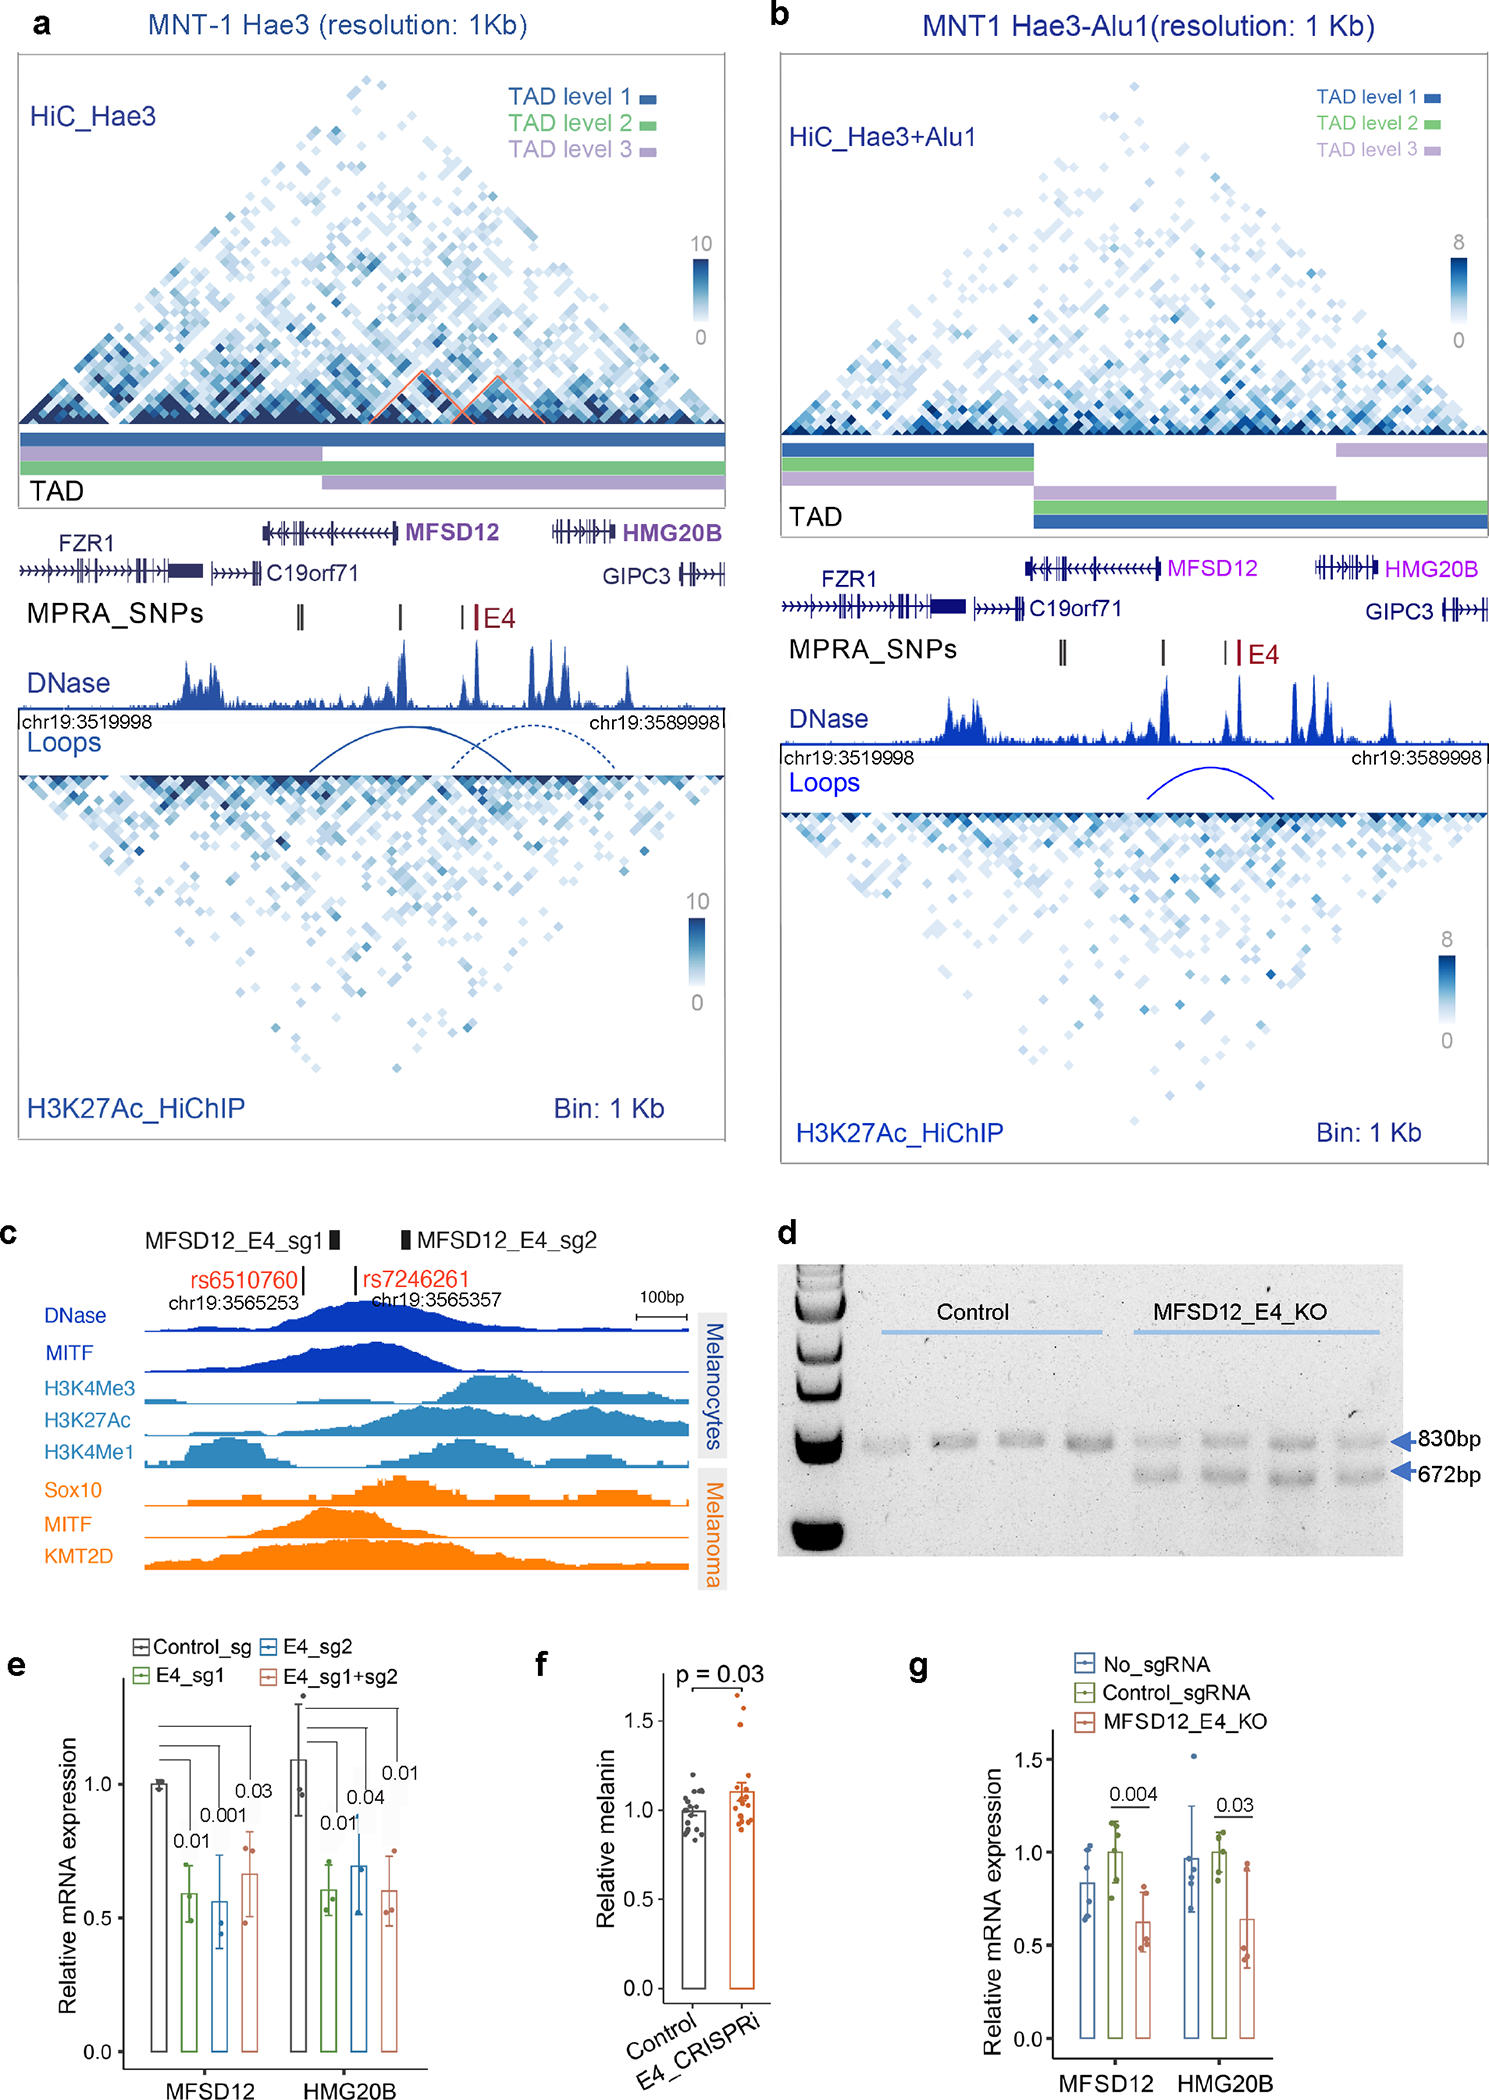
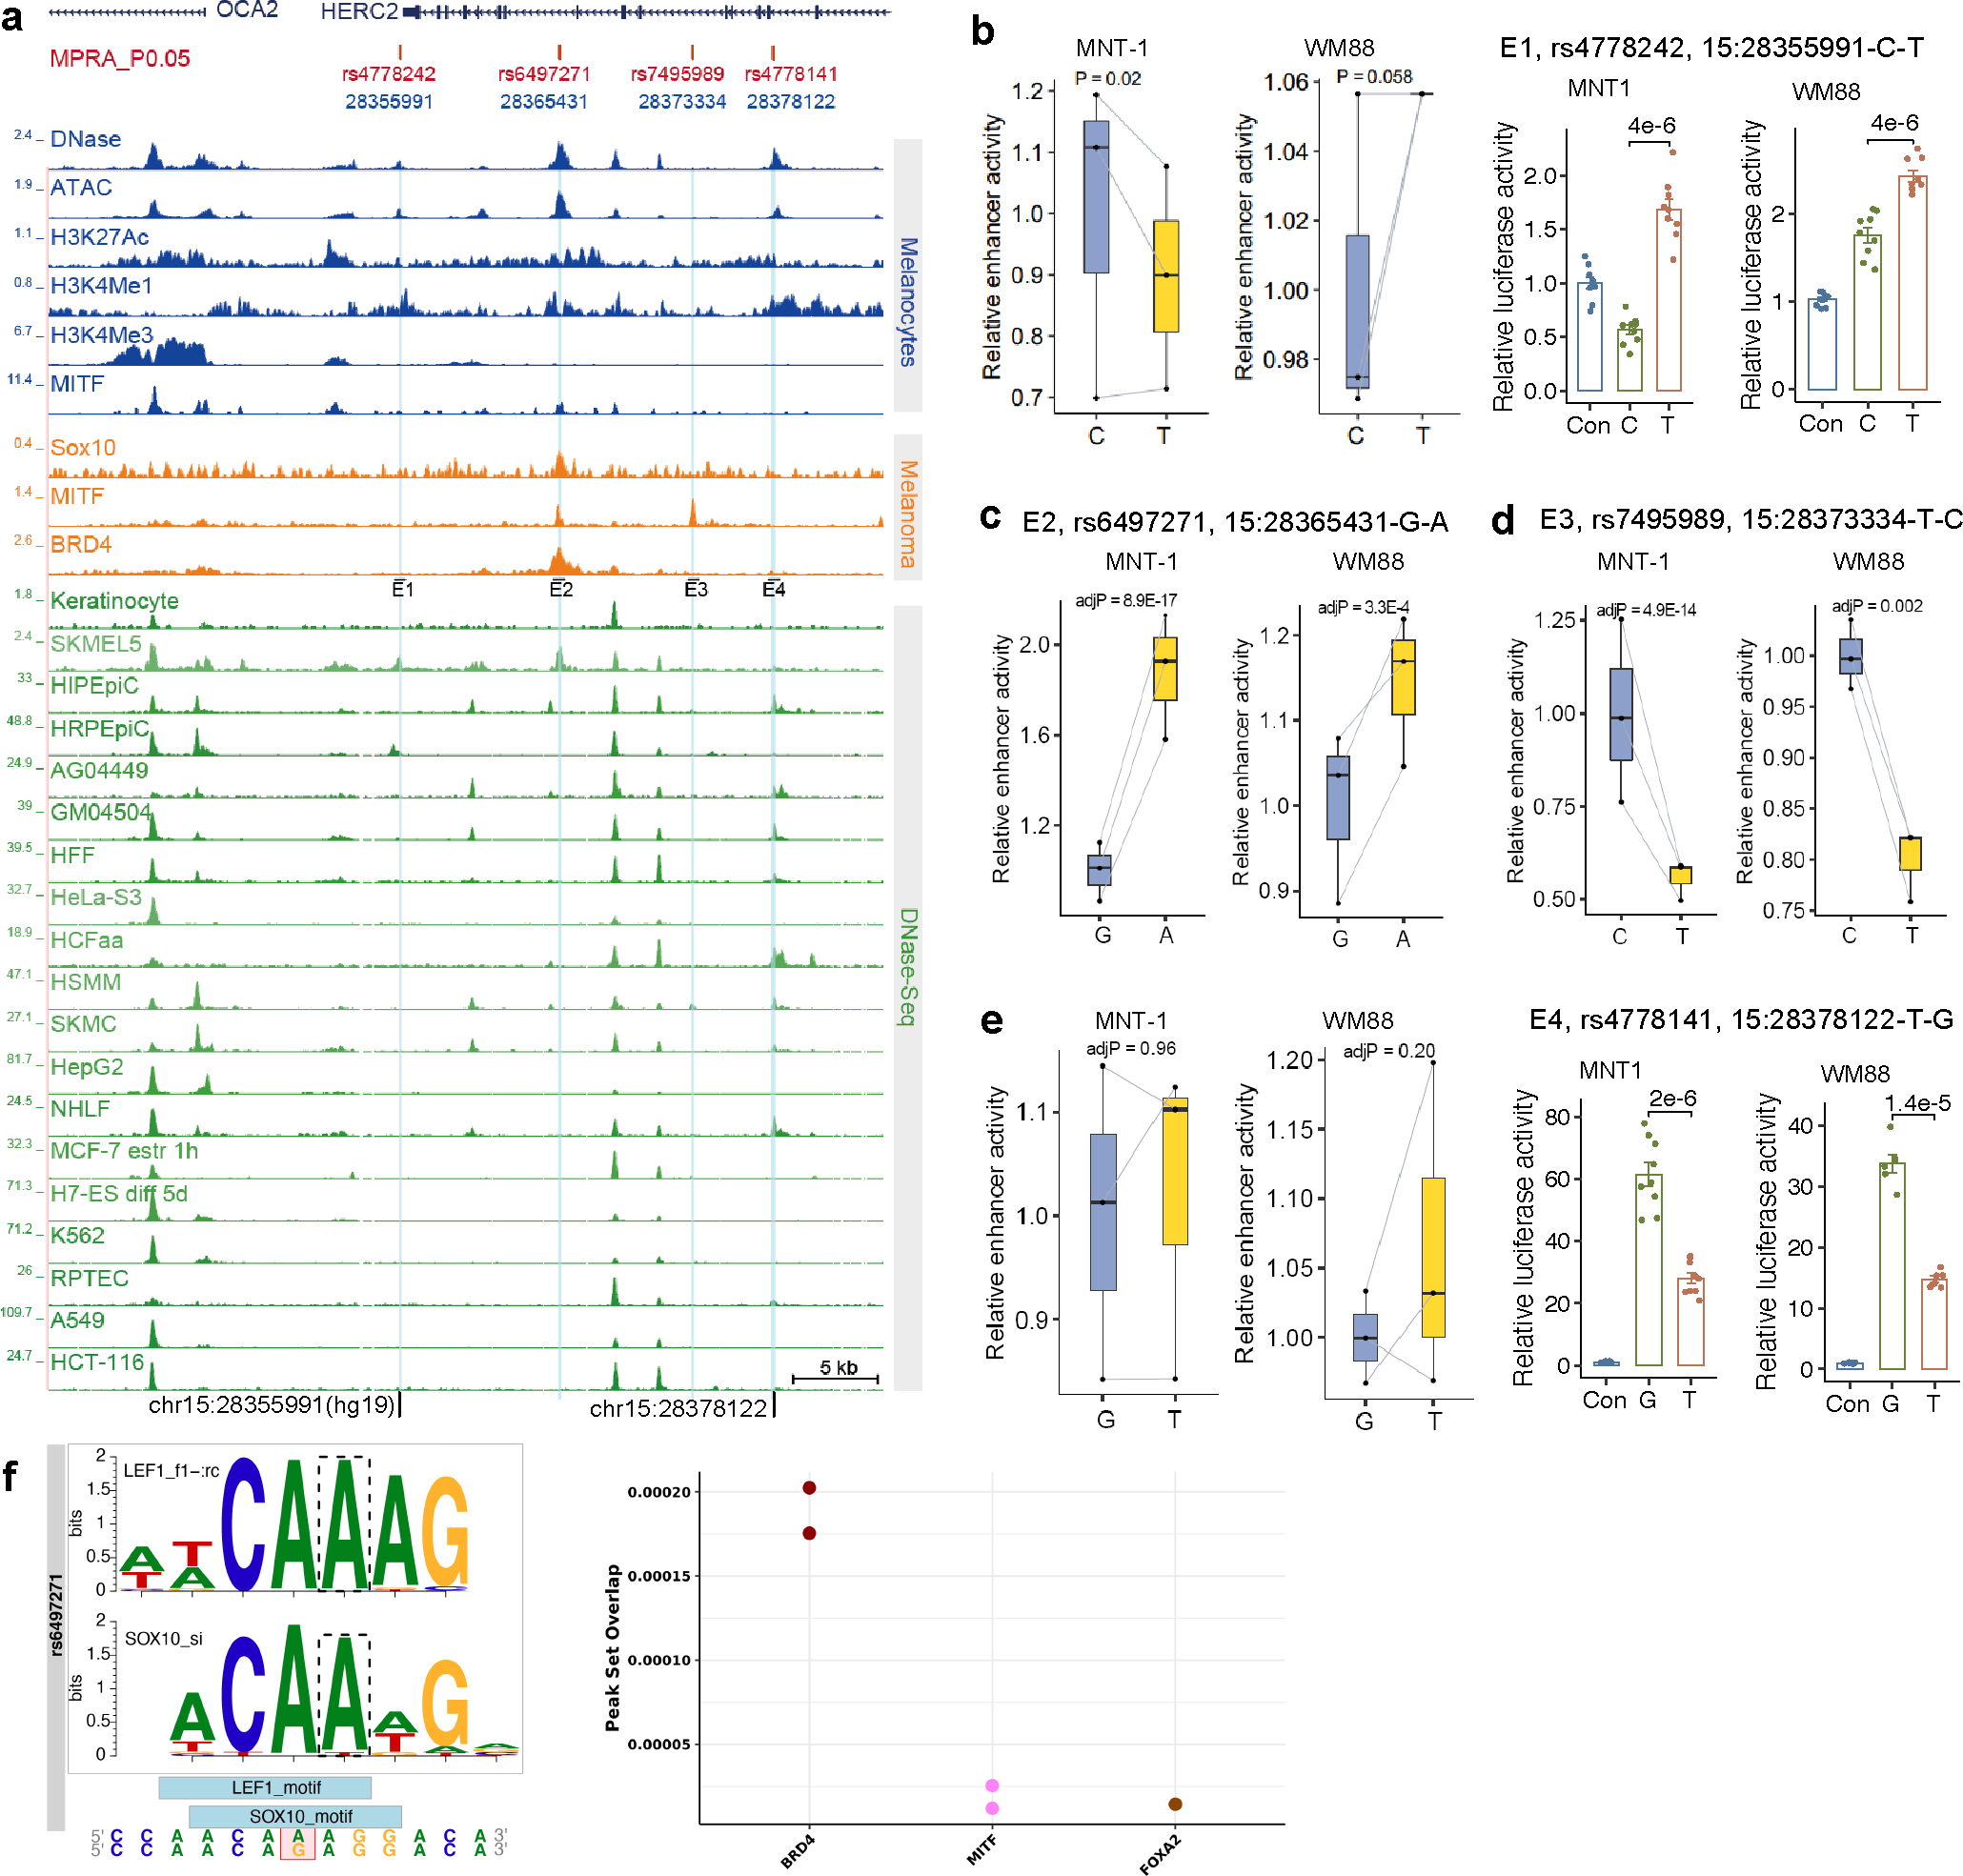
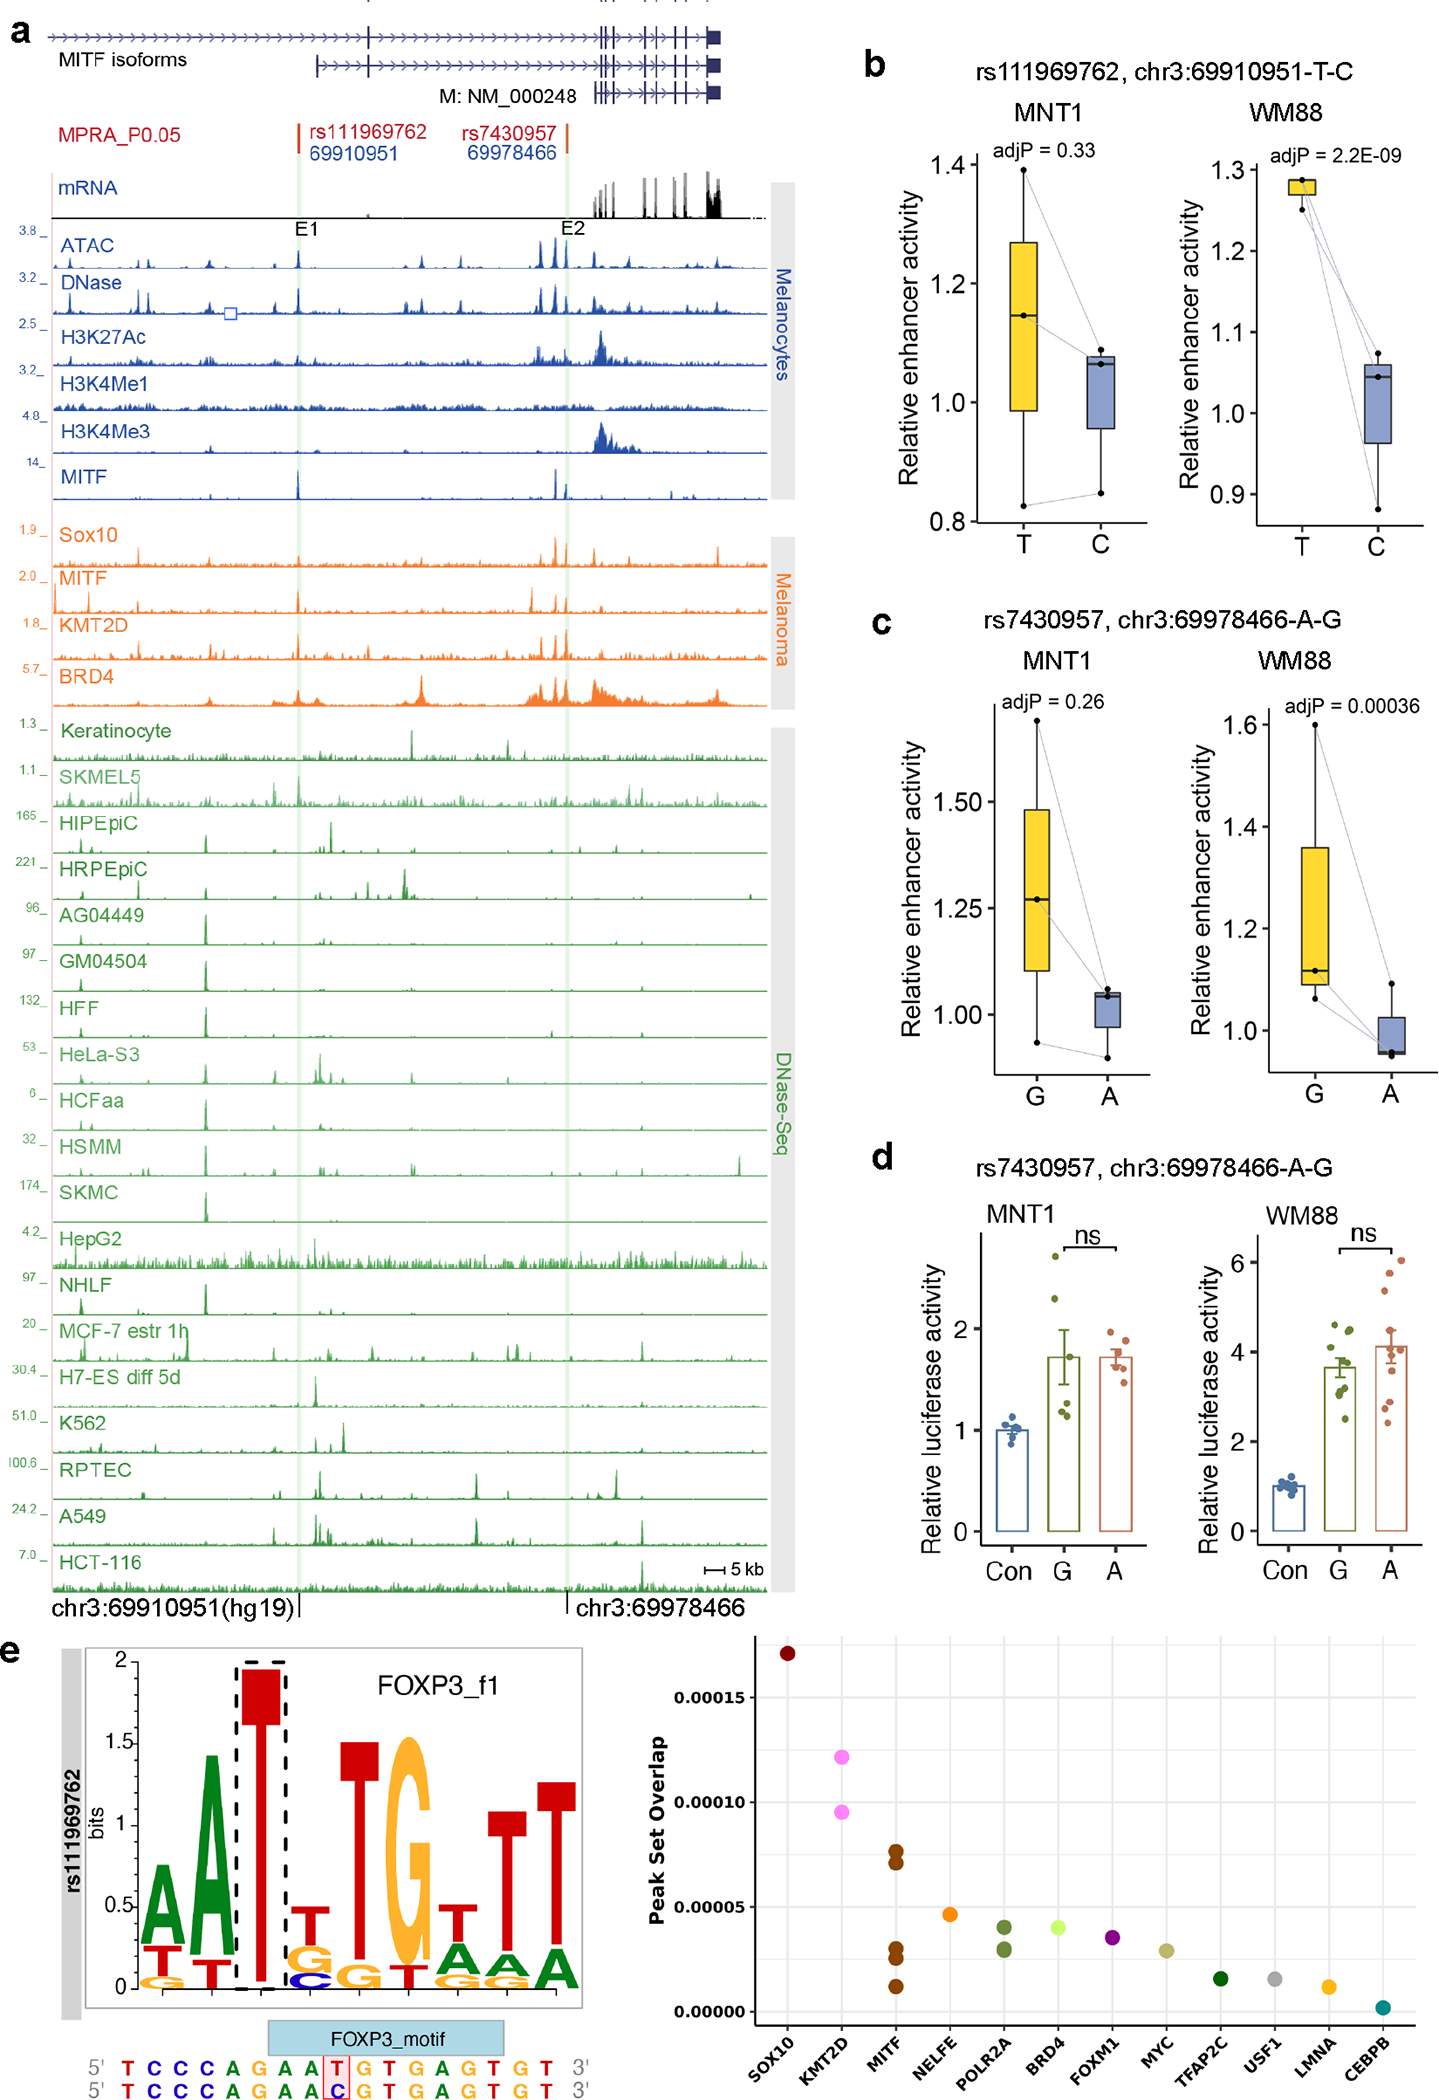
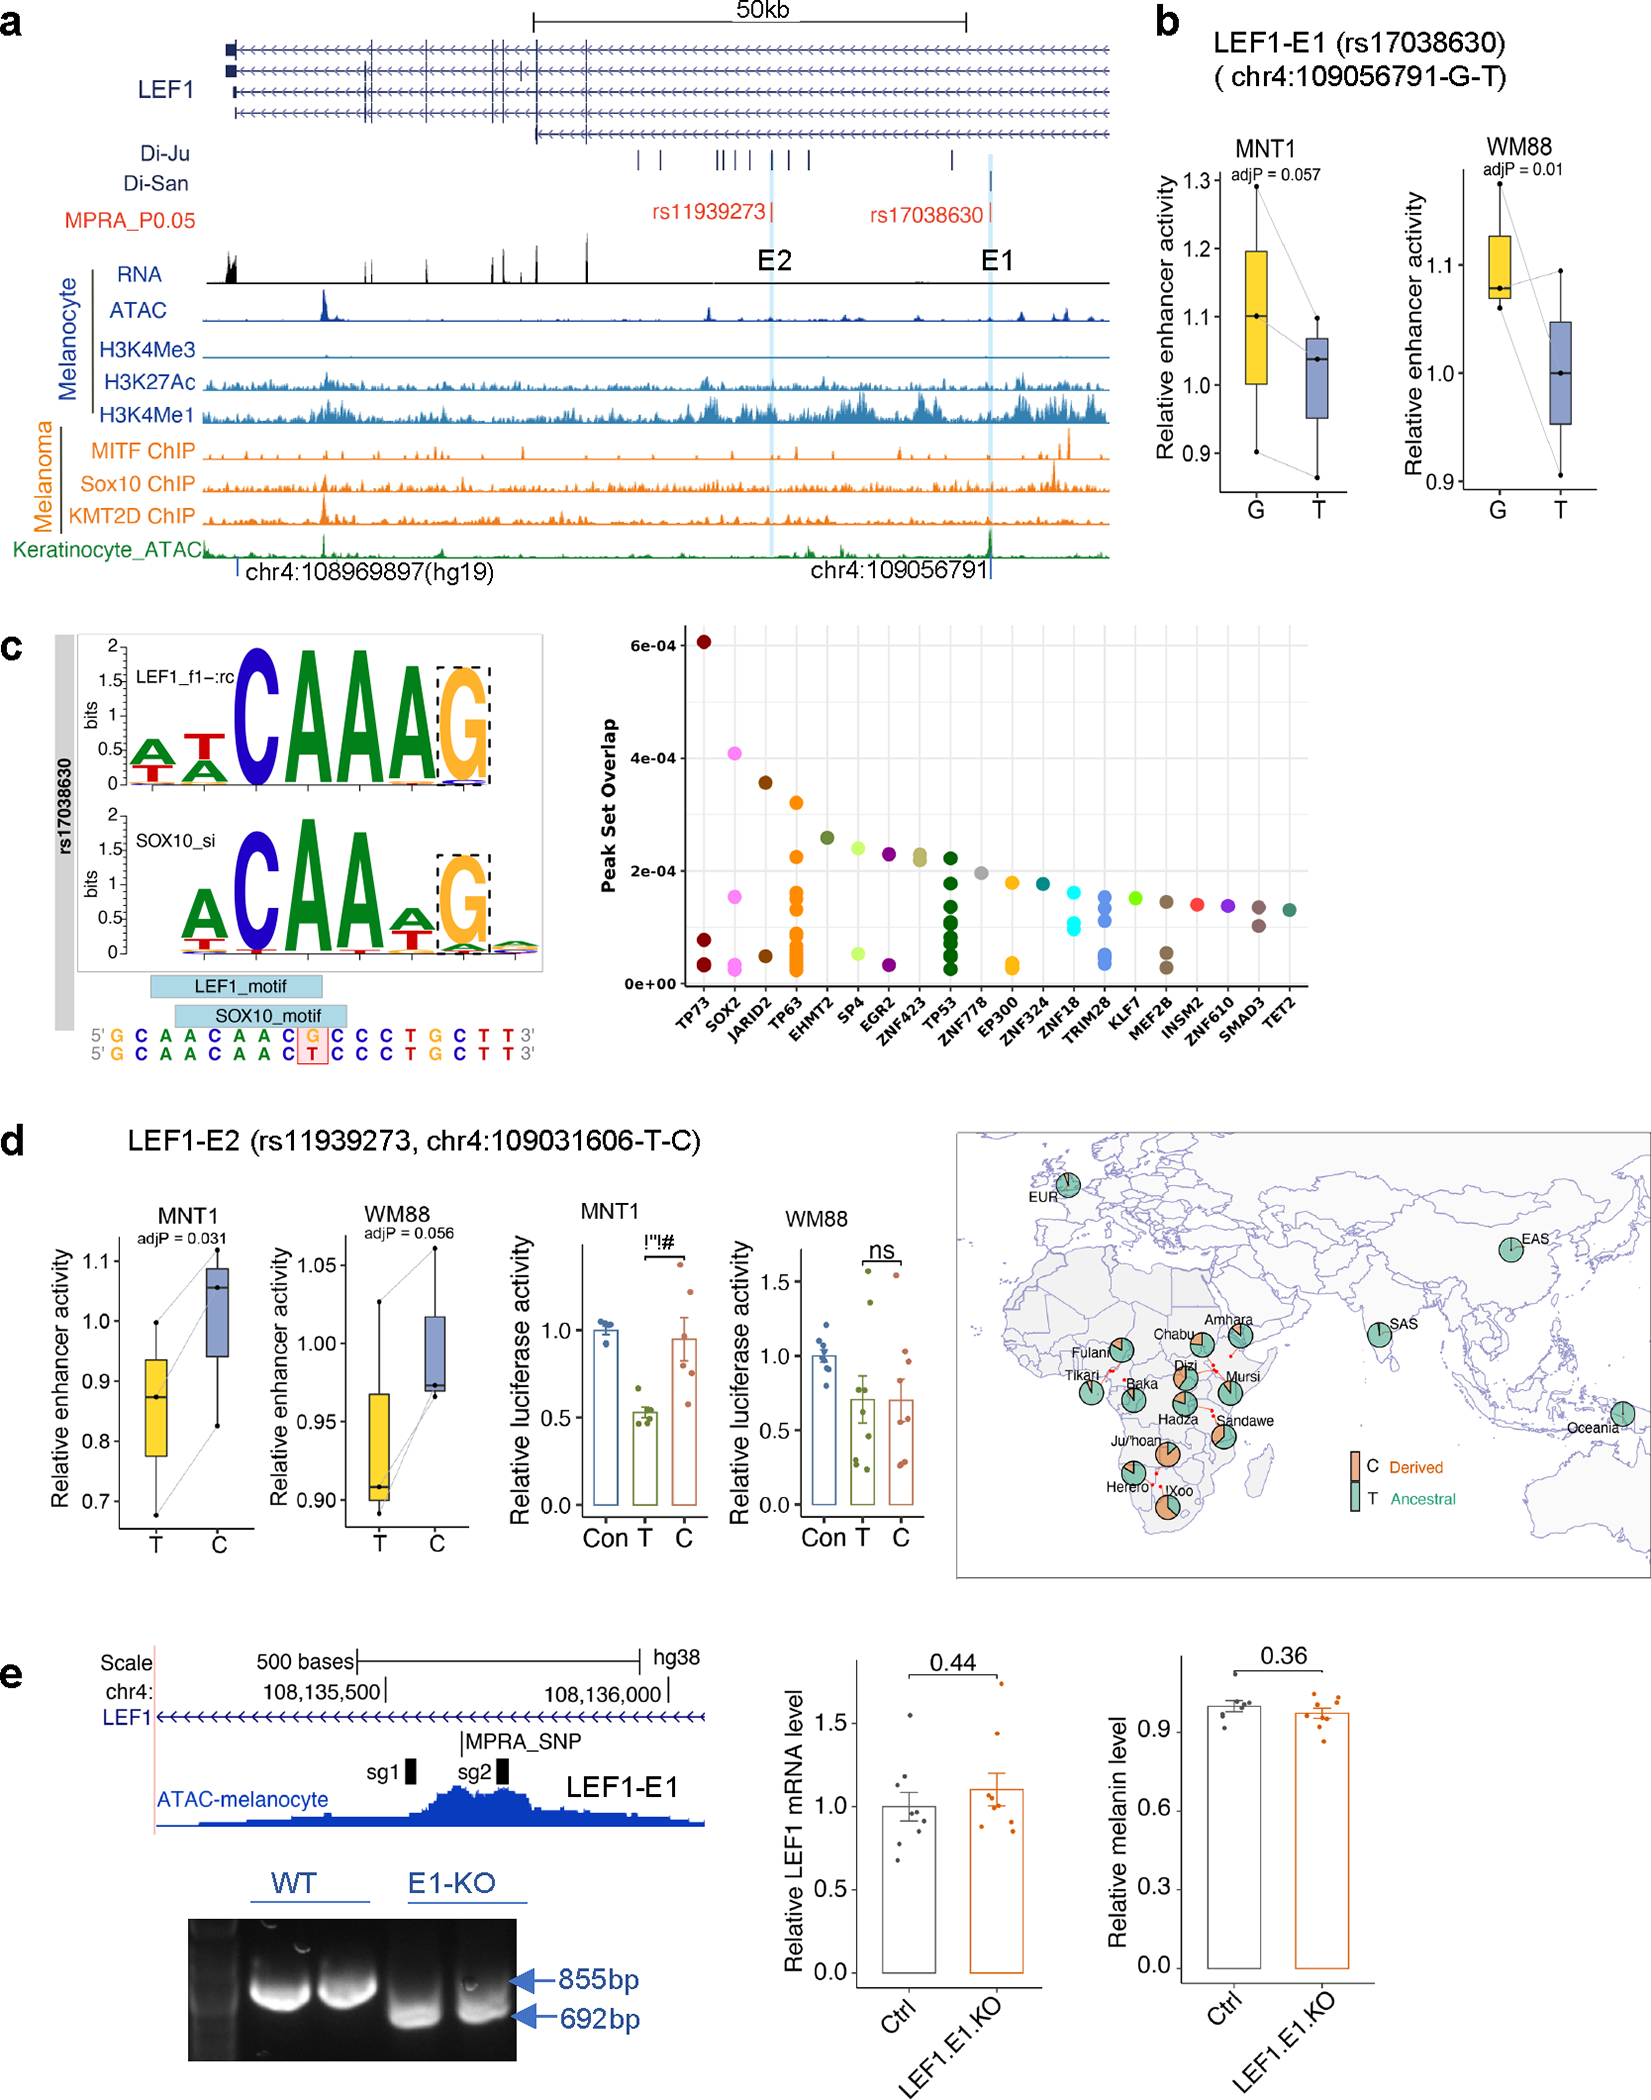
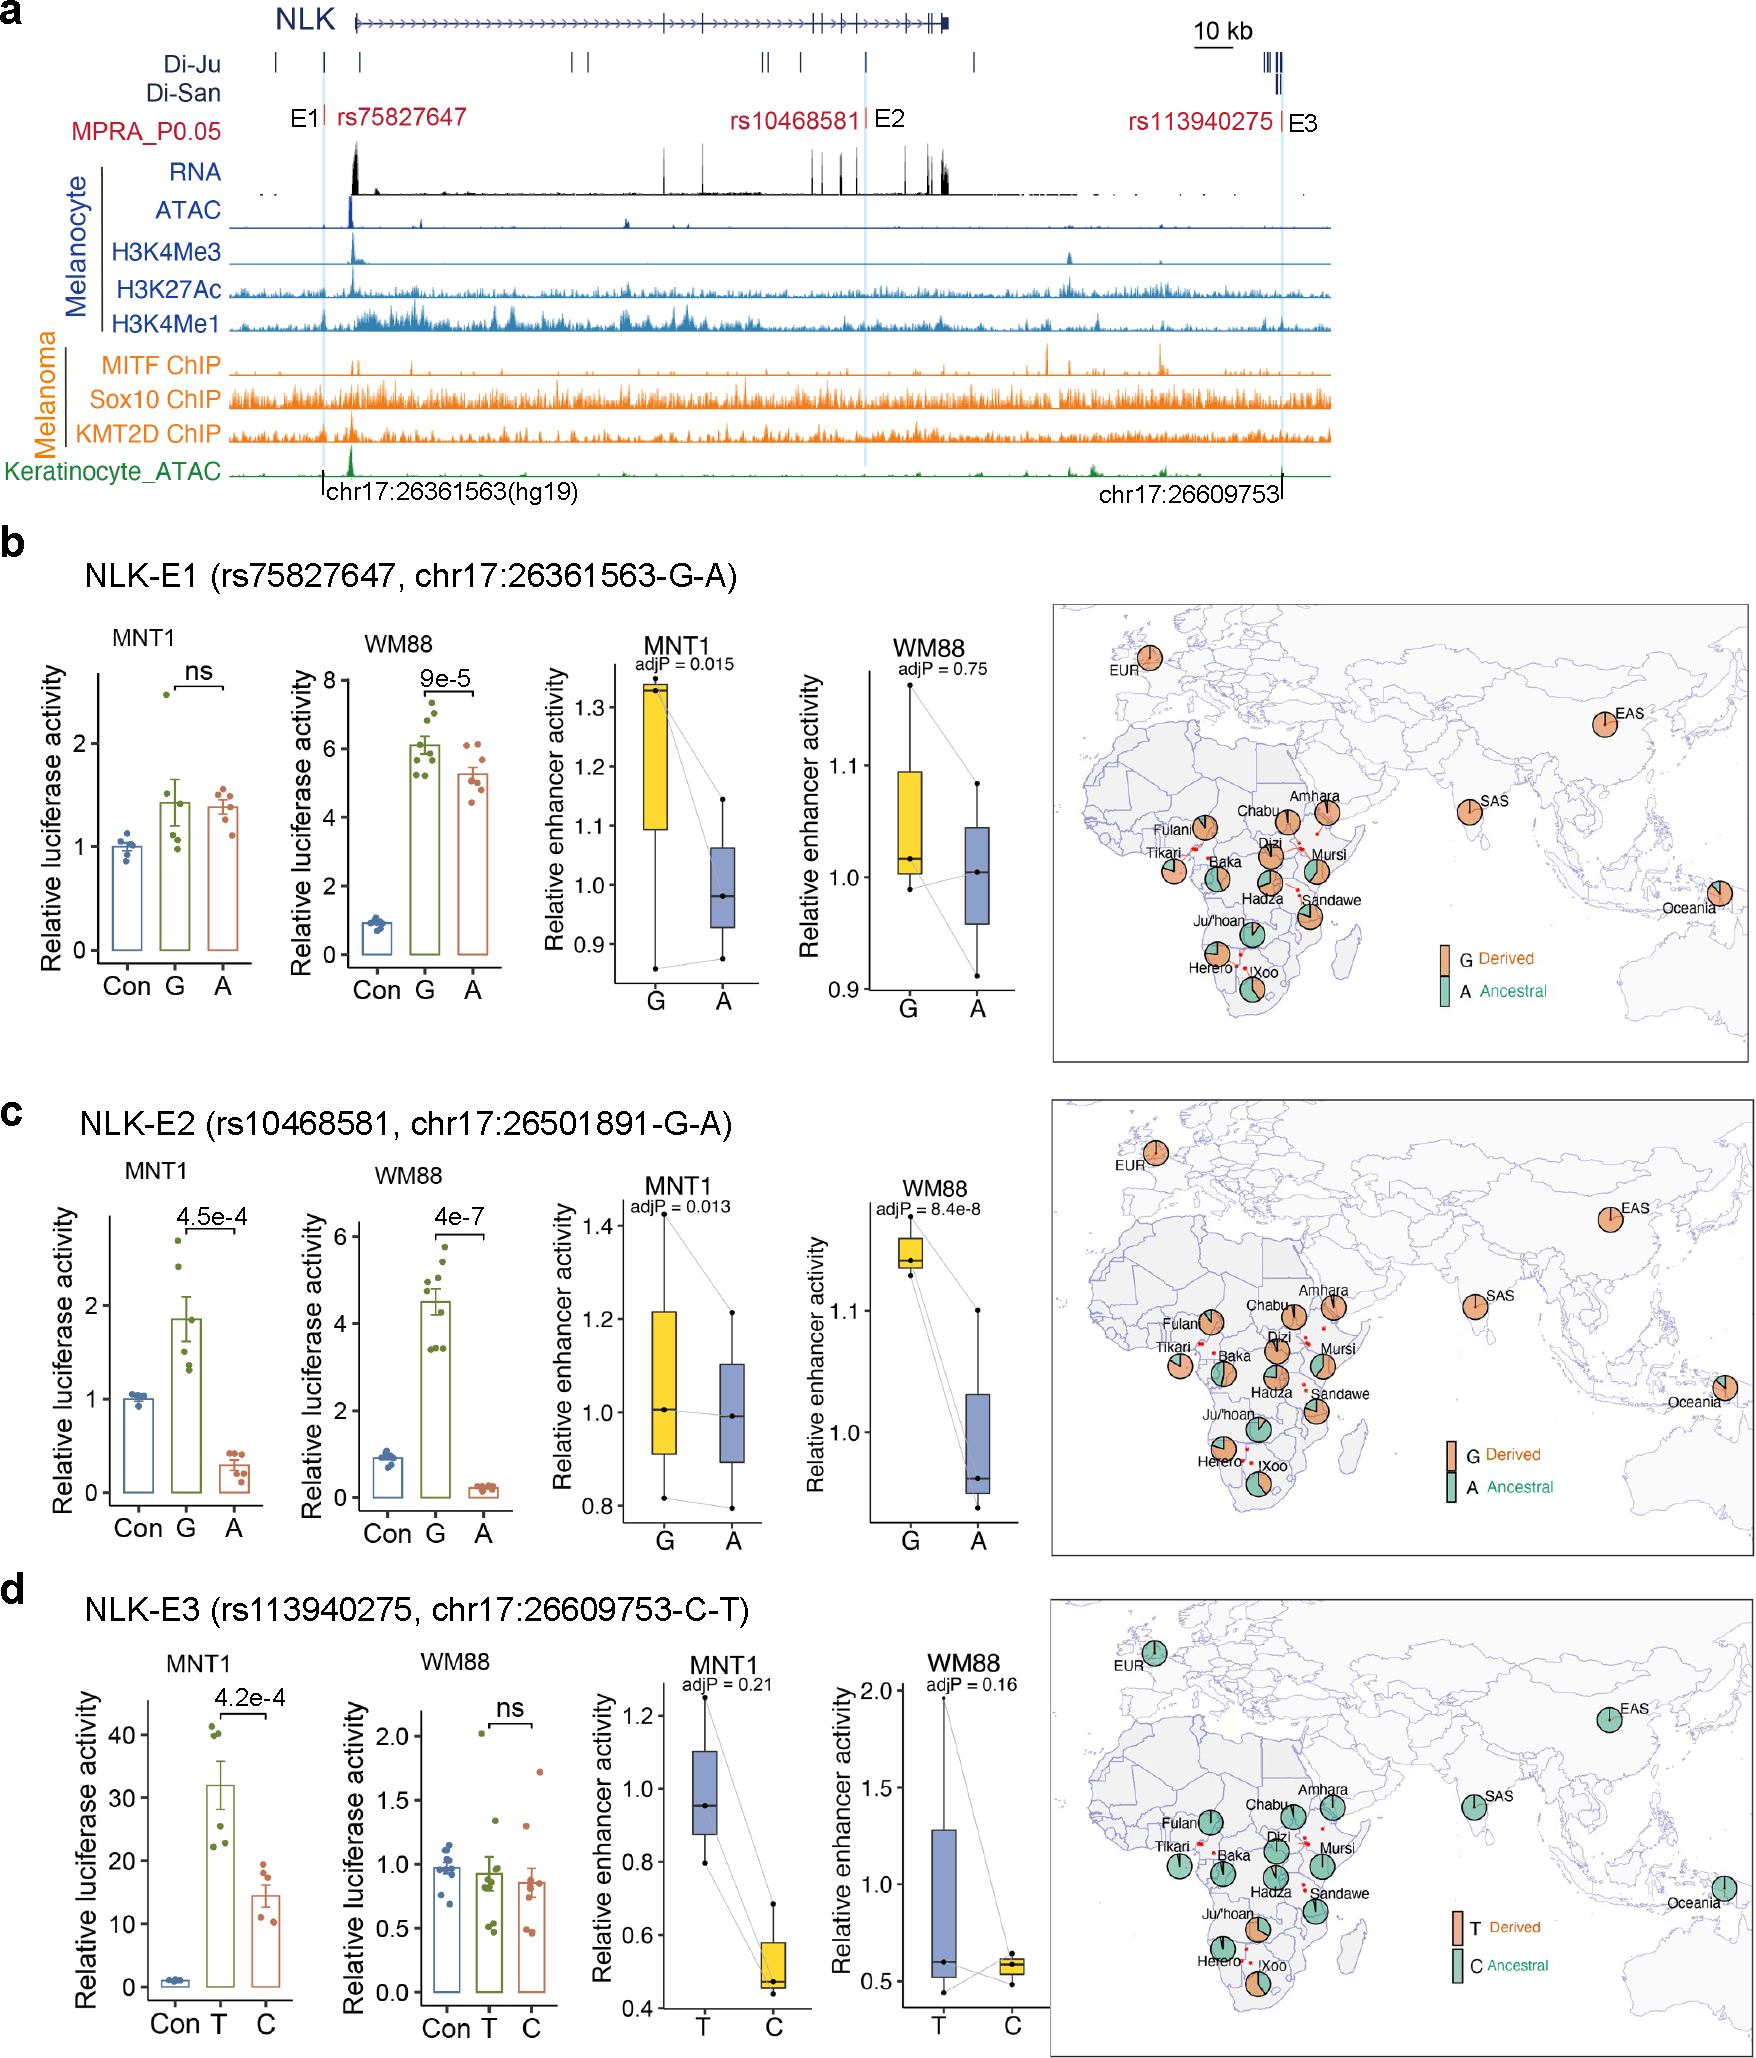
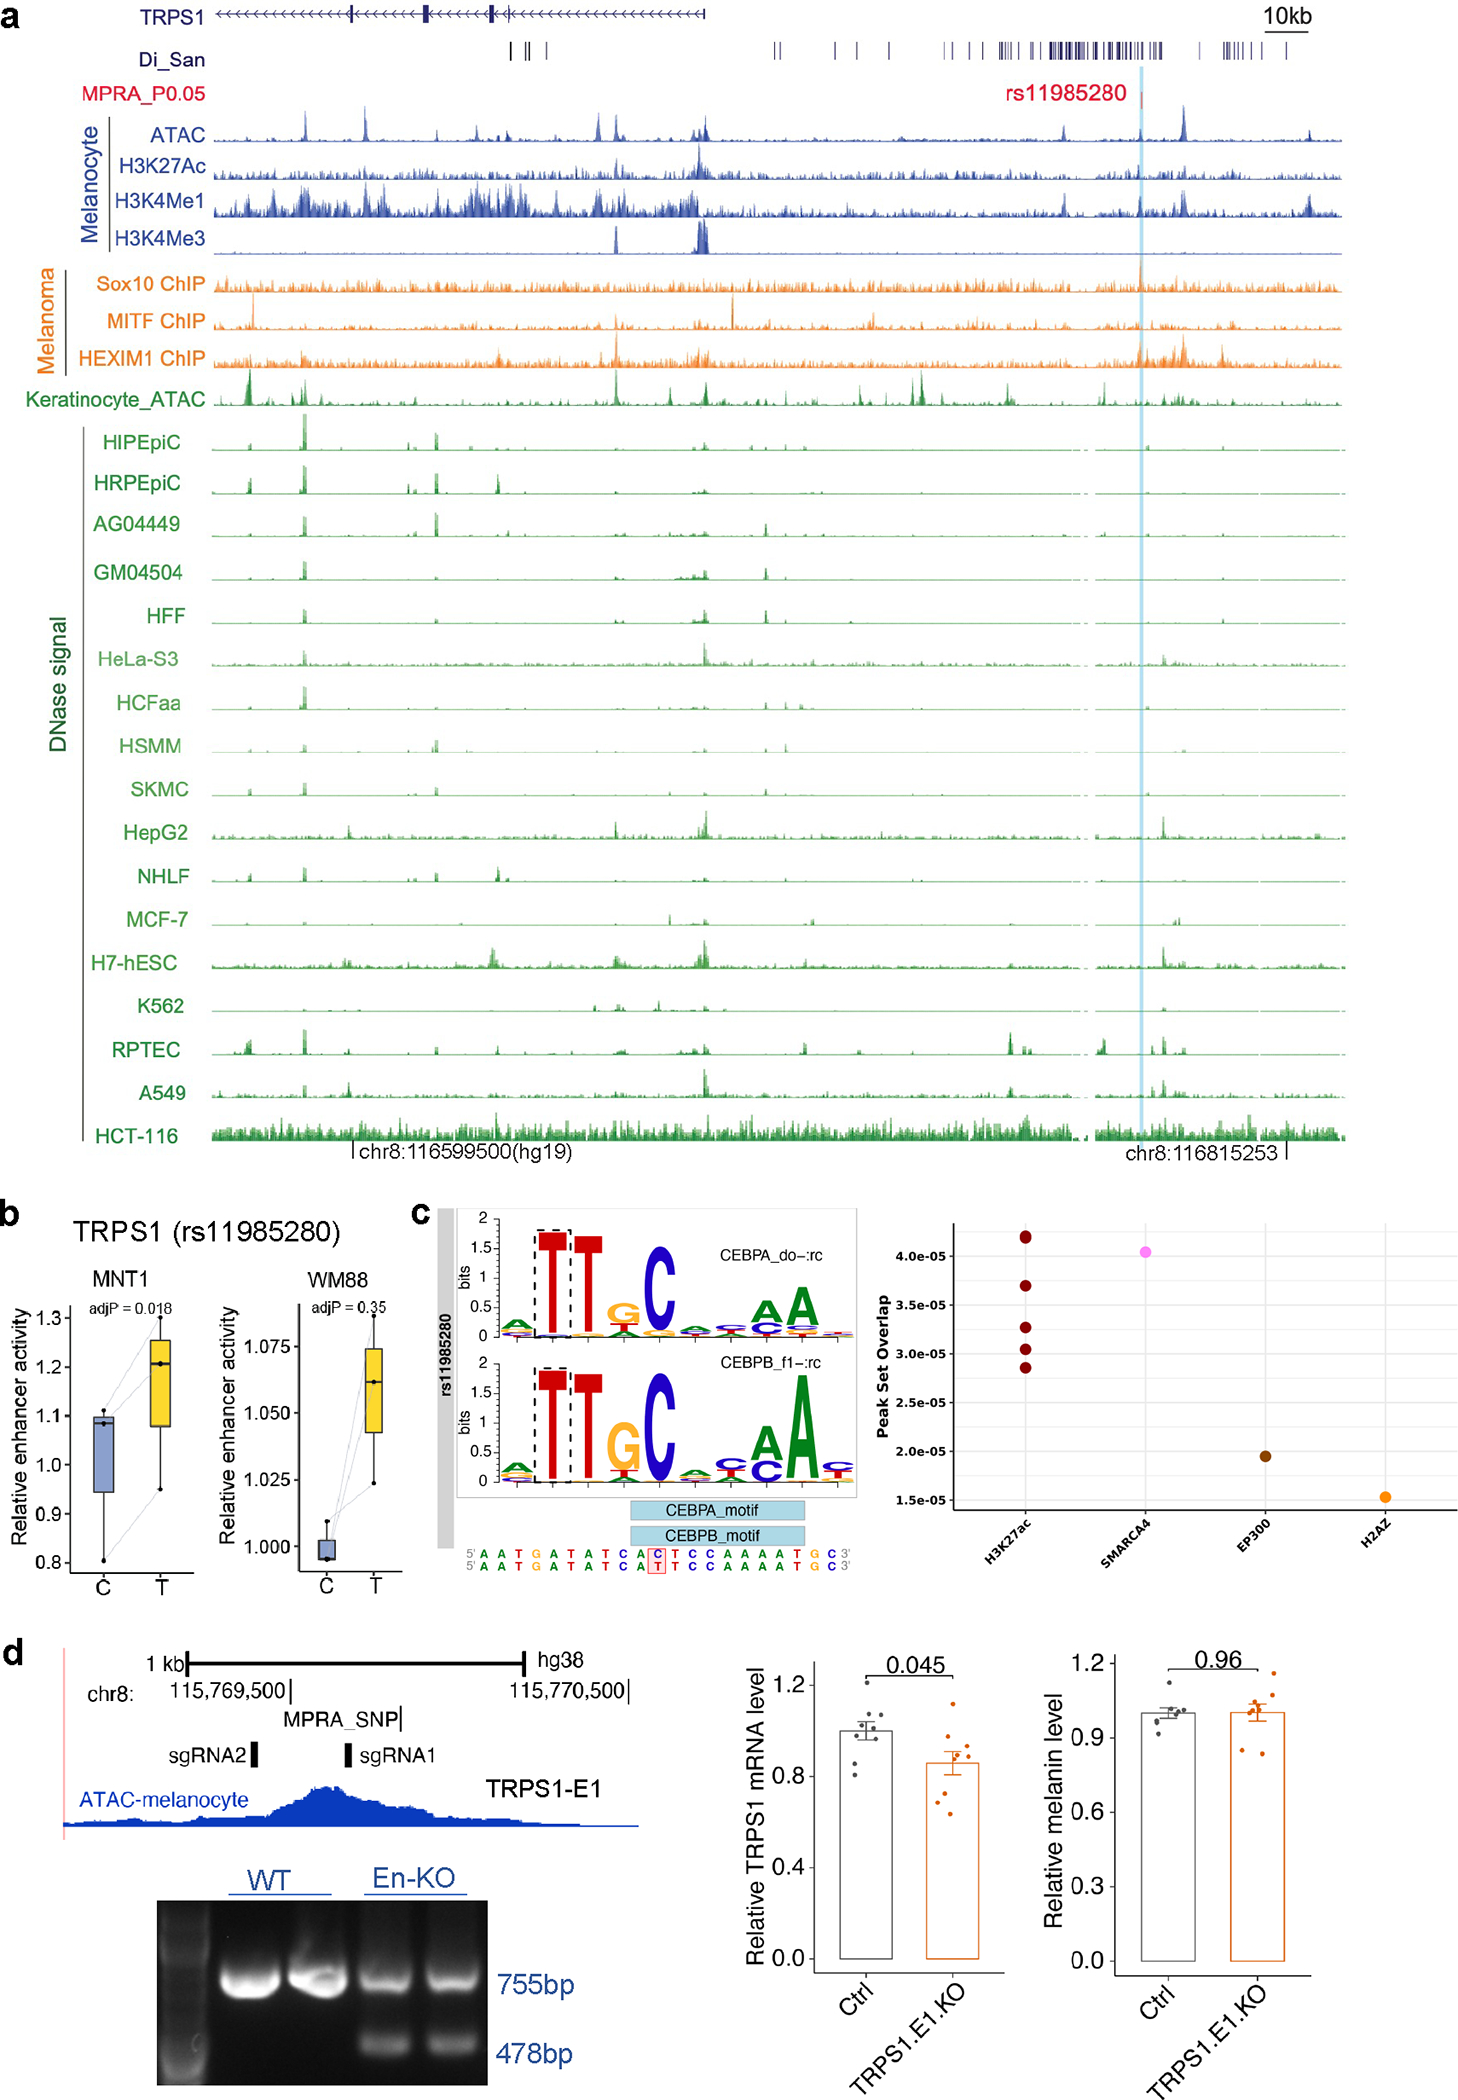
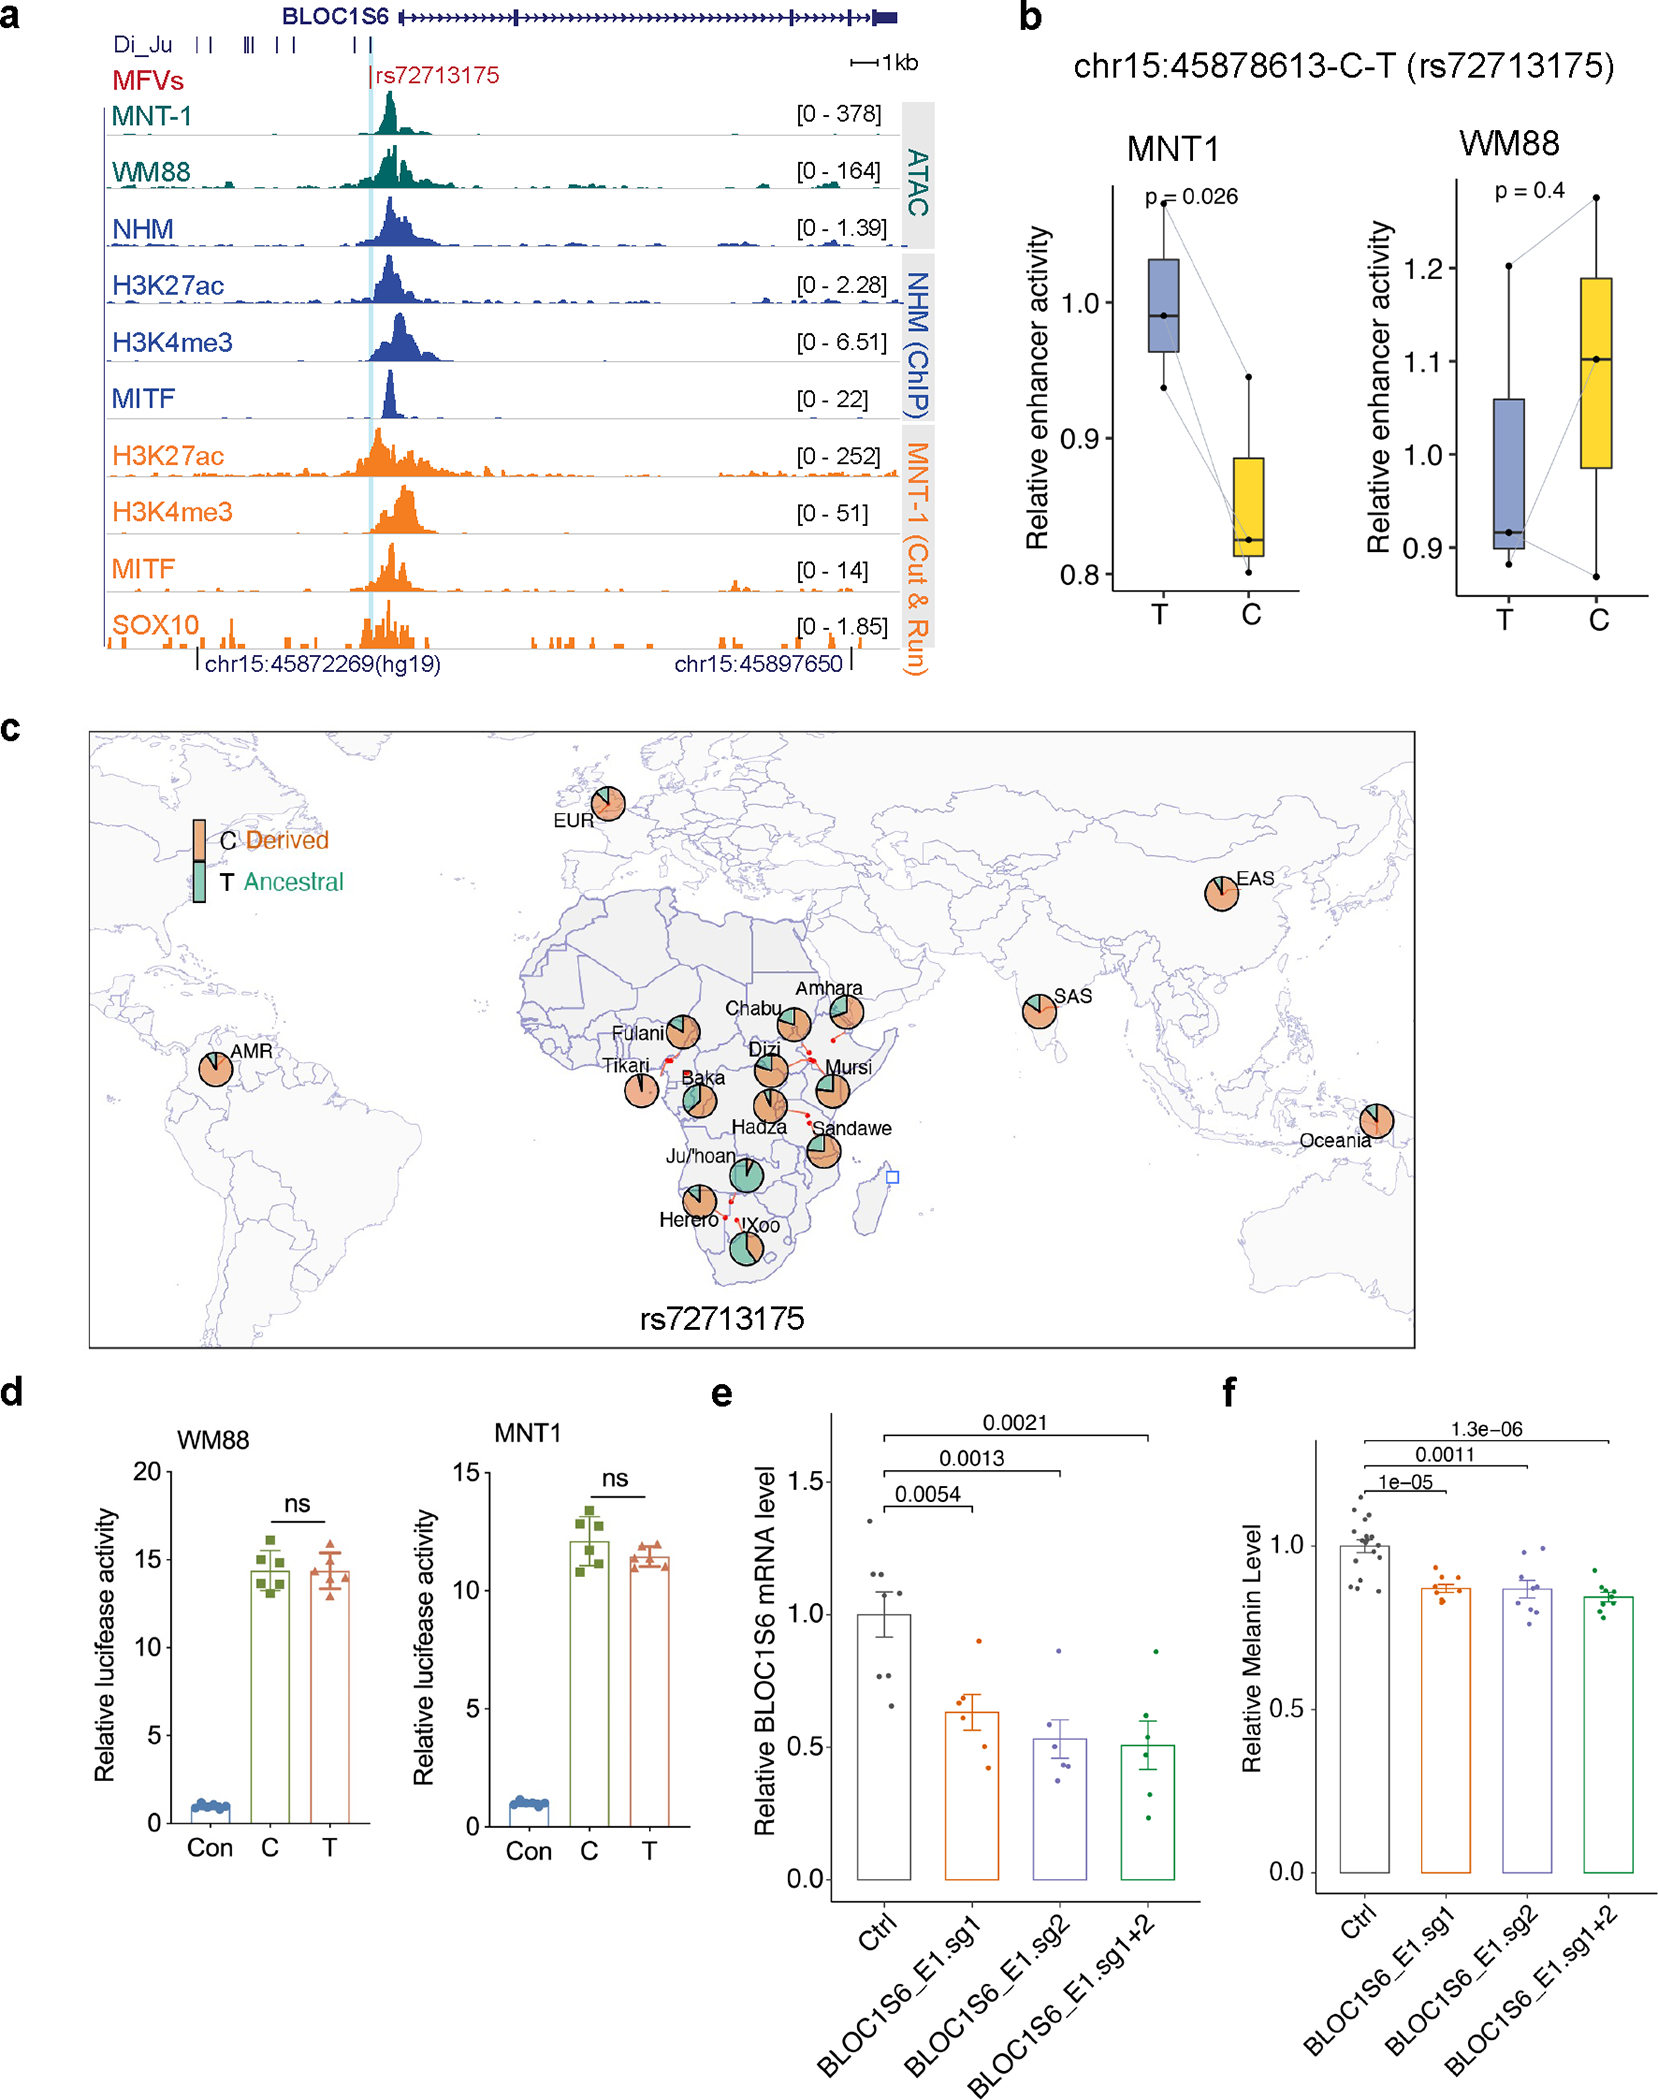
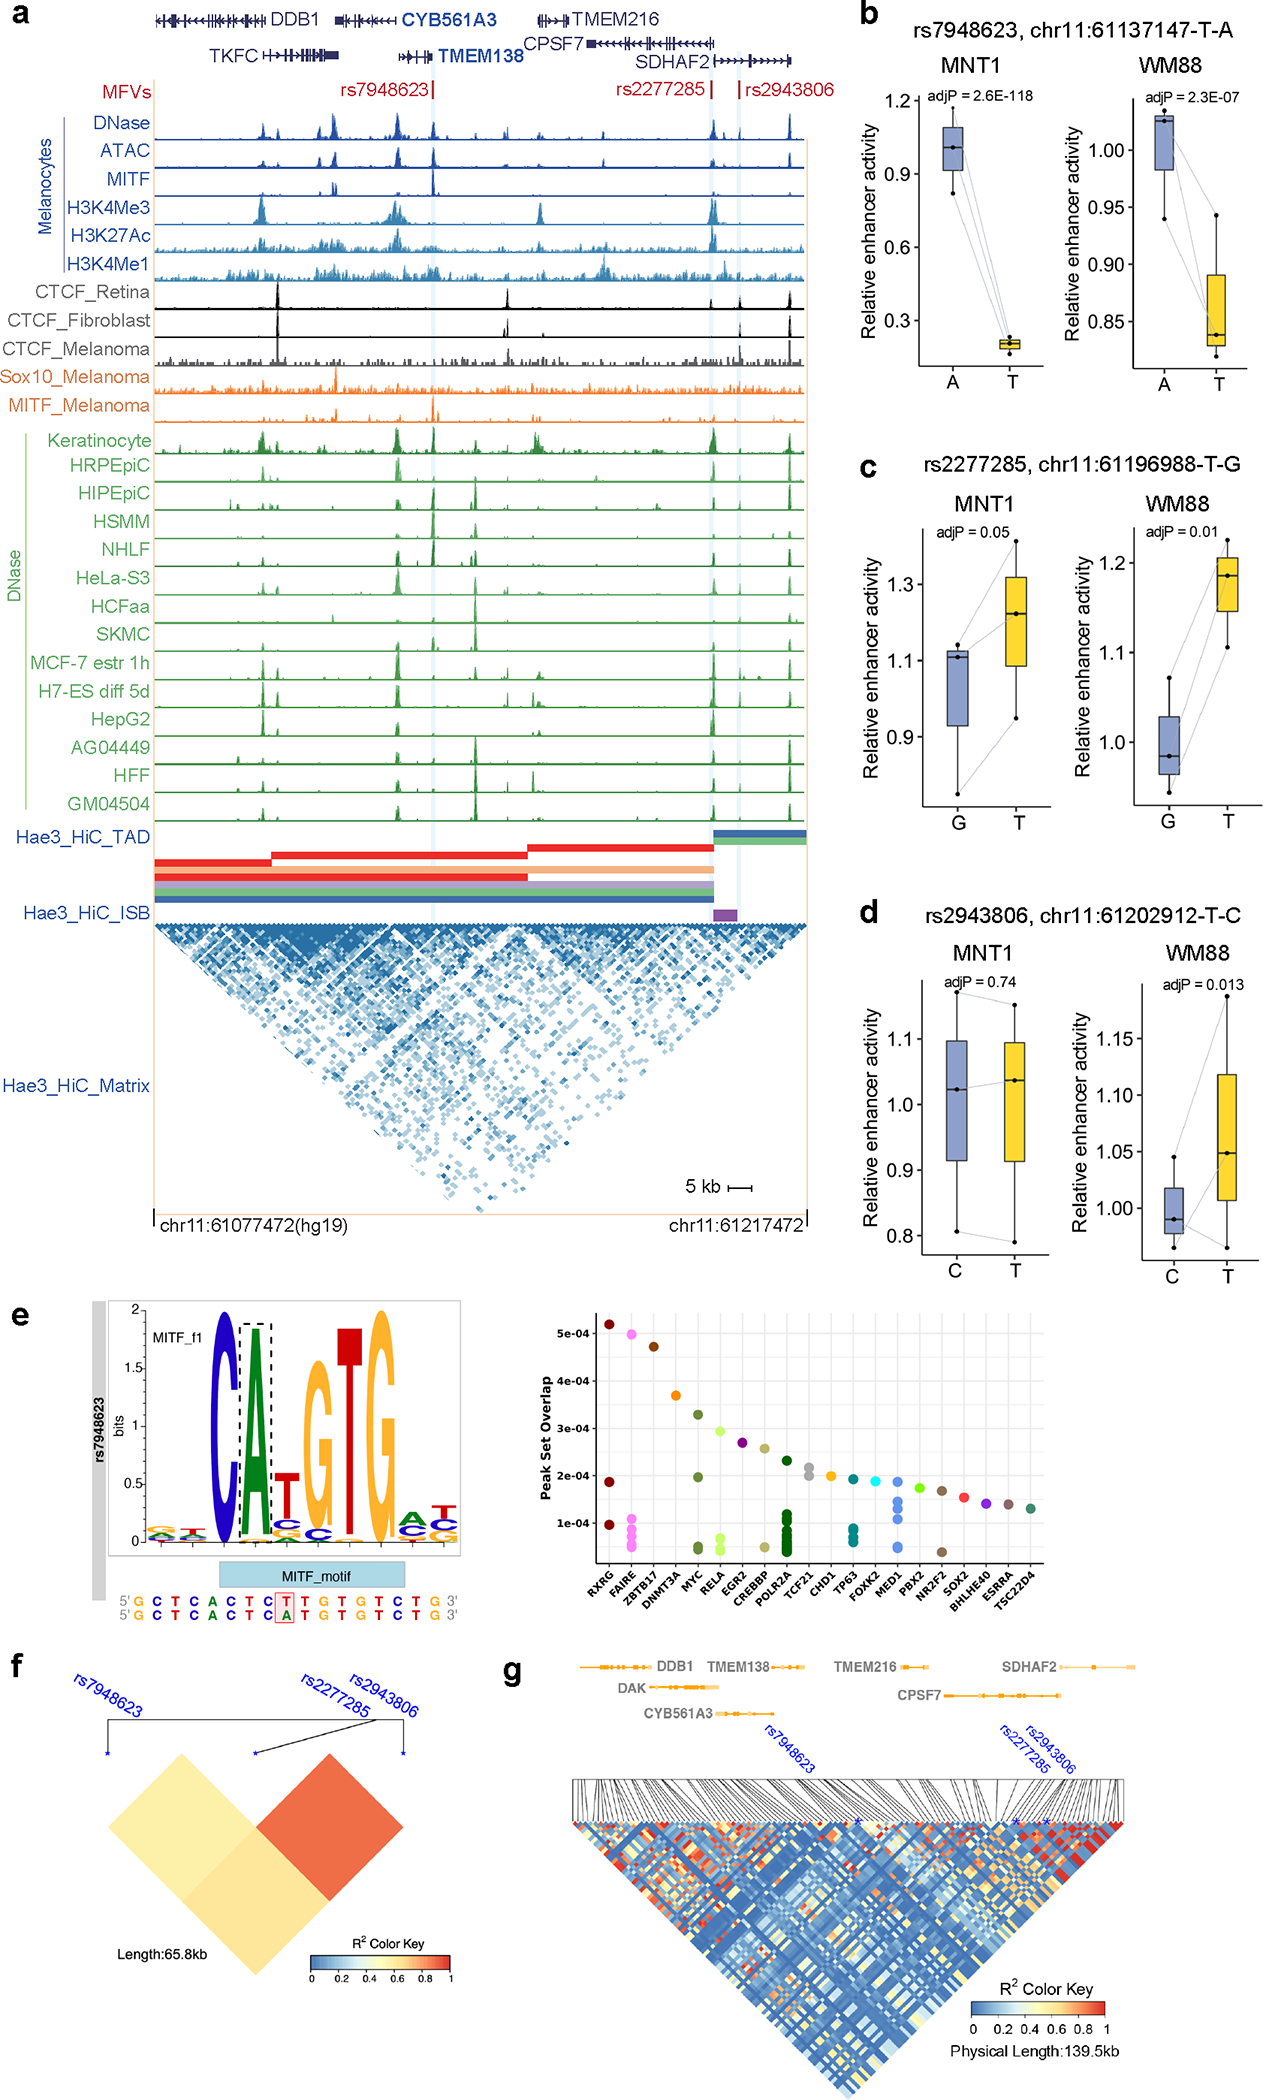
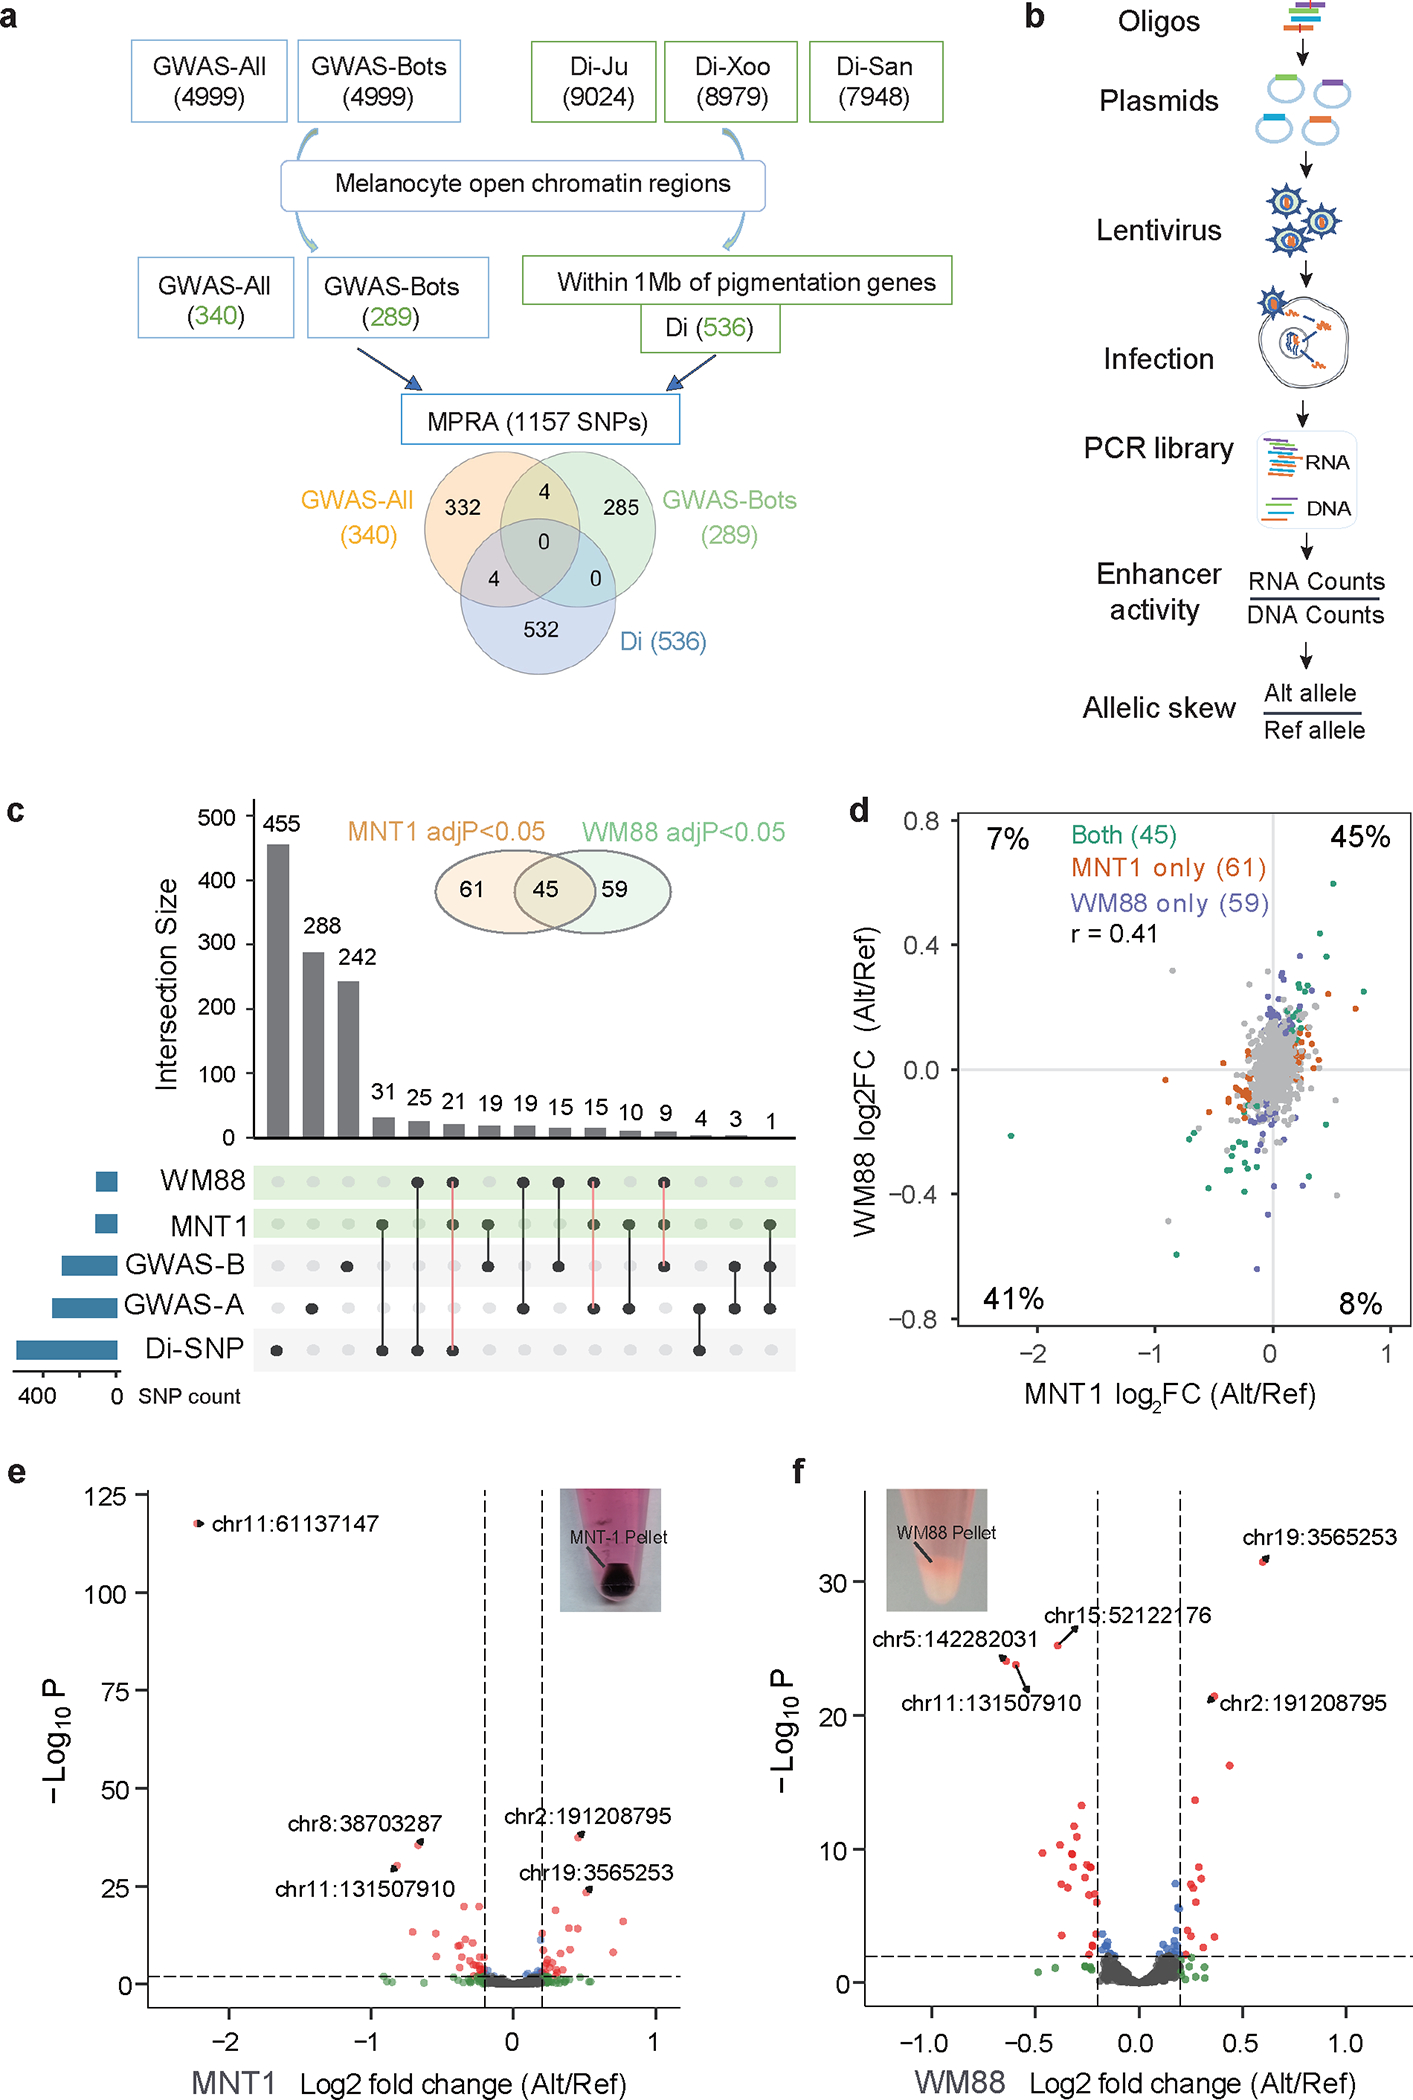
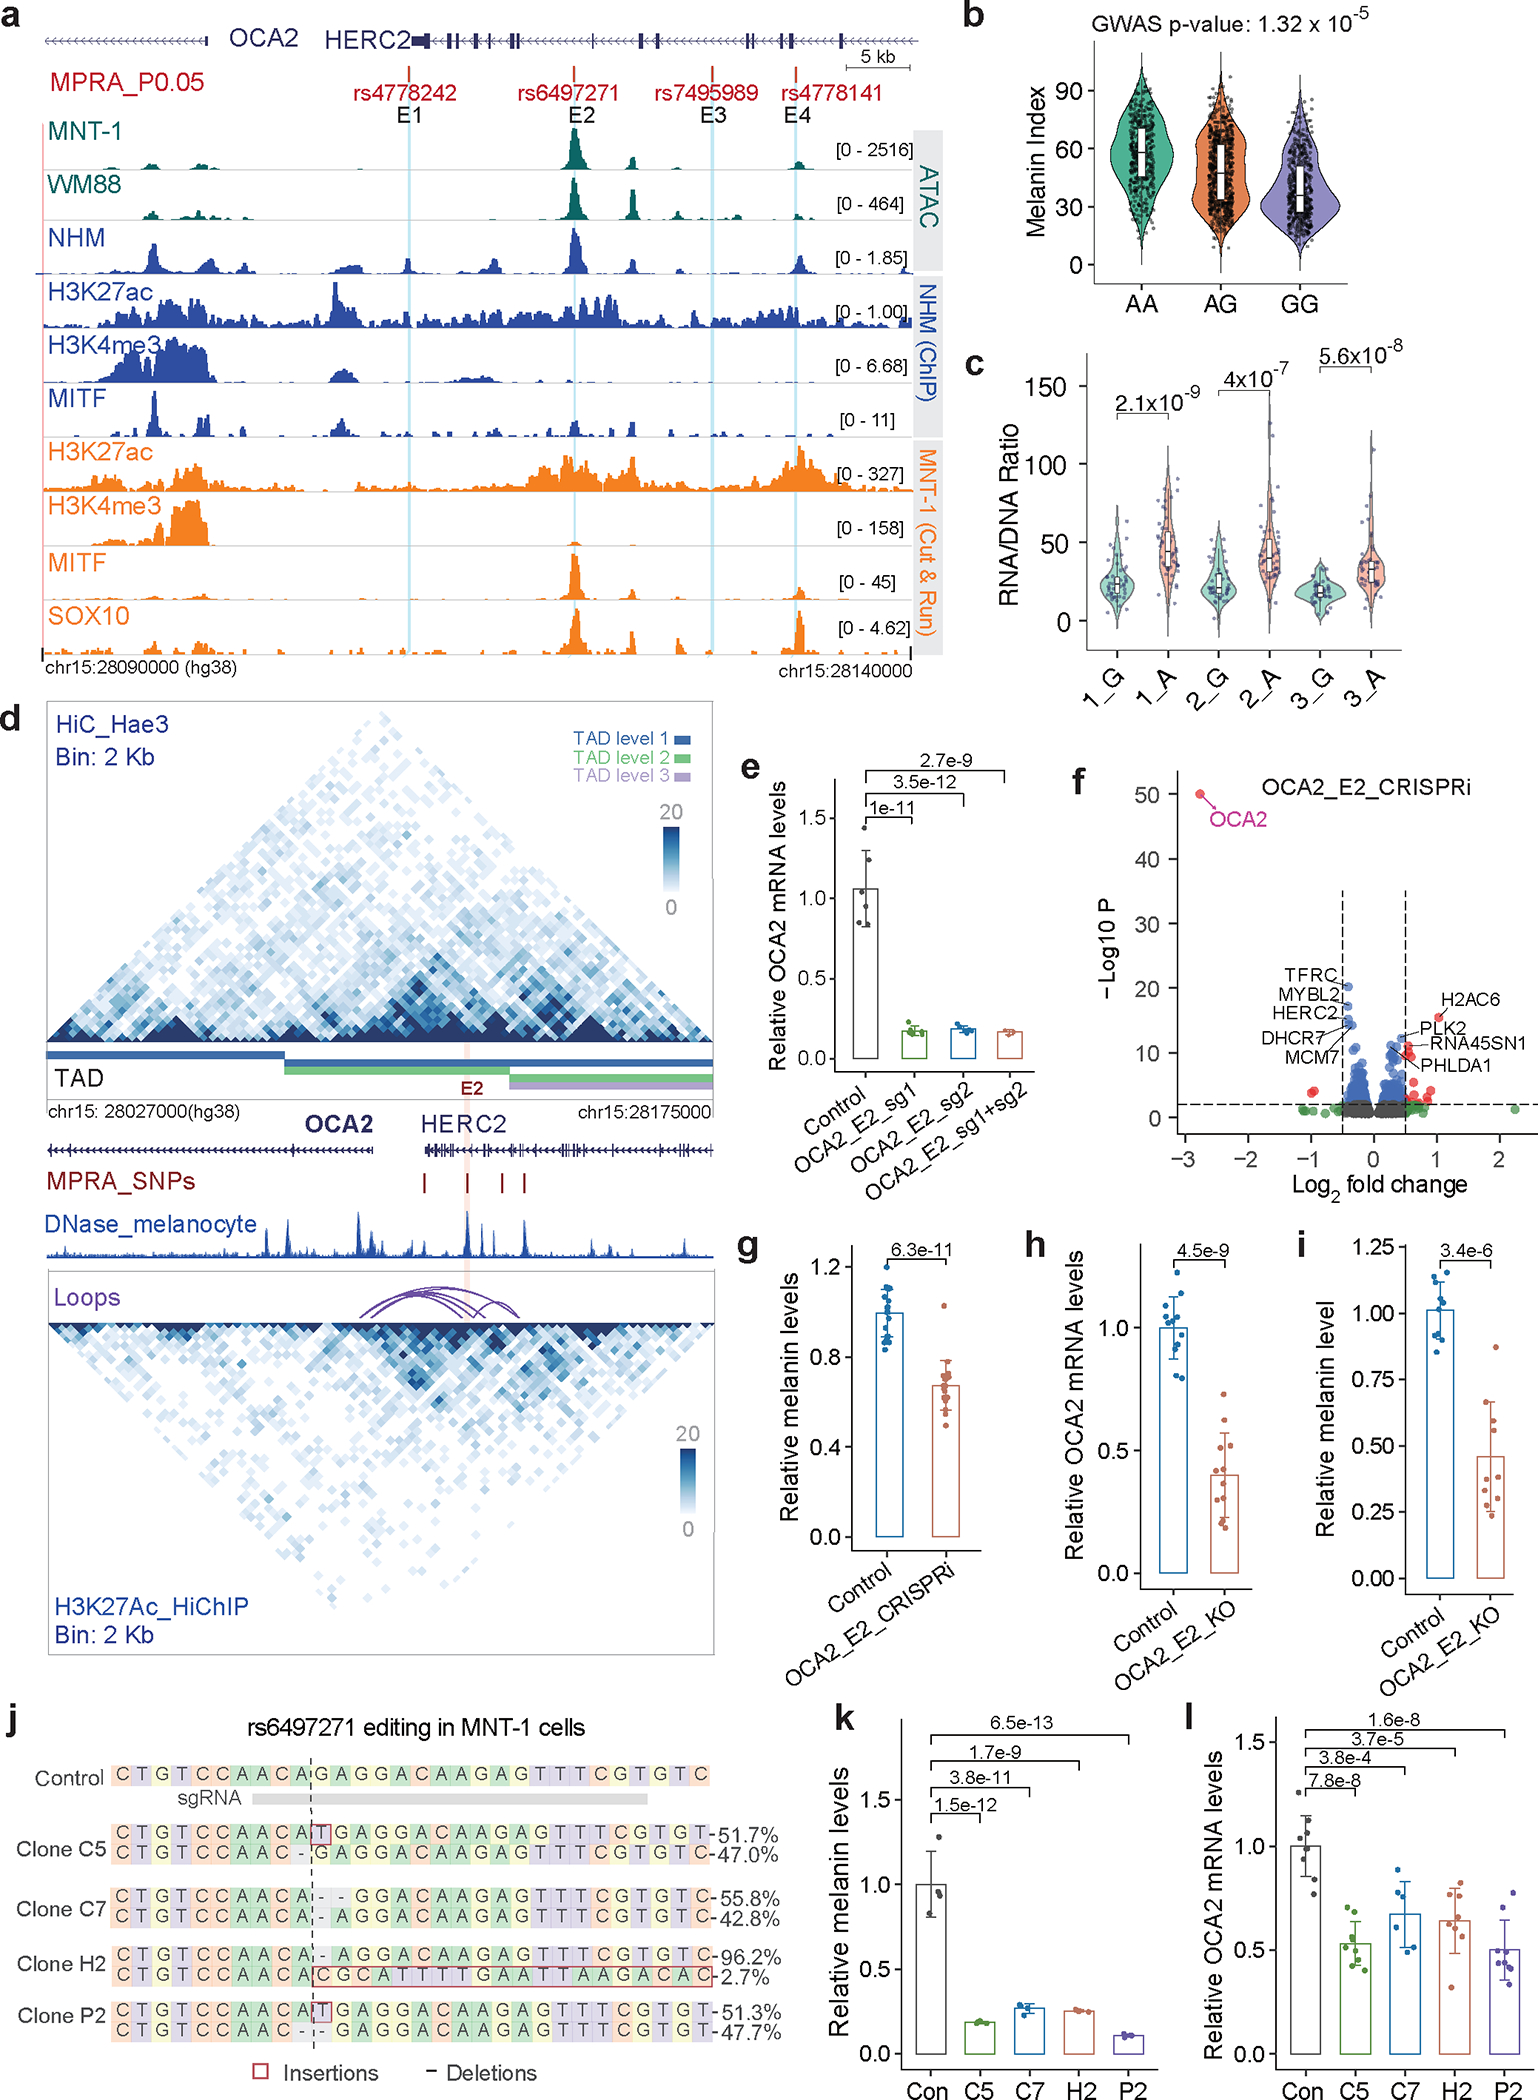
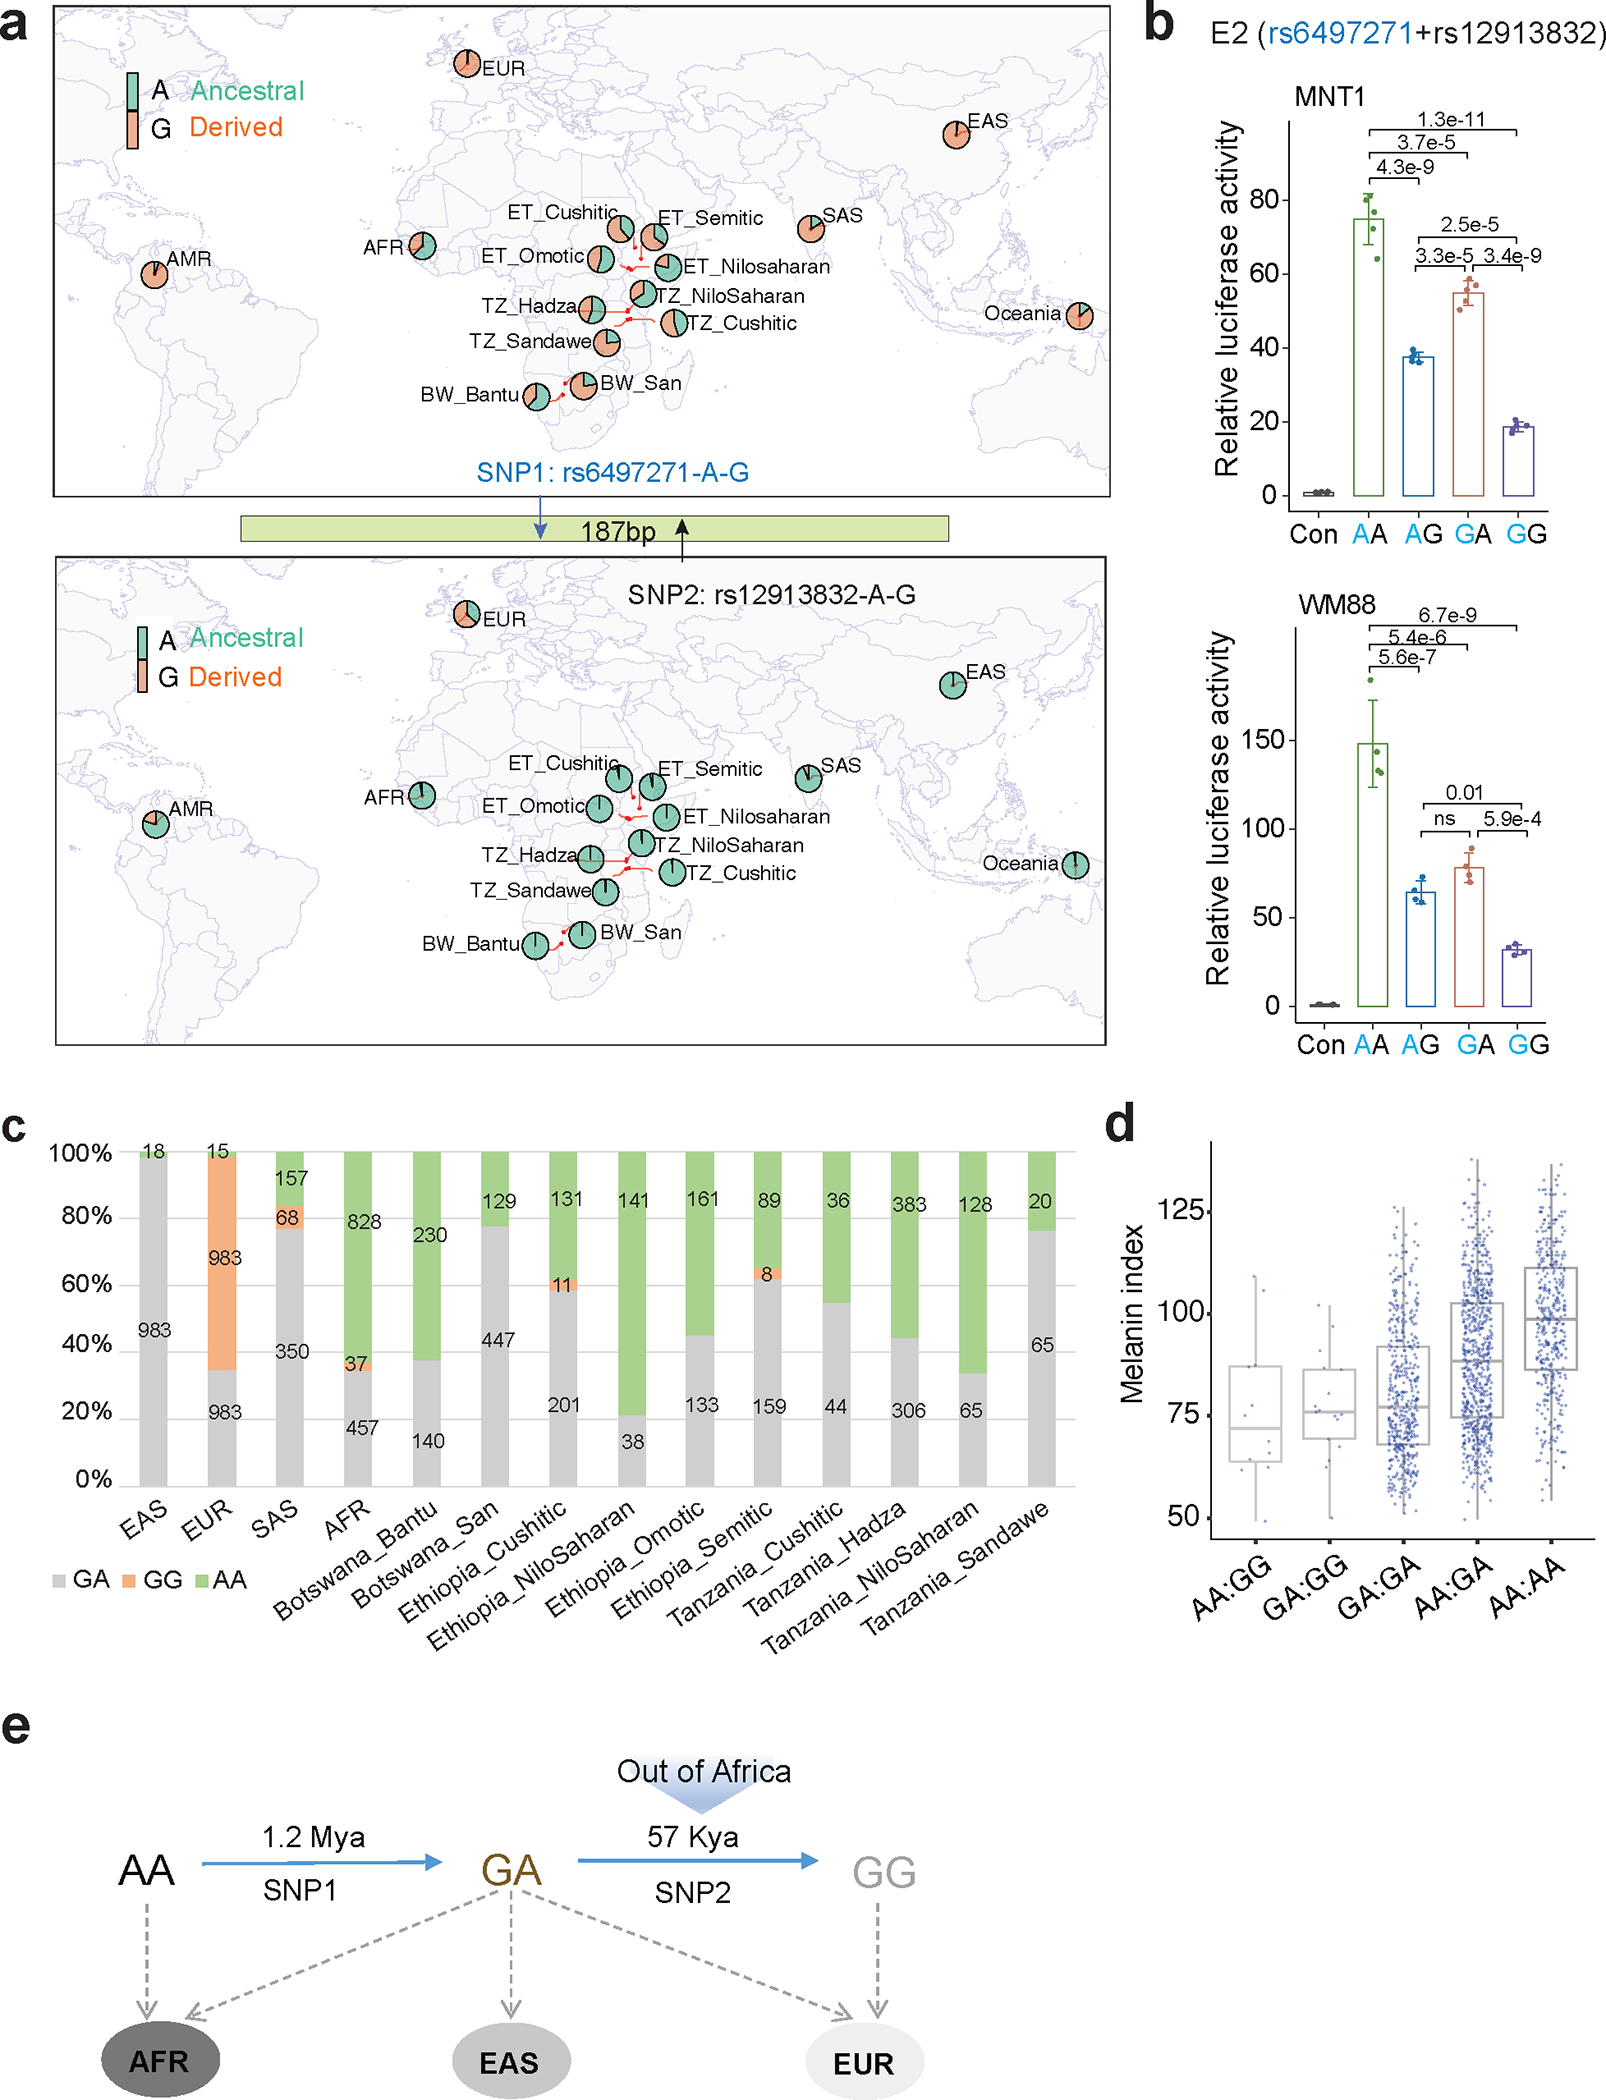
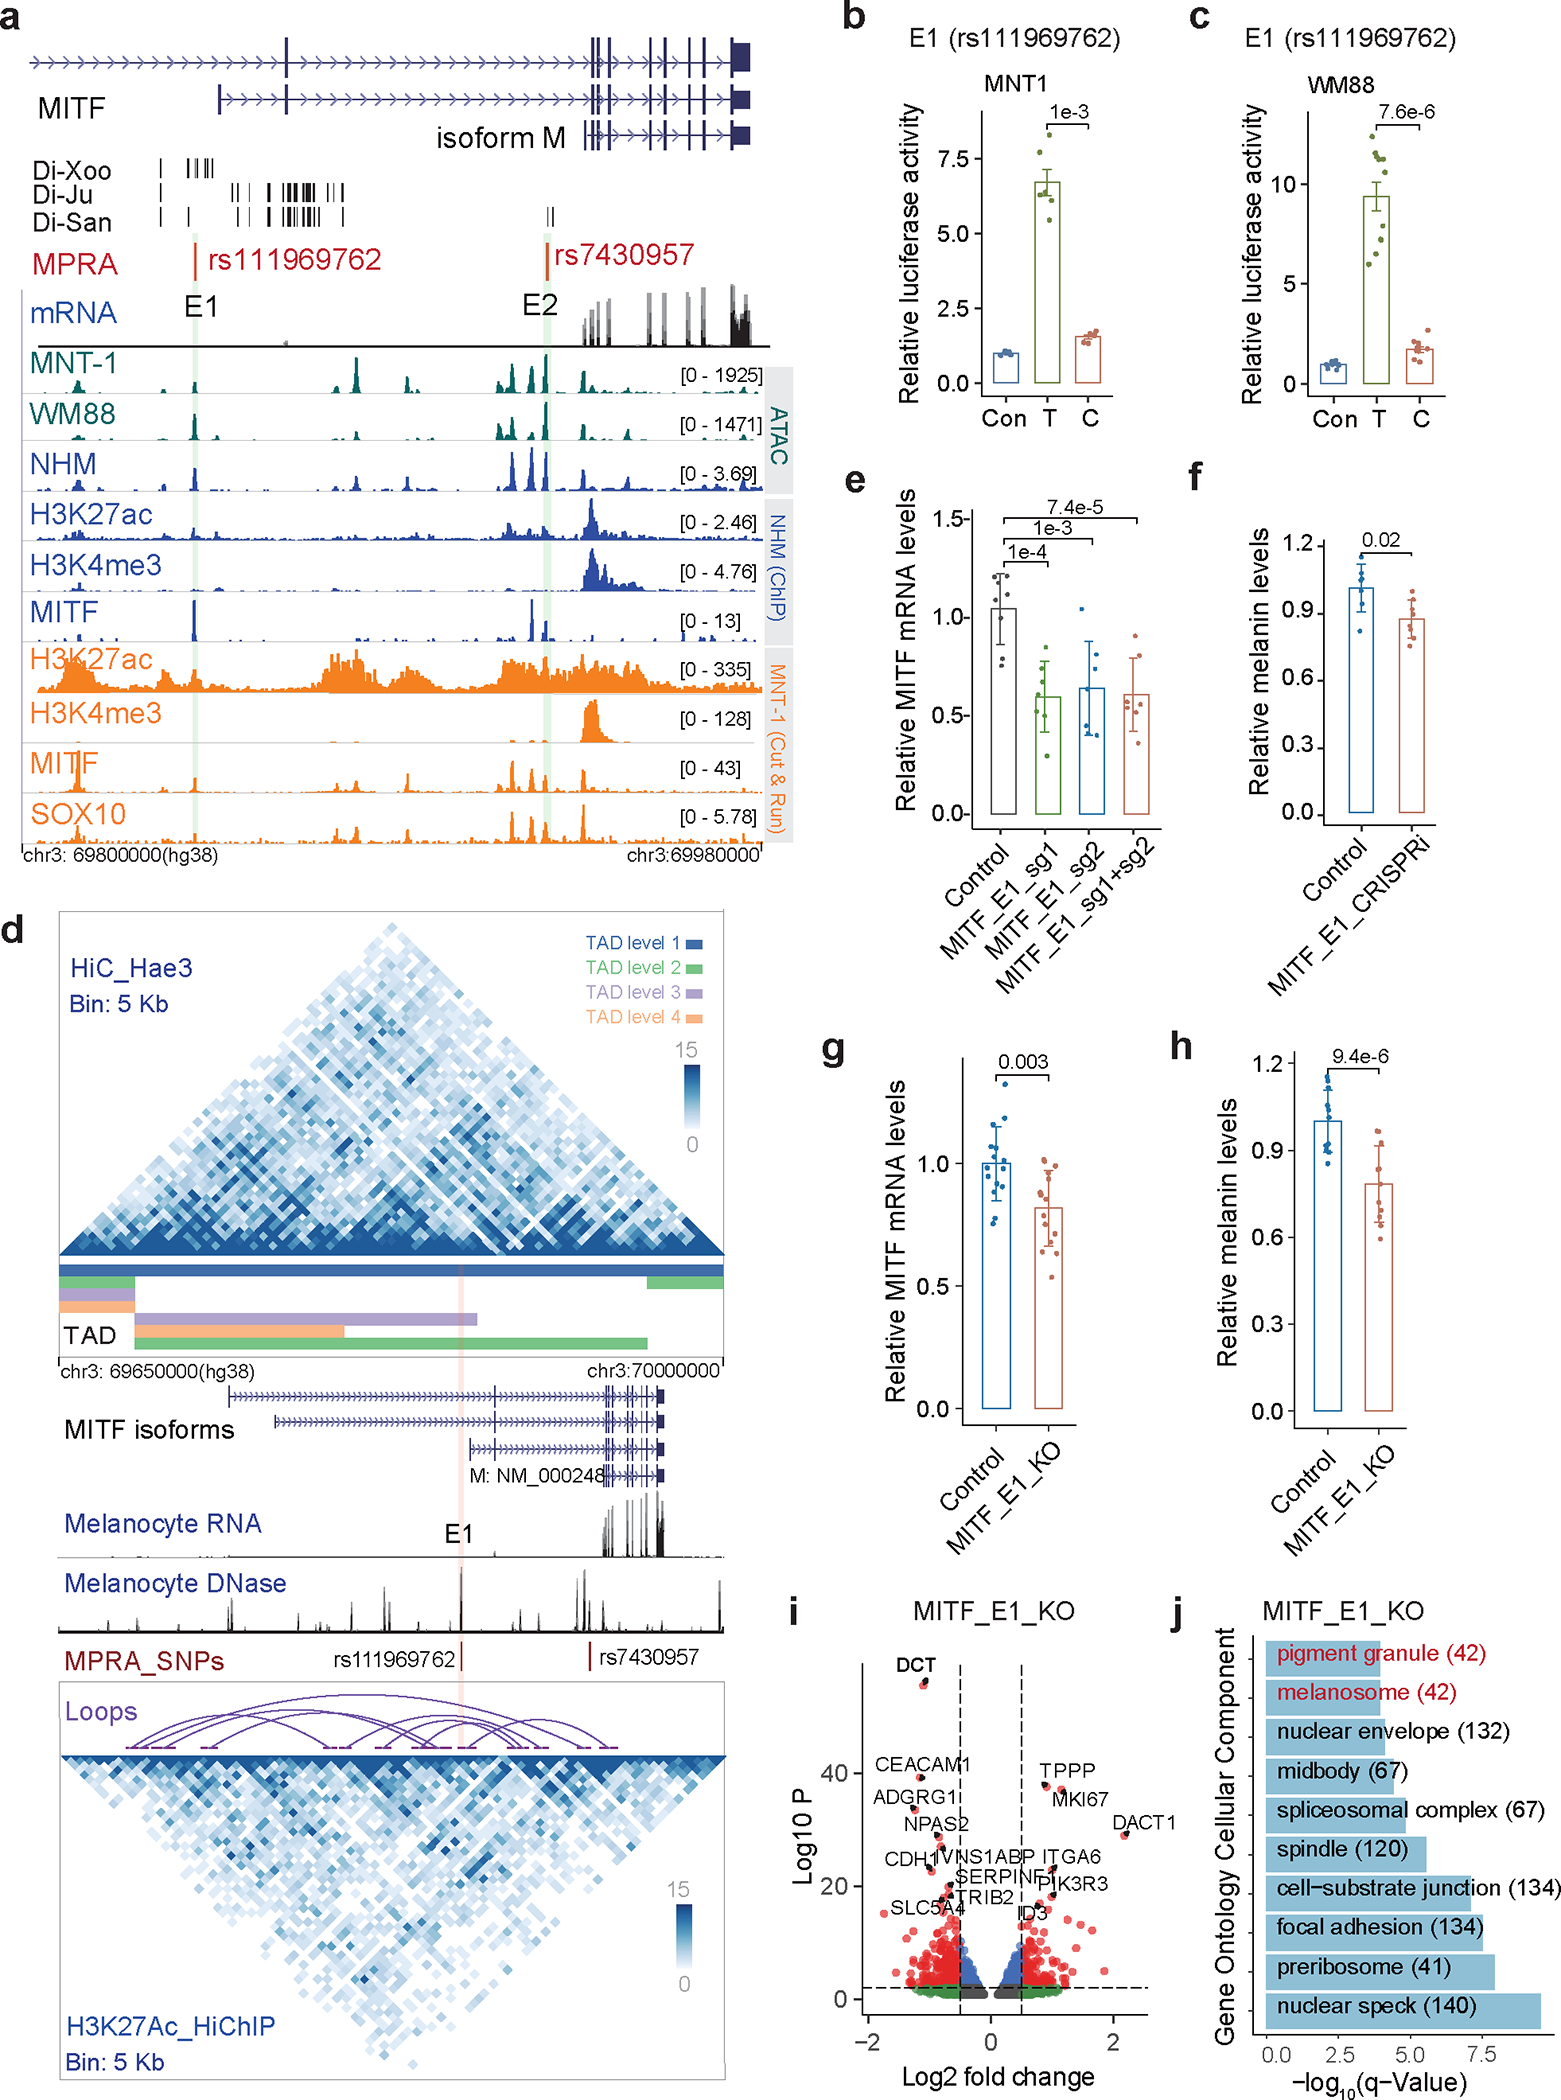
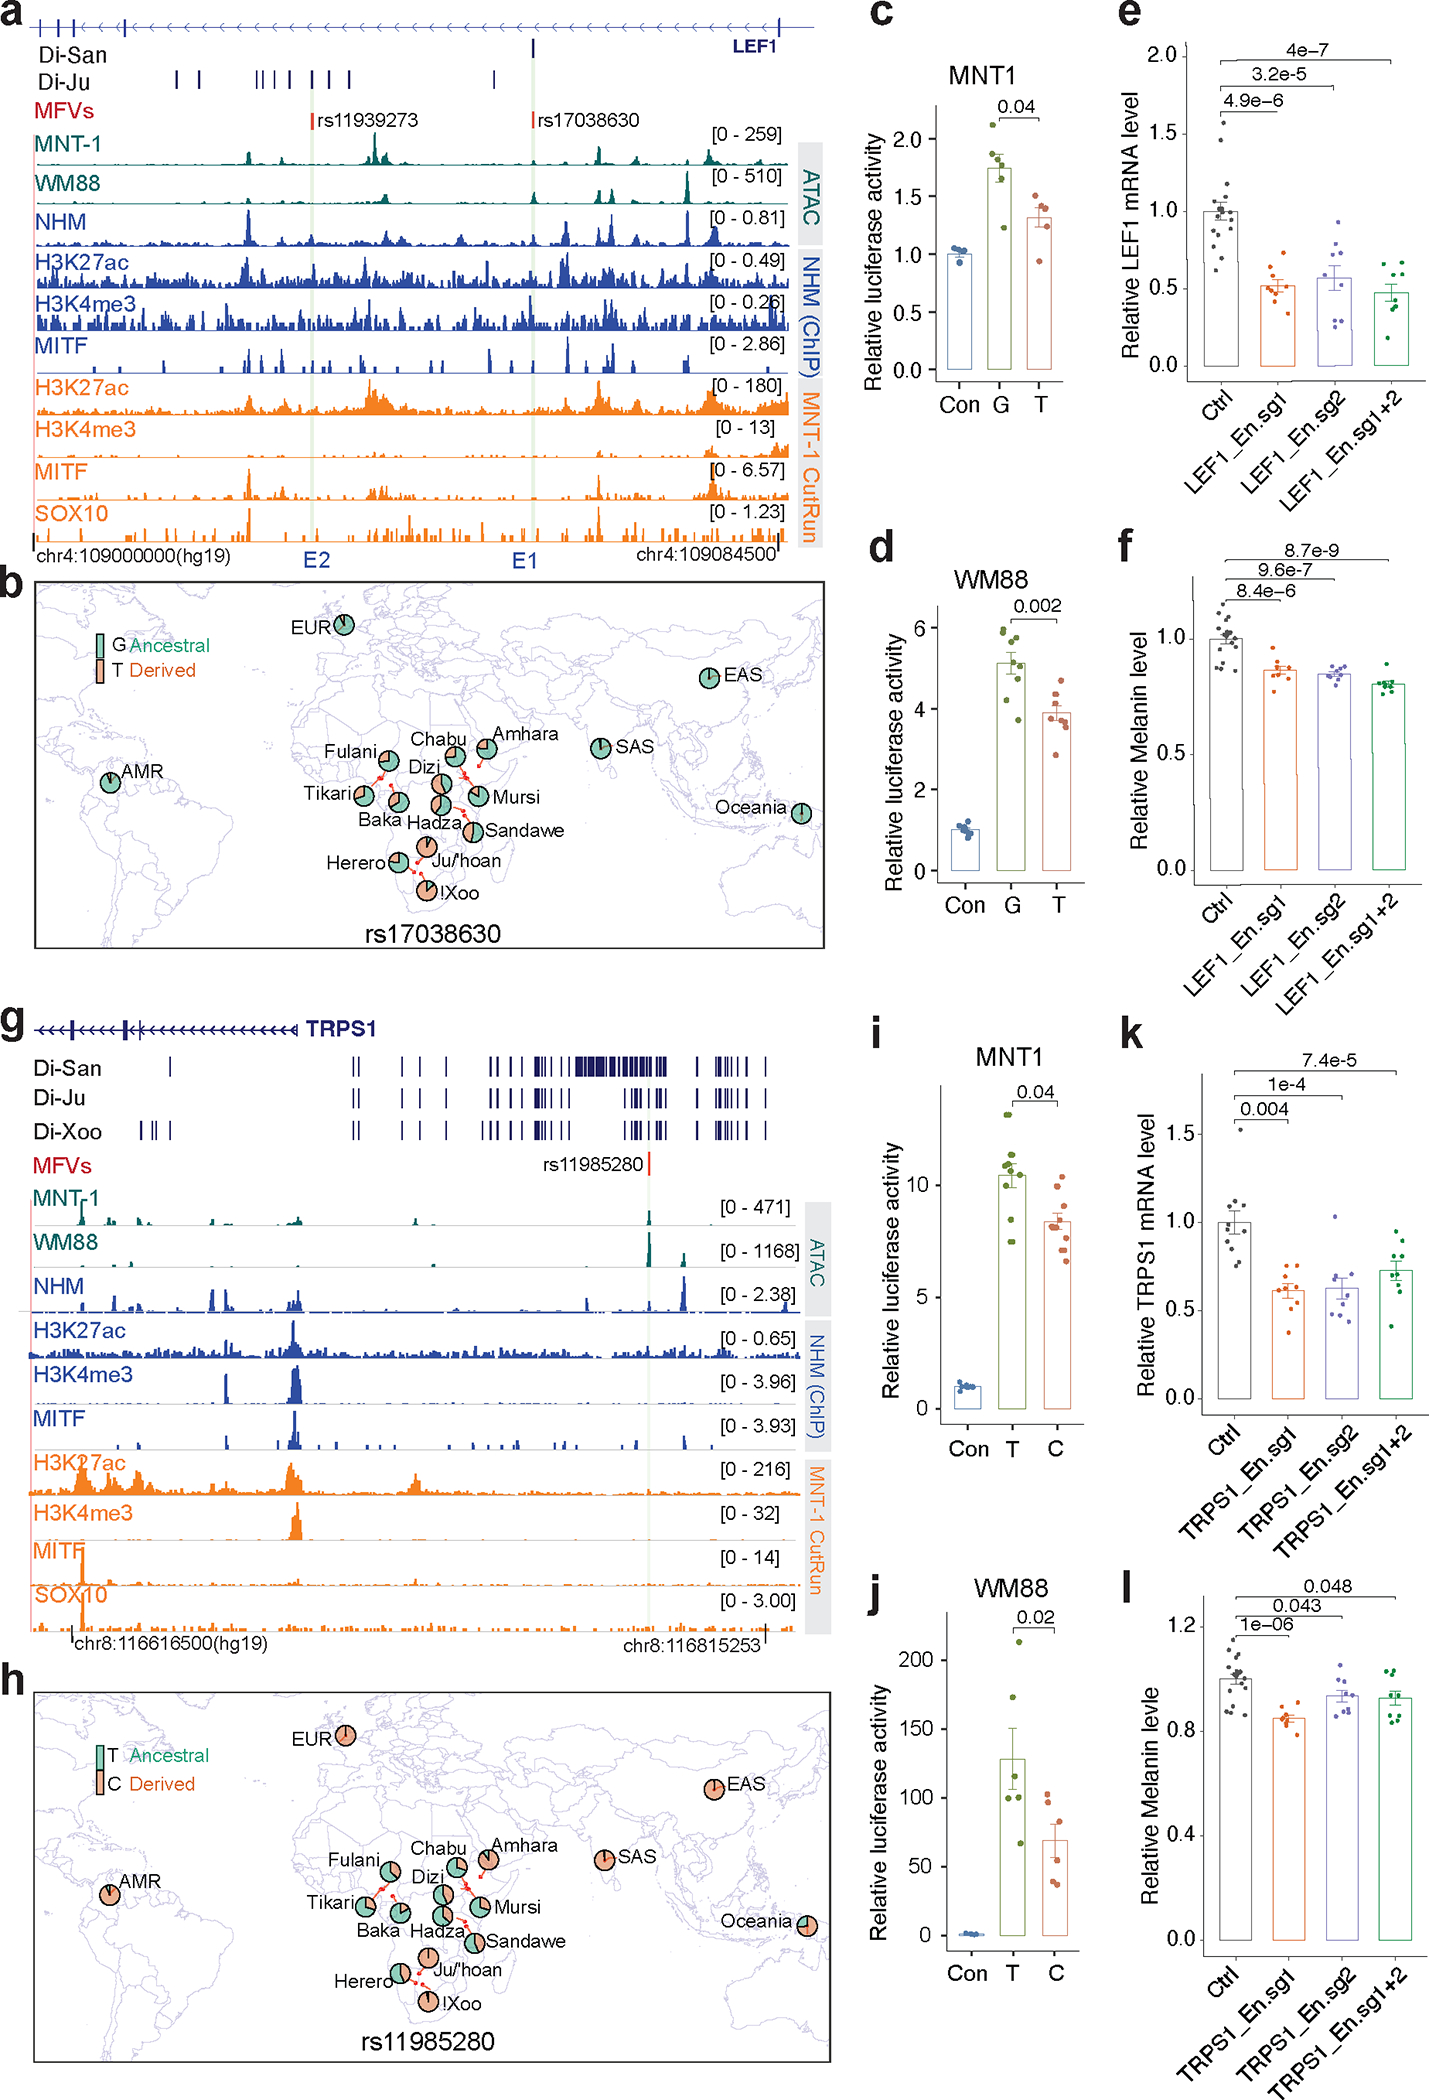
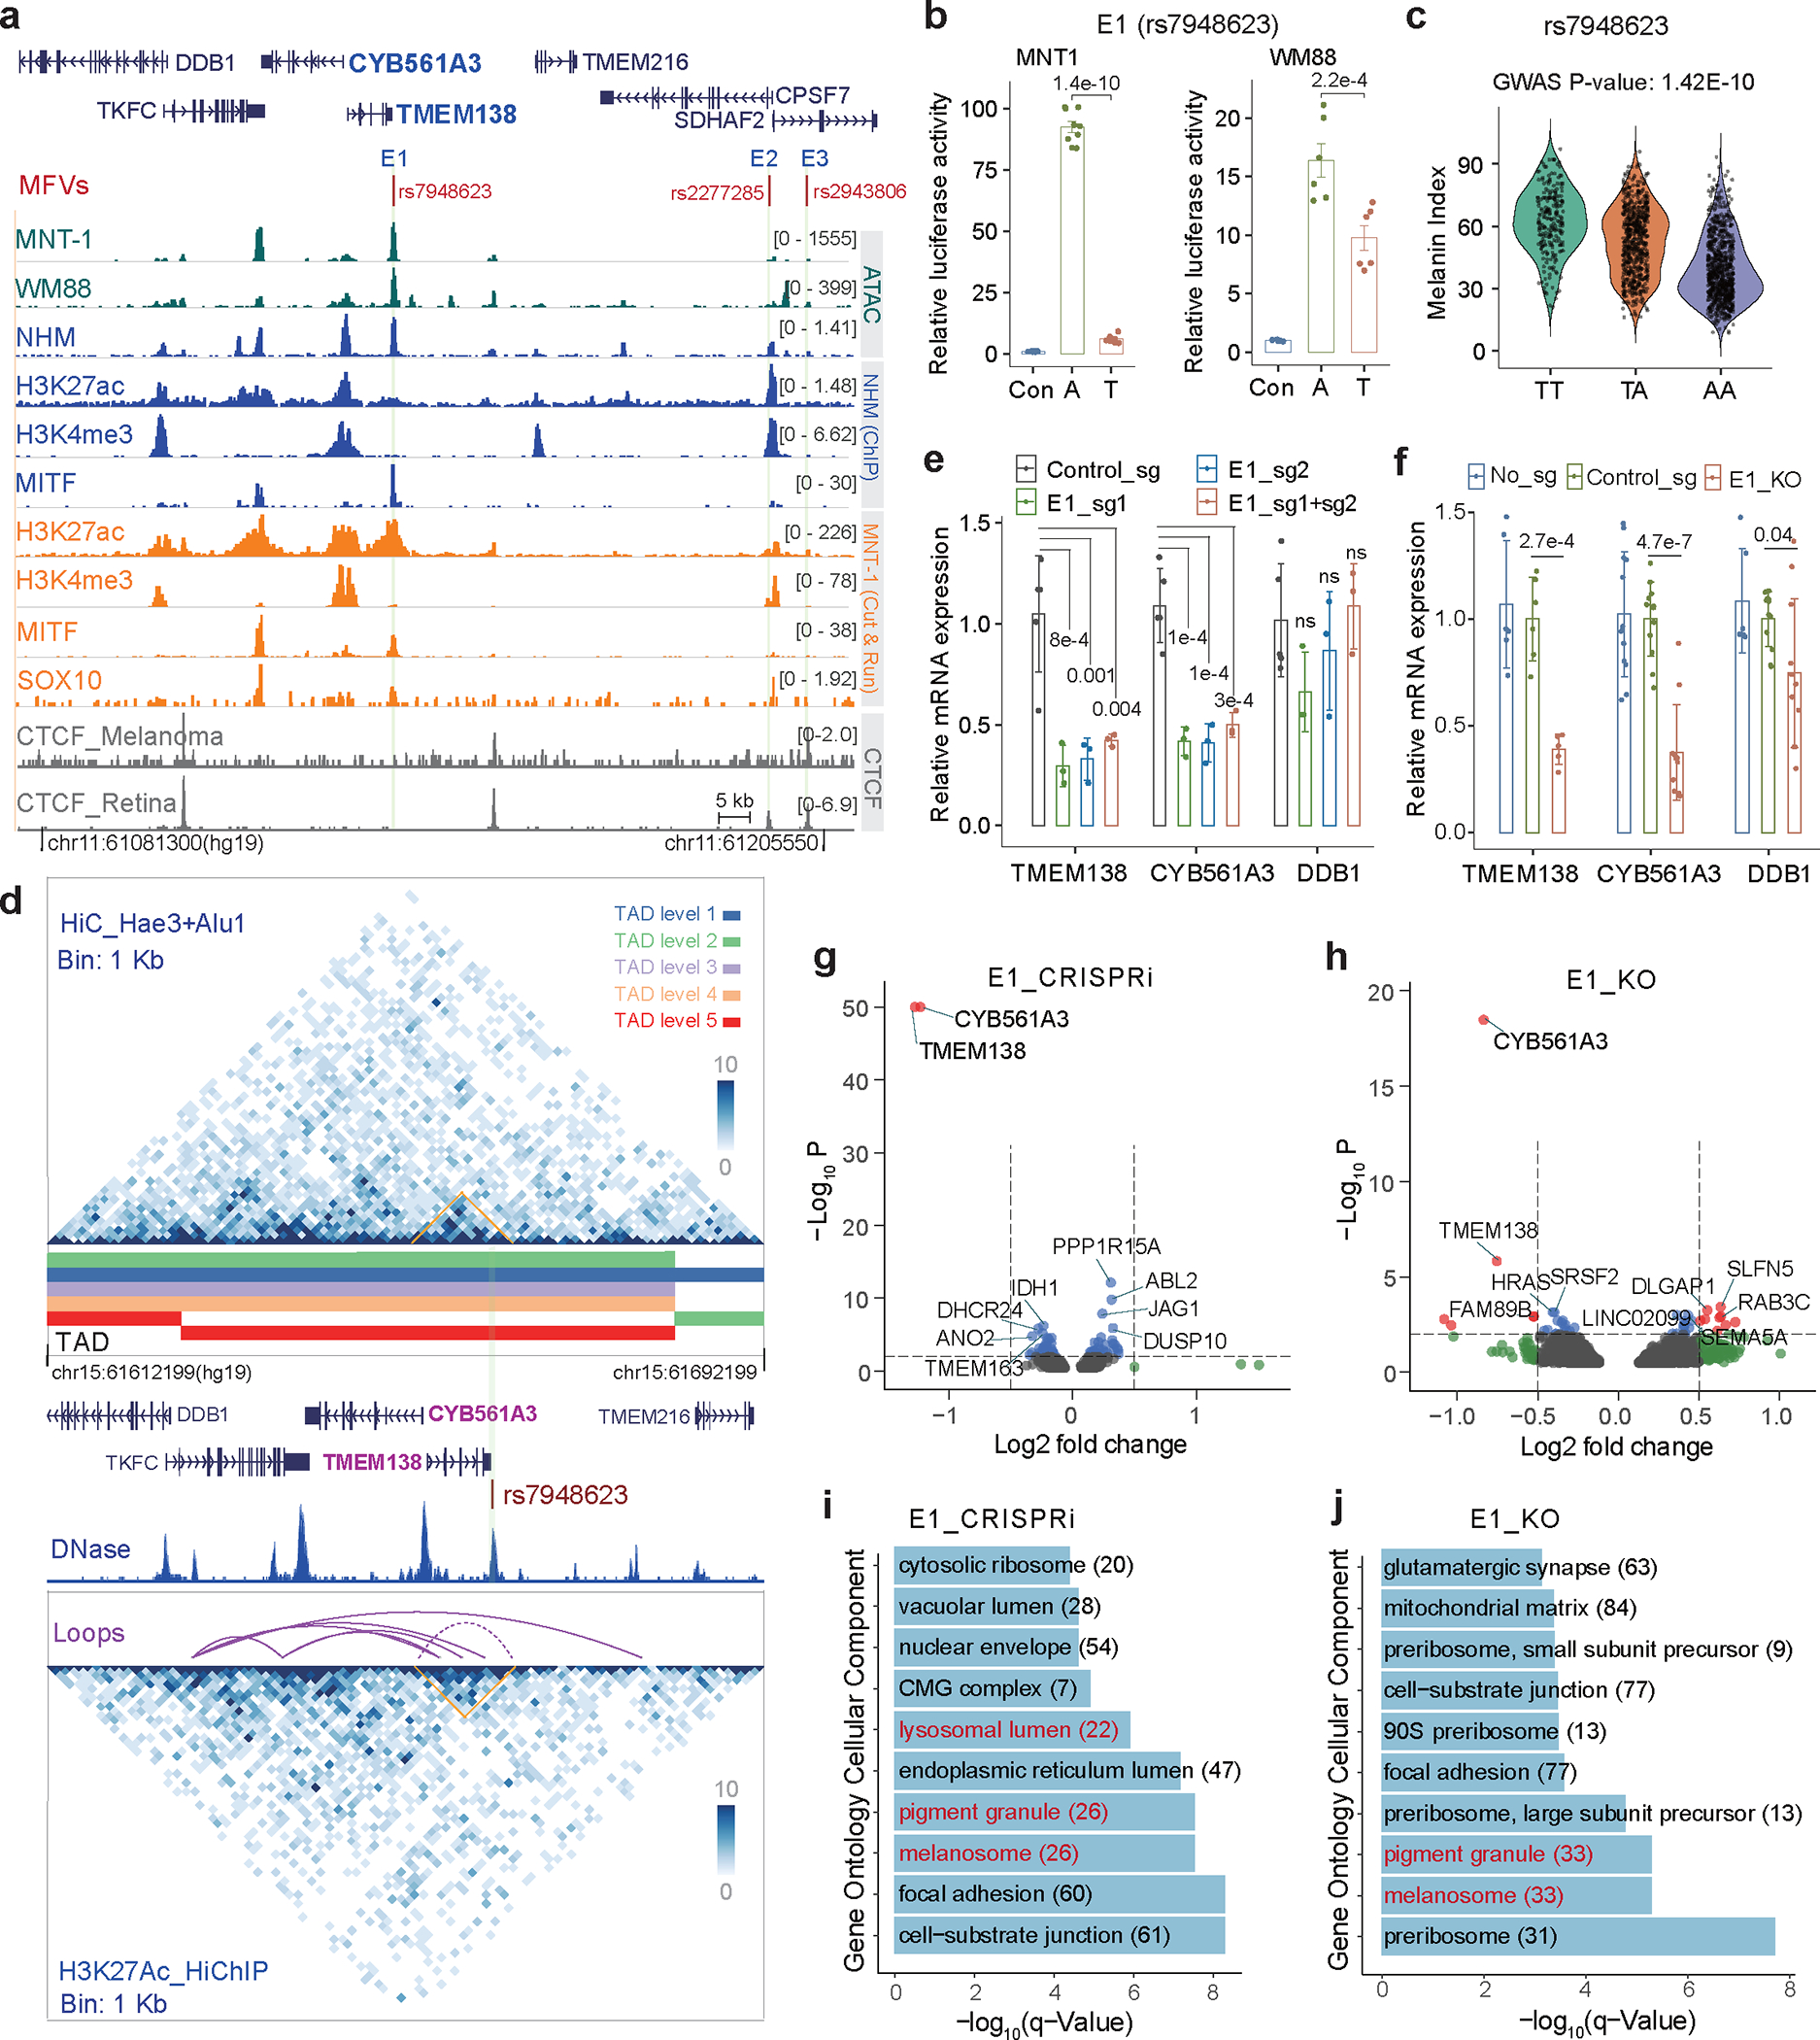
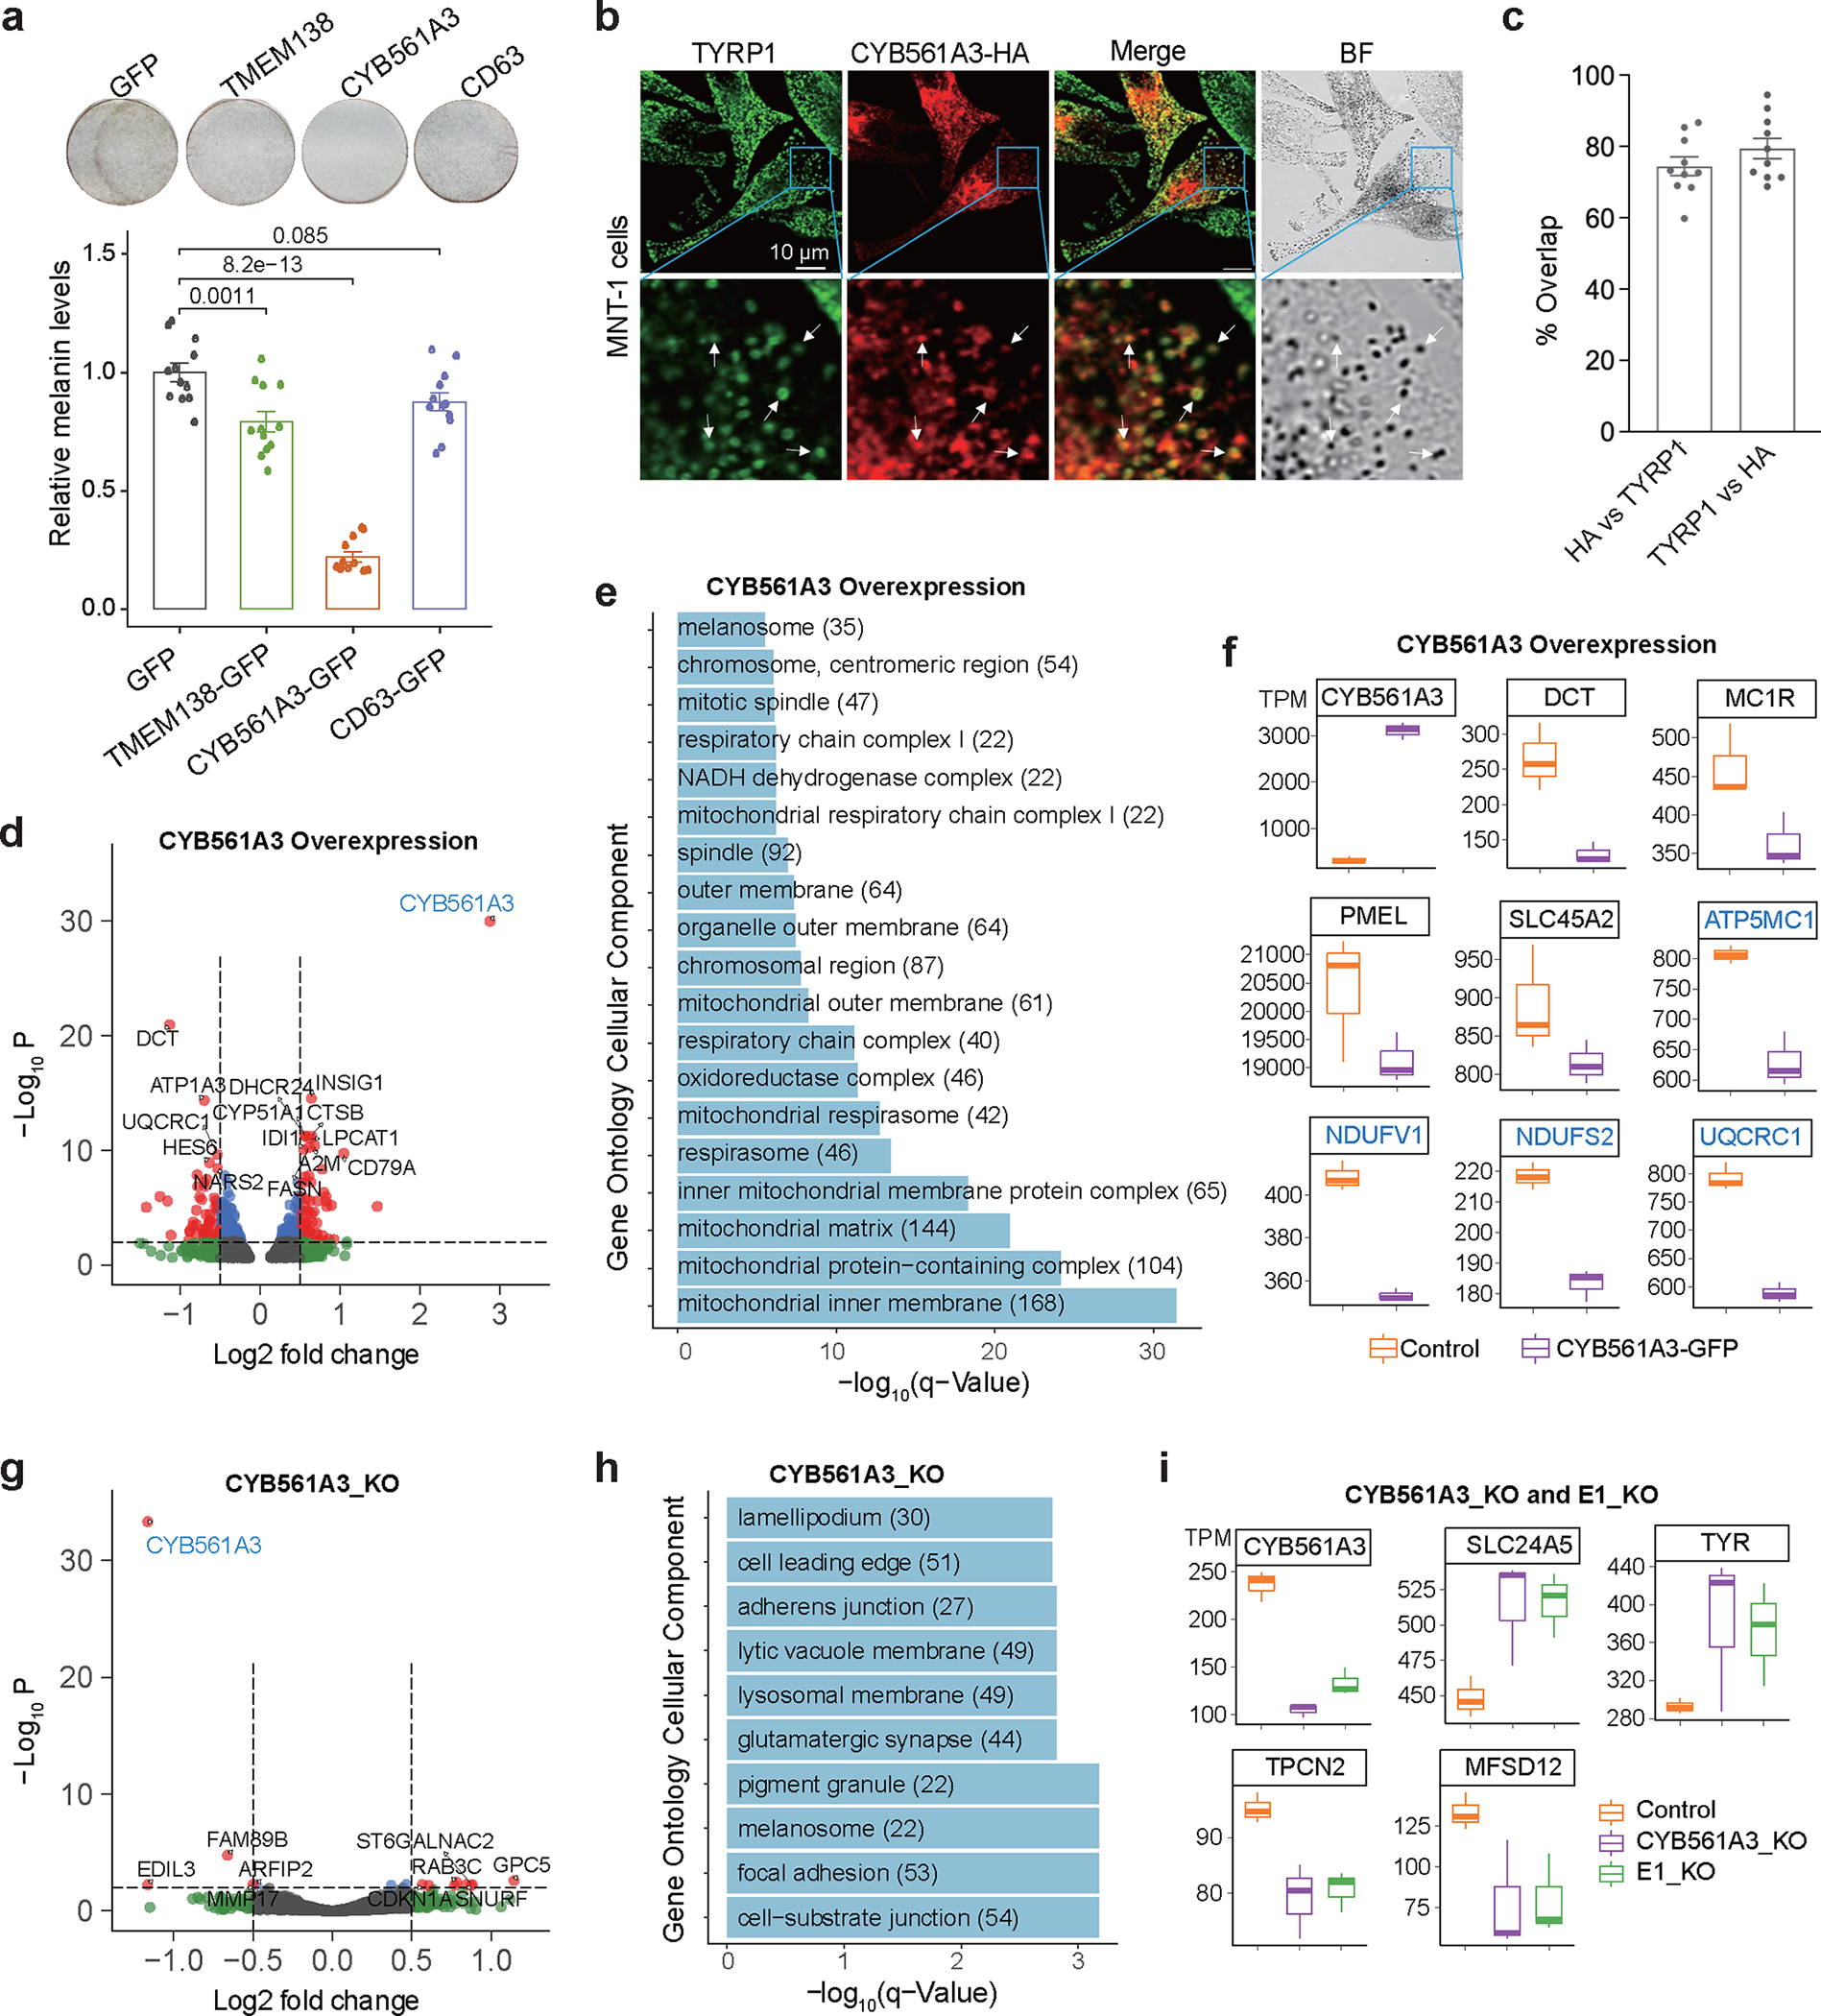
Skin color is highly variable in Africans, yet little is known about the underlying molecular mechanism. Here we applied massively parallel reporter assays to screen 1,157 candidate variants influencing skin pigmentation in Africans and identified 165 single-nucleotide polymorphisms showing differential regulatory activities between alleles. We combine Hi-C, genome editing and melanin assays to identify regulatory elements for MFSD12, HMG20B, OCA2, MITF, LEF1, TRPS1, BLOC1S6 and CYB561A3 that impact melanin levels in vitro and modulate human skin color. We found that independent mutations in an OCA2 enhancer contribute to the evolution of human skin color diversity and detect signals of local adaptation at enhancers of MITF, LEF1 and TRPS1, which may contribute to the light skin color of Khoesan-speaking populations from Southern Africa. Additionally, we identified CYB561A3 as a novel pigmentation regulator that impacts genes involved in oxidative phosphorylation and melanogenesis. These results provide insights into the mechanisms underlying human skin color diversity and adaptive evolution.


Conflict of interest statement

Declaration of interests

N.A. is an equity holder of Encoded Therapeutics, a gene regulation therapeutics company and is a co-founder and scientific advisor of Regel Therapeutics and Neomer Diagnostics. The remaining authors declare no competing financial interests.

Figures

Extended Data Fig. 1.
Extended Data Fig. 1.. Quality statistics of the MPRA experiments.
(a) Statistics for FLASH-merged reads in the association library. The plot showed that 46.1% are 200bp fragments as designed. (b) Statistics of BWA-mapped reads in the association library. The plot showed that 44.1% are 200bp fragments as designed. (c) Statistics of barcode types per oligo in the association library. On average, each oligo is linked with 126 different barcodes. (d) Statistics of barcode types per oligo in reference (n = 1102), alternative (n = 1103), negative control (n = 153), and positive control (n = 30) oligos. Data is from the association library. (e) Statistics of barcode counts per oligo in reference (n = 1102), alternative (n = 1103), negative control (n = 153), and positive control (n = 30) oligos. Data is from the association library. (f) Barcode types for reference and alternative alleles are comparable. Pearson’s r = 0.91, p < 2×10⁻¹⁶. (g) Principal component analysis of DNA and RNA libraries from MNT-1 and WM88 cells. Three replicates. (h) Summary of enhancer activities estimated by MPRA. Enhancer activities were defined as the barcode counts per million in the RNA library divided by the barcode counts per million in the DNA library. Alt: oligos containing alternative alleles (n = 1103). Ref: oligos containing reference alleles (n = 1102). Negative, negative control oligos (n = 148). Positive, positive control oligos (n = 30). For boxplots, central lines are median, with boxes extending from the 25th to the 75th percentiles. Whiskers further extend by ±1.5 times the interquartile range from the limits of each box.
Extended Data Fig. 2.
Extended Data Fig. 2.. MPRA identifies six allelic skewed variants near MFSD12.
(a) Plot showing allelic skewed variants in regulatory regions near MFSD12. Blue tracks show DNase-Seq, ATAC-Seq, and ChIP-Seq data from melanocytes; orange tracks indicate ChIP-Seq data from melanoma (501-mel) cells, green tracks indicate DNase-Seq data from ENCODE cell lines. E1-E4, enhancers. P, promoter. (b-g) Relative enhancer activities of the two alleles at rs142317543, rs6510759, rs734454, rs10416746, rs6510760, rs7246261 estimated by MPRA (n = 3). For b, c, d, f, g, p-values were estimated with a random effects model for mpralm and paired t-tests with multiple testing adjustments; e was without multiple testing adjustments. (h-k) Relative enhancer activities estimated by LRA. Two-tailed paired t-tests (For LRA in MNT1, n=6. For LRA in WM88, 2h n=8; others n=9). Data were presented as mean ± SEM. ns p > 0.05. (l) rs6510760 and rs7246261 disrupt the binding motifs of AHR and TFAP2, respectively. Predicted by “MotifBreakR” . (m) The LD pattern of candidate functional variants near MFSD12. LD was calculated using the 180G data by the LDheatmap package. For boxplots, central lines are median, with boxes extending from the 25th to the 75th percentiles. Whiskers further extend by ±1.5 times the interquartile range from the limits of each box.
Extended Data Fig. 3.
Extended Data Fig. 3.. The enhancer E4 interacts with the promoter of MFSD12 and affects the expression of MFSD12.
(a-b) Chromatin interactions near MFSD12 identified by Hi-C and H3K27ac HiChIP with Hae3 digestion. The upper matrix is from MNT-1 Hi-C data, and the lower matrix is from MNT-1 H3K27ac HiChIP data. TADs were called by onTAD 71and colored by nested TAD levels. The solid arch was a loop defined using FitHiChIP software, the dashed arch was a potential loop based on the observed interaction matrix. The interaction matrix between MFSD12 and HMG20B were highlighted with orange angles. The DNase track of melanocytes was downloaded from ENCODE. rs6510760 and rs657246261 in E4 are colored in red. The plotted region is chr19:3519998–3589998 (hg19). (c) Schematic showing the location of the two sgRNAs targeting the enhancer E4 of MFSD12. (d) PCR results showing efficient knockout of the enhancer by the two sgRNAs. Three independent experiments. (e) qPCR showed that CRISPRi of E4 significantly decreases the gene expression of MFSD12 and HMG20B in MNT-1 cells. Two-sided Dunnett’s test with adjustments for multiple comparisons (n = 3). (f) CRISPRi of E4 significantly increases melanin levels in MNT-1 cells. Two-tailed unpaired t-tests (n = 19). (g) qPCR showed that CRISPR knockout of E4 significantly decreases the gene expression of MFSD12 and HMG20B in MNT-1 cells. Two-tailed unpaired t-tests without multiple testing adjustments (n = 6). Data are presented as mean ± SEM.
Extended Data Fig. 4.
Extended Data Fig. 4.. Identification of functional variants associated with skin pigmentation near OCA2.
(a) SNP rs6497271 is in a melanocyte-specific enhancer. Blue tracks indicate DNase-Seq, ATAC-Seq, and ChIP-Seq data from melanocytes; orange tracks indicate ChIP-Seq data from melanoma (501-mel) cells; green tracks indicate DNase-Seq data from ENCODE cell lines. E1-E4, enhancers. The plotted region is chr15: 28,335,146–28,385,146 (hg19). (b) MPRA and LRA revealed that rs4778242 significantly affects the enhancer activity of E1 in MNT-1 and WM88. MPRA (n = 3), LRA (n =9). (c) MPRA showed that rs6497271 significantly affects the enhancer activity of E2 in MNT-1 and WM88 cells (n =3). (d) MPRA showed that rs7495989 affects the enhancer activity of E3 in MNT-1 and WM88 cells (n =3). (e) MPRA and LRA revealed that rs4778141 affects the enhancer activity of E4 in MNT-1 and WM88 cells. MPRA (n = 3), LRA (MNT-1, n = 9; WM88, n = 6). (f) rs6497271 overlaps transcription factor binding sites. Left panel showed rs6497271 disrupts the binding motif of LEF1 and SOX10. Right panel showed the rs6497271 overlaps ChIP-seq peaks from Cistrome database. LRA data are presented as mean ± SEM, tested with two-tailed paired t-tests. MPRA p-values were estimated with a random effects model for mpralm and paired t-tests with multiple testing adjustments. For MPRA boxplots, central lines are median, with boxes extending from the 25th to the 75th percentiles. Whiskers further extend by ±1.5 times the interquartile range from the limits of each box.
Extended Data Fig. 5.
Extended Data Fig. 5.. Identification of functional variants near MITF related to skin pigmentation in the San.
(a) A plot showing that functional Di-SNP rs111969762 is in a melanocyte-specific regulatory region. Blue tracks show DNase-Seq, ATAC-Seq, and ChIP-Seq data from melanocytes; orange tracks indicate ChIP-Seq data from melanoma (501-mel) cells, green tracks indicate DNase-Seq data from ENCODE . E1-E2, enhancers. (b) MPRA showed that rs111969762 affects enhancer activity in WM88 cells (n = 3). (c) MPRA showed that rs7430957 impacts enhancer activity in WM88 cells (n = 3). (d) LRA showed that rs7430957 does not significantly alter the activity of the E2 enhancer near MITF. P values were estimated by two-tailed paired t-tests, MNT-1(n = 6), WM88 (n = 11). Data were presented as mean ± SEM. ns p > 0.05. (e) rs111969762 overlaps transcription factor binding sites. Left panel shows that rs6497271 disrupts the binding motif of FOXP3. Right panel shows that rs111969762 overlaps ChIP-seq peaks from the Cistrome database . MPRA p-values were estimated with a random effects model for mpralm and paired t-tests with multiple testing adjustments. For MPRA boxplots, central lines are median, with boxes extending from the 25th to the 75th percentiles. Whiskers further extend by ±1.5 times the interquartile range from the limits of each box.
Extended Data Fig. 6.
Extended Data Fig. 6.. Functional testing of Di-SNPs near LEF1.
(a) MFVs and regulatory elements near LEF1. rs17038630 and rs11939273 are Di-SNPs from the San population. (b) Plot showing allelic skews at rs17038630 in MNT-1 and WM88 cells estimated by MPRA (n = 3). (c) rs17038630 overlaps SOX10 and LEF1 binding sites. Left panel shows that rs17038630 disrupts the binding motif of SOX10 and LEF1. Right panel shows that rs11939273 overlaps ChIP-seq peaks from the Cistrome database . (d) MPRA and LRA results showing allelic skews at Di-SNP rs11939273 in MNT-1 and WM88 cells, the allele frequency data was from the 180G and 1000G 31datasets. LRA data are presented as mean ± SEM, tested with two-tailed paired t-tests, MPRA (n = 3), LRA (MNT-1, n = 6; WM88, n = 9). (e) CRISPR-KO of the enhancer E1 of LEF1 does not affect LEF1 expression and melanin levels in MNT-1 cells. Left panel shows genotyping results of CRISPR-KO of the enhancer E1 of LEF1, three independent experiments. Middle panel shows the RT-qPCR results of CRISPR-KO of the enhancer E1 of LEF1 (n = 9). Right panel shows the melanin levels of CRISPR-KO of the enhancer E1 of LEF1 (n = 9). Two-tailed unpaired t-tests. For MPRA boxplots in b and d, central lines are median, with boxes extending from the 25th to the 75th percentiles. Whiskers further extend by ±1.5 times the interquartile range from the limits of each box. MPRA p-values were estimated with a random effects model for mpralm and paired t-tests with multiple testing adjustments.
Extended Data Fig. 7.
Extended Data Fig. 7.. MPRA and LRA identified three functional Di-SNPs near NLK.
(a) MFVs and regulatory elements near NLK. rs75827647, rs10468581 and rs113940275 are Di-SNPs from the San population. (b) LRA and MPRA results showing allelic skews at rs75827647 in MNT-1 and WM88 cells. MPRA (n = 3), LRA (MNT-1, n = 6; WM88, n = 9). (c) LRA and MPRA results showing allelic skews at rs10468581 in MNT-1 and WM88 cells. MPRA (n = 3), LRA (MNT-1, n = 6; WM88, n = 9). (d) LRA and MPRA results showing allelic skews at rs113940275 in MNT-1 and WM88 cells. MPRA (n = 3), LRA (MNT-1, n = 6; WM88, n = 11). From b to d, the barplots are results of LRA. Two-tailed paired t-tests without adjustments for multiple comparisons, data were presented as mean ± SEM. ns p > 0.05. The boxplots are results from the MPRA, p-values were estimated with a random effects model for mpralm and paired t-tests with multiple testing adjustments. The right panels are allele frequency maps constructed using the180G and 1000G datasets. For boxplots, central lines are median values, with boxes extending from the 25th to the 75th percentiles. Whiskers further extend by ±1.5 times the interquartile range from the limits of each box.
Extended Data Fig. 8.
Extended Data Fig. 8.. Functional testing of Di-SNPs near TRPS1.
(a) SNP rs11985280 overlaps a regulatory element of TPRS1. Blue tracks show ATAC-Seq, and ChIP-Seq data from melanocytes; orange tracks indicate ChIP-Seq data from melanoma (501-mel) cells, green tracks indicate ATAC-Seq and DNase-Seq data from ENCODE . (b) MPRA results showing allelic skews at rs11985280 in MNT-1 and WM88 cells (n = 3). p-values were estimated with a random effects model for mpralm and paired t-tests with multiple testing adjustments. For boxplots, central lines are median, with boxes extending from the 25th to the 75th percentiles. Whiskers further extend by ±1.5 times the interquartile range from the limits of each box. (c) rs11985280 disrupts the binding motif of CEBPA and CEBPB. Right panel shows that rs11985280 overlaps ChIP-seq peaks from the Cistrome database . (d) CRISPR-KO of the enhancer E1 of TRPS1 affects TRPS1 expression but not melanin levels in MNT-1 cells. Left panel shows genotyping results of CRISPR-KO of the enhancer E1 of TRPS1, three independent experiments. Middle panel shows the RT-qPCR results of CRISPR-KO of the enhancer E1 of TRPS1 (n = 9). Right panel shows the melanin levels of CRISPR-KO of the enhancer E1 of TRPS1 in MNT-1 cells (n = 9). Two-tailed unpaired t-tests. Data were presented as mean ± SEM and p values were listed above the bars.
Extended Data Fig. 9.
Extended Data Fig. 9.. Identification of functional regulatory variants near the BLOC1S6 locus.
(a). rs72713175 overlaps a regulatory region in melanocytes. Green tracks represent ATAC-seq for MNT-1 and WM88 cells; blue tracks show ATAC-Seq and ChIP-Seq data from normal human melanocytes (NHM); orange tracks indicate CUT&RUN data from MNT-1 cells. (b) MPRA results showing allelic skews at rs11985280 in WM88 cells but not in MNT-1 cells (n = 3). P values were estimated with a random effects model for mpralm and paired t-tests without multiple testing adjustments. For boxplots, central lines are median, with boxes extending from the 25th to the 75th percentiles. Whiskers further extend by ±1.5 times the interquartile range from the limits of each box. (c) Allele frequencies at rs72713175 in global populations, data were from the 180G and 1000G 31datasets. (d) LRA results showing that rs72713175 did not affect enhancer activity in WM88 and MNT-1 cells. Two-tailed paired t-tests (n = 6). (e) CRISPRi of the enhancer containing rs72713175 significantly reduced the expression of BLOC1S6 (control, n = 8; others, n = 6; Two-sided Dunnett’s test with adjustments for multiple comparisons). (f) CRISPRi of the enhancer containing rs72713175 significantly reduced melanin levels in MNT-1 cells (control, n = 18; others, n = 9, Two-sided Dunnett’s test with adjustments for multiple comparisons). Data are presented as mean ± SEM and p values were listed above the bars.
Extended Data Fig. 10.
Extended Data Fig. 10.. Identification of functional regulatory variants near the DDB1 locus.
(a) Plots showing allelic skewed variants in regulatory elements near the DDB1 locus. rs7948623 overlaps an open chromatin region in melanocytes and many other cell types. rs2277285 and rs2943806 are located within CTCF binding sites and TAD boundaries. Blue tracks are DNase-Seq, ATAC-Seq, and ChIP-Seq data from melanocytes; orange tracks indicate ChIP-Seq data from melanoma (501-mel) cells; gray tracks indicate CTCF ChIP-Seq data from three cell lines; and green tracks indicate DNase-Seq data from ENCODE. (b-d) Allelic skews at rs7948623, rs2277285 and rs2943806 as estimated by MPRA (n = 3). P values were estimated with a random effects model for mpralm and paired t-tests without multiple testing adjustments. For boxplots, central lines are median, with boxes extending from the 25th to the 75th percentiles. Whiskers further extend by ±1.5 times the interquartile range from the limits of each box. (e) rs7948623 disrupts a MITF binding motif and overlaps ChIP-seq peaks from Cistrome database . (f-g) LD pattern between the MFVs near the DDB1 locus. LD was calculated using the 180G dataset.
Fig. 1:
Fig. 1:. Massively parallel screening of genetic variants associated with African skin pigmentation.
(a) Selection of candidate regulatory variants. GWAS-All, top 4999 SNPs from GWAS of skin pigmentation in Africans (p < 2.3×10⁻⁴); GWAS-Bots, top 4999 SNPs from GWAS of skin pigmentation in Botswana (p < 1.7×10⁻⁴); Di-Ju are top 0.1% Di-SNPs from the Ju|hoansi versus other populations without inclusion of the !Xoo; Di-Xoo are top 0.1% Di-SNPs from the !Xoo versus other populations without inclusion of the Ju|hoansi; Di-San are top 0.1% Di-SNPs from the Ju|hoansi and the !Xoo versus other populations. (b) Schematic of lentiMPRA workflow. (c) Upset plot showing the intersections of significant allelic skewed variants from GWAS and Di analysis in MNT-1 and WM88. Alleles with significant differential regulatory activities (adjusted p-value < 0.05) in both MNT-1 and WM88 are highlighted with orange solid lines. GWAS_A represents GWAS-All; GWAS_B represents GWAS-Bots. (d) Comparison of allelic skews in two melanoma cell lines (MNT-1 and WM88). The percentages are defined by the number of SNPs in each quadrant / total number of SNPs. Alleles with significant differential regulatory activities (adjusted p-value < 0.05) in both cell lines (green), MNT-1 (orange), and WM88 (blue) are highlighted. Nonsignificant alleles are colored in gray. The correlation of allelic skews in MNT-1 and WM88 is estimated by Pearson’s r = 0.41, p = 2.6×10−46. (e-f) Volcano plots showing allelic skewed variants in MNT-1 and WM88. Allelic skew is defined as the log2 fold change of the enhancer activity between the alternative and reference alleles (reference alleles match the genome hg19). The location of the top 5 SNPs based on the hg19 reference genome are highlighted. Pictures of the cell pellets of MNT-1 and WM88 showing that MNT-1 are darkly pigmented and WM88 are near non-pigmented.
Fig. 2:
Fig. 2:. rs6497271 impacts OCA2 expression and contributes to human skin color variations.
(a) MPRA identified four regulatory variants near OCA2. (b) rs6497271 is associated with African skin pigmentation (n = 1544), p-value was calculated using EPACTS “q. emmax” method. (c) MPRA showed that rs6497271 significantly changed the enhancer activities in MNT-1. Two-tailed unpaired t-tests (three biological replicates). (d) Chromatin interactions near OCA2 identified by Hi-C and H3K27ac HiChIP using Hae3 digestion. The purple arches are chromatin loops, the four vertical red lines are MFVs, the pink shadowed line represents enhancer E2. (e) qPCR showed that CRISPRi of E2 significantly reduces the expression of OCA2. CRISPRi was performed in MNT-1. Two-sided Dunnett’s test with adjustments for multiple comparisons (group OCA2_E2_sg1+sg2, n = 3; other groups, n= 6). (f) RNA-Seq data showing CRISPRi of E2 inhibits OCA2 gene expression. The p-value of OCA2 (p = 0) was set to 1×10−50 to be shown in the plot. p-values were calculated using DESeq2. (g) CRISPRi of E2 significantly reduced melanin levels. The CRISPRi was performed in MNT-1 using two sgRNAs. Two-tailed unpaired t-tests (n = 19). (h) qPCR showed that CRISPR-KO of E2 significantly decreases the expression level of OCA2. The CRISPR-KO was performed in MNT-1 using two sgRNAs. Two-tailed unpaired t-tests (n = 12). (i) CRISPR-KO of E2 significantly reduced melanin levels. Two-tailed unpaired t-tests (n = 10). (j) Genotyping of four CRISPR-edited MNT-1 clones at rs6497271. The 395bp amplicons flanking rs6497271 were amplified and sequenced using MiSeq. Top 2 genotypes in each clone are shown. (k) Mutations near rs6497271 significantly decreased melanin levels in MNT-1. Four clones were selected and compared with non-edited control cells. Two-sided Dunnett’s test with adjustments for multiple comparisons (n = 4). (l) Mutations near rs6497271 significantly reduced the expression of OCA2 in MNT-1. Two-sided Dunnett’s test with adjustments for multiple comparisons (OCA2-E2_C7, n = 6; OCA2-E2_H2, n = 8; others, n = 9). Data were presented as mean ± SEM. P values were listed above the bars. For boxplots, central lines are median, with boxes extending from the 25th to the 75th percentiles. Whiskers further extend by ±1.5 times the interquartile range from the limits of each box.
Fig. 3:
Fig. 3:. Continuing evolution of OCA2 enhancer E2 contributes to African skin pigmentation diversity.
(a) Allele frequencies at rs6497271 and rs12913832 in global populations. Derived alleles are colored in orange. Data was merged from 1000G , African 5M and SGDP datasets. (b) The enhancer activities of 4 haplotypes containing rs6497271 and rs12913832 in MNT-1 and WM88 estimated by LRA. Two-sided Tukey’s test with adjustments for multiple comparisons (n = 4). Data were presented as mean ± SEM. ns p > 0.05. (c) The frequencies of haplotypes containing rs6497271 and rs12913832 in global populations. Data was merged from 1000G, African 5M array and SGDP datasets. (d) Melanin indexes of individuals with different haplotype combinations at rs6497271 and rs12913832. Data was from GWAS-All (n = 1544). (e) Estimated ages of SNP rs6497271 and rs12913832. Data was from https://human.genome.dating/. For boxplots, central lines are median, with boxes extending from the 25th to the 75th percentiles. Whiskers further extend by ±1.5 times the interquartile range from the limits of each box.
Fig. 4:
Fig. 4:. Regulatory variant rs111969762 near MITF contributes to the light skin color of the San.
(a) MPRA identified two MFVs in regulatory elements near MITF. Di-Ju, Di-Xoo and Di-San are Di-SNPs. Green tracks represent ATAC-seq for MNT-1 and WM88; blue tracks show ATAC-Seq and ChIP-Seq data from normal human melanocytes (NHM); orange tracks indicate CUT&RUN data from MNT-1. The black dashes are Di-SNPs, the light green shadowed regions represent enhancers E1 and E2. (b-c) LRAs showed that rs111969762 located in E1 affects enhancer activity in both MNT-1 and WM88. Two-tailed paired t-tests (MNT-1, n = 6; WM88, n = 11). (d) Chromatin interactions at the MITF locus identified by Hi-C and H3K27ac HiChIP using Hae3 digestion. The upper matrix is from MNT-1 Hi-C data, and the lower matrix is from MNT-1 H3K27ac HiChIP data. TADs were called by onTAD and colored by nested TAD levels. The purple arches were loops called by cLoops. Melanocyte RNA-Seq and DNase-Seq tracks were downloaded from ENCODE . The pink shadowed region represents enhancers E1. (e) qPCR showed that CRISPRi of E1 significantly reduces the gene expression of MITF. Two-sided Dunnett’s test with adjustments for multiple comparisons (control, n = 8; others, n = 7). (f) CRISPRi of E1 significantly reduces melanin levels. Two-tailed unpaired t-tests (control, n = 7; MITF_E1_CRISPRi, n = 8). (g) qPCR showed that CRISPR-mediated deletion of E1 significantly decreased the gene expression of MITF. Two-tailed unpaired t-tests (n = 15). (h) CRISPR-mediated deletion of E1 significantly reduced melanin levels (two-tailed unpaired t-tests (n = 8)). CRISPR was performed in MNT-1 using two sgRNAs. (i) RNA-Seq data showing differentially expressed genes in E1-deleted MNT-1. Genes plotted in this figure were selected using DESeq2 (p<0.05, three biological replicates). (J) Gene ontology analysis of differentially expressed genes in E1-deleted MNT-1. Data were presented as mean ± SEM. P values were listed above the bars.
Fig. 5:
Fig. 5:. Regulatory SNPs of LEF1 and TRPS1 contribute to the light skin color of the San.
(a) MPRA identified two MFVs near the LEF1 locus. Green tracks represent ATAC-seq for MNT-1 and WM88; blue tracks show ATAC-Seq and ChIP-Seq data from normal human melanocytes (NHM); orange tracks indicate CUT&RUN data from MNT-1. The black dashes are Di-SNPs, the light green shadowed regions represent the locations of enhancers E1 and E2. (b) The allele frequency at rs17038630 in global populations using data from the 1000G , African 5M and SGDP datasets. (c-d) LRAs showed that rs17038630 located in E1 affects enhancer activity in both MNT-1 and WM88 (two-tailed paired t-tests (MNT-1, n = 6; WM88, n = 9)). (e) qPCR showed that CRISPRi of E1 significantly reduces the gene expression of LEF1. Two-sided Dunnett’s test with adjustments for multiple comparisons (control, n=17; others, n = 9). (f) CRISPRi of E1 significantly reduces melanin levels. Two-sided Dunnett’s test with adjustments for multiple comparisons (control, n=18; others, n = 9). (g) MPRA identified one MFV near the TRPS1 locus. (h) The allele frequency at rs11985280 in global populations, data were from the 180G , SGDP and 1000G datasets. (i-j) LRAs showed that rs11985280 located in E1 affects enhancer activity in both MNT-1 and WM88 (Two-tailed paired t-tests (MNT-1, n = 9; WM88, n = 6)). (k) qPCR showed that CRISPRi of the enhancer harboring rs11985280 significantly reduces the gene expression of TRPS1. Two-sided Dunnett’s test with adjustments for multiple comparisons (control, n=11; others, n = 9). (l) CRISPRi of the enhancer harboring rs11985280 significantly reduces melanin levels. Two-tailed unpaired t-tests (control, n=18; others, n = 9). Data were presented as mean ± SEM, P values were listed above the bars.
Fig. 6:
Fig. 6:. CYB561A3 and TMEM138 are the primary target genes of GWAS-SNP rs7948623.
(a) Three regulatory variants identified by MPRA near the DDB1 locus. The red dashes are MFVs, and the light green shadowed regions represent enhancers E1, E2 and E3. (b) LRA showed that rs7948623 affects enhancer activity. Two-tailed paired t-tests, MNT-1 (n = 9), WM88 (n = 6). (c) The allele A at rs7948623 is associated with light skin color in Africans (n = 1544), p-value was calculated using EPACTS “q. emmax” method. (d) Chromatin interactions near DDB1 identified by Hi-C and H3K27ac HiChIP. The light green shadowed regions represent enhancers E1 and the interaction matrix between E1 and its targets were highlighted by orange triangles. (e) qPCR showed that CRISPRi of E1 in MNT-1 significantly decreases the expression of CYB561A3 and TMEM138 (Two-sided Dunnett’s test with adjustments for multiple comparisons (control sgRNA n = 5; others n = 3)). (f) qPCR showed that CRISPR-mediated deletion of E1 significantly decreases the gene expression of CYB561A3, TMEM138 and DDB1. Two-tailed unpaired t-tests without adjustments for multiple comparisons (in group No_sg, TMEM138 (n = 6), CYB561A3 (n = 12), DDB1 (n = 6); in group Control_sg, TMEM138 (n = 6), CYB561A3 (n = 12), DDB1 (n = 12); in group E1_KO, TMEM138 (n = 5), CYB561A3 (n = 11), DDB1 (n = 11)). (g) CRISPRi of E1 inhibits the gene expression of CYB561A3 and TMEM138 based on RNA-Seq data. The top 10 differentially expressed genes were labeled, P was calculated by Wald’s test with multiple testing correction in DESeq2. (h) Volcano plot showed that CRISPR-mediated deletion of E1 reduces the gene expression of CYB561A3 and TMEM138. The top 10 differentially expressed genes were labeled, P was calculated by Wald’s test with multiple testing correction in DESeq2. (i) Gene ontology analysis of RNA-Seq data showed CRISPRi of E1 affects the expression of genes in pigmentation-related pathways. (j) Gene ontology analysis of RNA-Seq data showed CRISPR-mediated deletion of E1 affects the expression of genes in pigmentation-related pathways. Data were presented as mean ± SEM. ns p > 0.05.
Fig. 7:
Fig. 7:. CYB561A3 affects melanin levels in MNT-1.
(a) Overexpression of CYB561A3 significantly decreases melanin levels in MNT-1. Top panel shows photos of pigmentation levels of MNT-1 on the bottom of a 24-well plate. The MNT-1 were first treated with 150 μM phenylthiourea (PTU, inhibits the biosynthesis of melanin) for 9 days and then infected with lentivirus encoding GFP, TMEM138-GFP, CYB561A3-GFP or CD63-GFP for 7 days. CD63-GFP is a negative control which does not affect pigmentation. The p-values are calculated using two-sided Tukey’s test with adjustments for multiple comparisons (n = 12). (b) Confocal images of MNT-1 expressing CYB561A3-HA and immunostained with antibodies against the melanosomal marker TYRP1 (green) and HA (red). Scale bar: 10 μm. Bottom images represent the enlarged areas shown in blue boxes. Arrows point to regions of overlap (yellow) between CYB561A3-HA and TYRP1-positive cellular structures. Three independent experiments. (c) Quantification of the overlap between CYB561A3-HA and TYRP1 in MNT-1 (n = 10 cells from 3 independent experiments). (d) Volcano plot showing differentially expressed genes in CYB561A3-overexpressed MNT-1. The top 10 most differentially expressed genes were labeled. P was calculated by Wald’s test with multiple testing correction in DESeq2. (e) KEGG pathway analysis showed overexpression of CYB561A3 affects the expression of genes related to mitochondrial respiration and melanin production. (f) Overexpression of CYB561A3 affects the expression of genes related to melanosome and mitochondria function (n = 3). Genes involved in pigmentation were colored in black, and genes involved in mitochondrial function were colored in blue. (g) Volcano plot of differentially expressed genes in CYB561A3-knockout MNT-1. The top 10 differentially expressed genes were labeled, P was calculated by Wald’s test with multiple testing correction in DESeq2. (h) GO analysis showed that CYB561A3-knockout affects melanogenesis-related pathways. (i) Both knockout of CYB561A3 and deletion of enhancer E1 affect the expression of genes related to melanin production. Listed genes have p-values less than 0.05 based on DESeq2 (n = 3). For boxplots, central lines are median, with boxes extending from the 25th to the 75th percentiles. Whiskers further extend by ±1.5 times the interquartile range from the limits of each box. Data were presented as mean ± SEM.

References

    1. Jablonski NG & Chaplin G Colloquium paper: human skin pigmentation as an adaptation to UV radiation. Proc. Natl. Acad. Sci. U. S. A. 107 Suppl 2, 8962–8968 (2010). - PMC - PubMed
    1. Barsh GS What controls variation in human skin color? PLoS Biol. 1, E27 (2003). - PMC - PubMed
    1. Beleza S et al. Genetic architecture of skin and eye color in an African-European admixed population. PLoS Genet. 9, e1003372 (2013). - PMC - PubMed
    1. Liu F et al. Genetics of skin color variation in Europeans: genome-wide association studies with functional follow-up. Hum. Genet. 134, 823–835 (2015). - PMC - PubMed
    1. Martin AR et al. An Unexpectedly Complex Architecture for Skin Pigmentation in Africans. Cell 171, 1340–1353.e14 (2017). - PMC - PubMed

Supplementary concepts