. 2024 Jan 10;8(1):10.
doi: 10.1038/s41698-023-00488-4.

Profiling the heterogeneity of colorectal cancer consensus molecular subtypes using spatial transcriptomics

Affiliations

Profiling the heterogeneity of colorectal cancer consensus molecular subtypes using spatial transcriptomics

Alberto Valdeolivas et al. NPJ Precis Oncol. .

Abstract

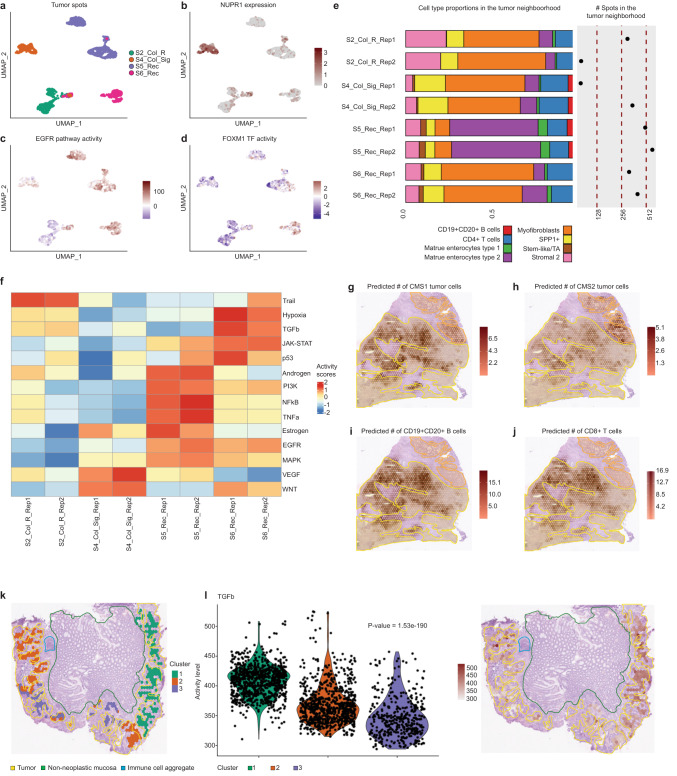
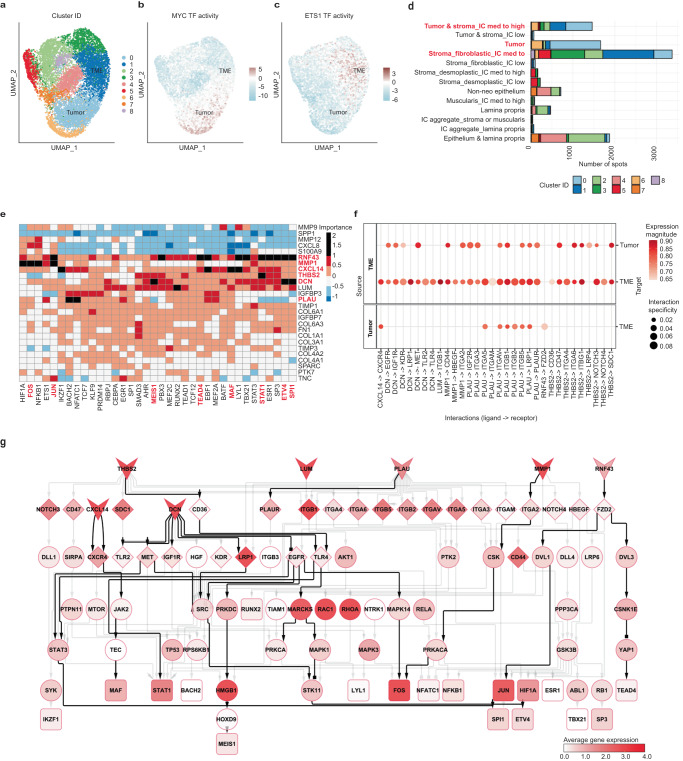
The consensus molecular subtypes (CMS) of colorectal cancer (CRC) is the most widely-used gene expression-based classification and has contributed to a better understanding of disease heterogeneity and prognosis. Nevertheless, CMS intratumoral heterogeneity restricts its clinical application, stressing the necessity of further characterizing the composition and architecture of CRC. Here, we used Spatial Transcriptomics (ST) in combination with single-cell RNA sequencing (scRNA-seq) to decipher the spatially resolved cellular and molecular composition of CRC. In addition to mapping the intratumoral heterogeneity of CMS and their microenvironment, we identified cell communication events in the tumor-stroma interface of CMS2 carcinomas. This includes tumor growth-inhibiting as well as -activating signals, such as the potential regulation of the ETV4 transcriptional activity by DCN or the PLAU-PLAUR ligand-receptor interaction. Our study illustrates the potential of ST to resolve CRC molecular heterogeneity and thereby help advance personalized therapy.


Conflict of interest statement

A.V., B.A., E.G., N.G., M.R., S.B., I.W., B.P., L.V., E.Y., M.B., M.S., N.K., B.J., P.S., T.B. and K.H. are currently employed by F. Hoffmann-La Roche Ltd. A.J.L. and D.T. were previously employed by F. Hoffmann-La Roche Ltd. A.J.L. is currently employed by Idorsia Pharmaceuticals Ltd. D.T. is currently employed by University of Bern. A.L. is currently employed by Genentech, Inc. M.D.T. was previously employed by Genentech, Inc and is currently employed by Gilead Sciences, Inc. J.S.R. has received funding from GSK and Sanofi and fees from Travere Therapeutics and Astex Pharmaceuticals. The authors declare that they have no other competing interests.

Figures

Fig. 1
Fig. 1. Study outline and deconvolution results matching histopathological annotations with high correlation between replicates.
a Study outline displaying the anatomical localization of our set of CRC samples, their spatial transcriptomics processing and the deconvolution-based approach to characterize spatial features of CMS. Figures created with BioRender.com. b UMAP embedding of the gene expression measurements per spot split by technical replicates. Colors represent the different patients. c UMAP embedding of the gene expression measurements per spot colored by pathologist’s annotations. In addition, a bar plot displays the proportions of these annotations per sample. IC: immune cells. d Proportions of major cell classes per sample as estimated by the results of the deconvolution approach. The right hand side of the plot displays the number of analyzed spots per sample. e Enrichment/depletion plot describing the association between cell type abundance as predicted by the deconvolution (x-axis) and the different anatomical regions as annotated by the pathologist (y-axis). The dot size represents the enrichment score (Methods), while the color represents enrichment (red) or depletion (blue). IC immune cells. fh Spatial mapping of the predicted number of mature enterocytes type I, stem-like transient amplifiers (TA) and CD4+ T cells per spot matching the pathologists’ tissue annotation and expected cell type localization as illustrated for sample S6_Rec_Rep2.
Fig. 2
Fig. 2. Consensus molecular subtyping of our set of CRC samples, characterization of their TME and spatially resolved mapping of their histological and molecular features.
ae Cell type proportions per sample as estimated by the results of the deconvolution. The number of spots containing an abundance of at least 20% of the specified cell types is also displayed. NK natural killers, Mac Macrophages, cDCs conventional dendritic cells. f Enrichment/depletion assessment of selected cell types (x-axis) in CMS2 and mixed CMS1-CMS2 tumors in the different tissue compartments defined by the pathologist’s spot classification (y-axis). IC immune cells. gj Spatial mapping of the predicted abundance of CMS2 and CMS3 tumor cells and the module scores of the iCMS2-upregulated and the gastric metaplasia signatures overlaid with the pathologist’s tissue annotation in the S5_Rec_Rep1 sample. k Per spot Pearson’s cross-correlation across all the samples between TF activities and CMS cell abundances. For visualization purposes, the 10 most highly correlated TFs in absolute value per CMS are shown. l Per spot Pearson’s cross-correlation across all the samples between pathway activities and CMS cell abundances. mo Spatial mapping of the predicted abundance of the CMS1 cells, the JAK-STAT pathway activity and the MAPK pathway activity overlaid with the pathologist’s tissue annotation in the S3_Col_R sample. pr Spatial mapping of the predicted abundance of the CMS2 cells, the WNT pathway activity and the VEGF pathway activity overlaid with the pathologist’s tissue annotation in the S2_Col_R_Rep1 sample. s, t Spatial mapping of the predicted transcriptional activity of the MYC and E2F4 TFs overlaid with the pathologist’s tissue annotation in the S5_Rec_Rep1 sample. Note the colocalization with CMS2 tumor cell abundance (Fig. 2g).
Fig. 3
Fig. 3. Inter- and intra-patient heterogeneity in CRC tumors and their TME in terms of cell composition and different molecular features.
ad UMAP embeddings of the gene expression measurements in tumor annotated spots which were colored by different criteria: a per patient, b per the expression of the NUPR1 gene, c per activity of the EGFR pathway and d per activity of the FOXM1 TF. e Cell type proportions in the tumor-surrounding spots per sample as estimated by the results of the deconvolution approach. The number of tumor-surrounding spots for the different samples is also displayed. TA transient amplifiers. f Differential pathway activity computed on pseudo-bulk RNA-seq generated from the tumor-surrounding spots for the different samples. gj Spatial mapping of the predicted abundance of CMS1, CMS2, CD19+CD20+ B cells and CD8+ T cells overlaid with the pathologist’s tissue annotation in the S3_Col_R sample. k Overlay of the spatial mapping of the clustering at subspot enhanced resolution of the tumor-annotated spots with the pathologist’s tissue annotations in the S5_Rec_Rep1 sample. l Spatial mapping and violin plots per group of the TGFb pathway activity at the enhanced subspot resolution in the S5_Rec_Rep1 sample. A Kruskal–Wallis statistical test was performed to assess whether the pathway activities in the different subclusters originated from the same distribution (p-value).
Fig. 4
Fig. 4. Clustering based on TF activities to study cell communication events at the tumor-stroma interface of CMS2 tumors. The signaling cascades triggered by those events and leading to transcriptional activities related to tumor progression were also investigated.
ac UMAP embedding of the TF activity profiles for our set of CMS2 samples. The spots were colored following different criteria: a per cluster group, b per activity of the MYC TF, and c per activity of the ETS1 TF. d Number of spots belonging to the different categories of pathologist’s annotations and clusters as inferred from the TF activity profiles. IC immune cells. e Misty results showing the potential importance of ligands (rows) expression on TF (columns) activity. The ligand-TFs relationships with an importance score over 1 are represented as black slots and were further investigated. Bold red characters were used to highlight the name of the ligands and TFs referred to in the main text. f Top predicted ligand-receptor interactions at the tumor stroma interface. The left panel shows the source of the interaction (ligands) and the right the target (receptors). g Signaling cascades potentially linking ligands (V shape) to their downstream TF targets (triangles) according to Misty predictions. The downstream signaling cascades go first through the top predicted receptors (diamonds) and then to intermediary signaling proteins (ellipses). The color of the nodes indicates the average expression of these genes in the TME cluster. Network edges can represent stimulatory (arrows) or inhibitory (squares) interactions. The edges representing interactions referred to in the main text are highlighted in black.
Fig. 5
Fig. 5. Transcription factor activity and ligand-receptor interactions in the scRNA-seq from Lee et al. Spatial maps showing gene expression, TF activity and a score for selected tumor-associated processes.
a Average TF activity per cell type. The percentage of cells of a given type where the TF is active is represented by the size of the circle. NK: natural killers, Mac: macrophages, cDCs: conventional dendritic cells, ECs: endothelial cells. bd Ligand-receptor interactions between the different cell types overlapping with the interactions predicted in our ST data. The left panel shows the source of the interaction (ligands) and the right the target (receptors): b target cell types are myeloid cells, c target cell types are the major stromal cell populations, and d target cell types are the different CMS tumor cell types. Mac macrophages, cDCs conventional dendritic cells. eg Overlay of the DCN gene expression, the predicted ETV4 TF activity and the metastasis score with the pathologist’s tissue annotations in the S2_Col_R_Rep1 sample. A red square highlights the tumor region exhibiting invasive morphological traits. hj Overlay of the RNF43 gene expression, the predicted JUN TF activity and the metastasis score with the pathologist’s tissue annotations in the S6_Rec_Rep2 sample.
Fig. 6
Fig. 6. Characterization and analysis of an external ST CRC dataset to support the results in our internal set of samples.
a Proportions of major cell classes per sample as estimated by the results of the deconvolution. The right hand side of the plot displays the number of analyzed spots per sample. b CMS tumor cell type proportions per sample as estimated by the results of the deconvolution approach. The number of spots containing an abundance of at least 20% of tumor cells subtypes is also displayed. c, d Overlay of the spatial mapping of the predicted CMS2 tumor cell abundance with the pathologist’s tissue annotations in the ST-colon1_Unt and ST-liver1_Unt samples. e Per spot Pearson’s cross-correlation across all the samples between pathway activities and CMS cell abundances. f Per spot Pearson’s cross-correlation across all the samples between TF activities and CMS cell abundances. For visualization purposes, the 10 most highly correlated TFs in absolute value per CMS are shown. g Overlay of the spatial mapping of the predicted WNT pathway activity with the pathologist’s tissue annotations in the ST-colon1_Unt sample. h Overlay of the spatial mapping of the predicted MYC TF activity with the pathologist’s tissue annotations in the ST-colon2_Unt sample. i Overlay of the spatial mapping of the predicted MAPK pathway activity with the pathologist’s tissue annotations in the ST-liver1_Unt sample. j Overlay of the spatial mapping of the predicted NR2C2 TF activity with the pathologist’s tissue annotations in the ST-liver2_Unt sample. k Misty results showing the potential importance of ligands (rows) expression on TF (columns) activity when considering the samples from primary CRC tumors. The ligand-TFs relationships with an importance score over 1 are represented as black slots and were considered as relevant. The ligands and TFs discussed in the results sections are highlighted in red. l, m Overlay of the spatial mapping of the RNF43 gene expression and the predicted TEAD1 TF activity with the pathologist’s tissue annotations in the ST-colon4_Tre sample. n, o Overlay of the spatial mapping of the DCN gene expression and the predicted ETV4 TF activity with the pathologist’s tissue annotations in the ST-liver4_Tre.

References

    1. Biller LH, Schrag D. Diagnosis and treatment of metastatic colorectal cancer: a review. JAMA. 2021;325:669–685. doi: 10.1001/jama.2021.0106. - DOI - PubMed
    1. Wang W, et al. Molecular subtyping of colorectal cancer: recent progress, new challenges and emerging opportunities. Semin. Cancer Biol. 2019;55:37–52. doi: 10.1016/j.semcancer.2018.05.002. - DOI - PMC - PubMed
    1. Okita A, et al. Consensus molecular subtypes classification of colorectal cancer as a predictive factor for chemotherapeutic efficacy against metastatic colorectal cancer. Oncotarget. 2018;9:18698–18711. doi: 10.18632/oncotarget.24617. - DOI - PMC - PubMed
    1. Chan DKH, Buczacki SJA. Tumour heterogeneity and evolutionary dynamics in colorectal cancer. Oncogenesis. 2021;10:1–9. doi: 10.1038/s41389-021-00342-x. - DOI - PMC - PubMed
    1. Guinney J, et al. The consensus molecular subtypes of colorectal cancer. Nat. Med. 2015;21:1350–1356. doi: 10.1038/nm.3967. - DOI - PMC - PubMed