. 2024 Feb;5(2):347-363.
doi: 10.1038/s43018-023-00694-w. Epub 2024 Jan 10.

The artificial intelligence-based model ANORAK improves histopathological grading of lung adenocarcinoma

Collaborators, Affiliations

The artificial intelligence-based model ANORAK improves histopathological grading of lung adenocarcinoma

Xiaoxi Pan et al. Nat Cancer. 2024 Feb.

Abstract

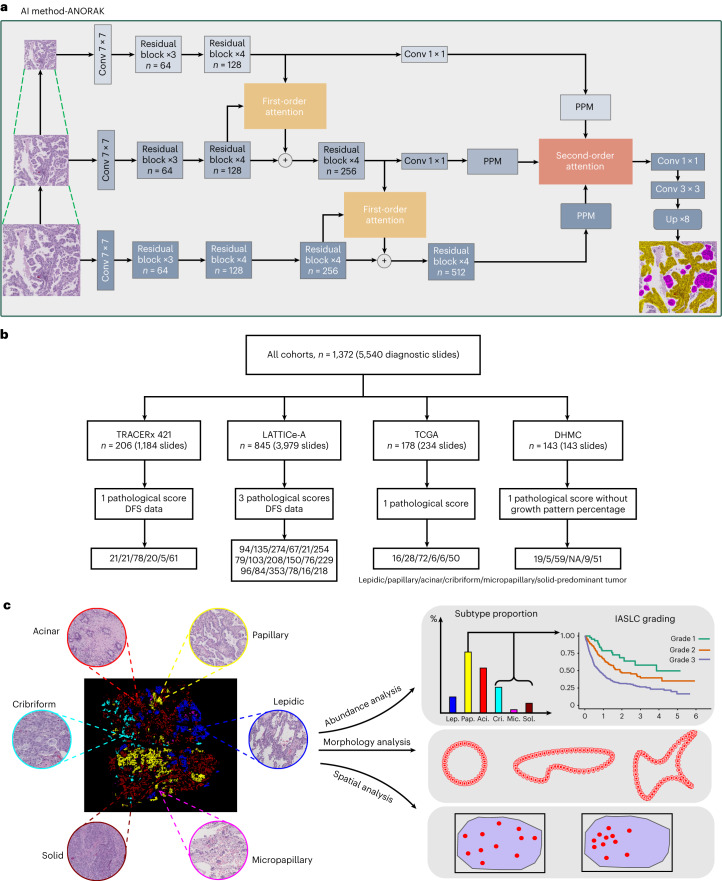
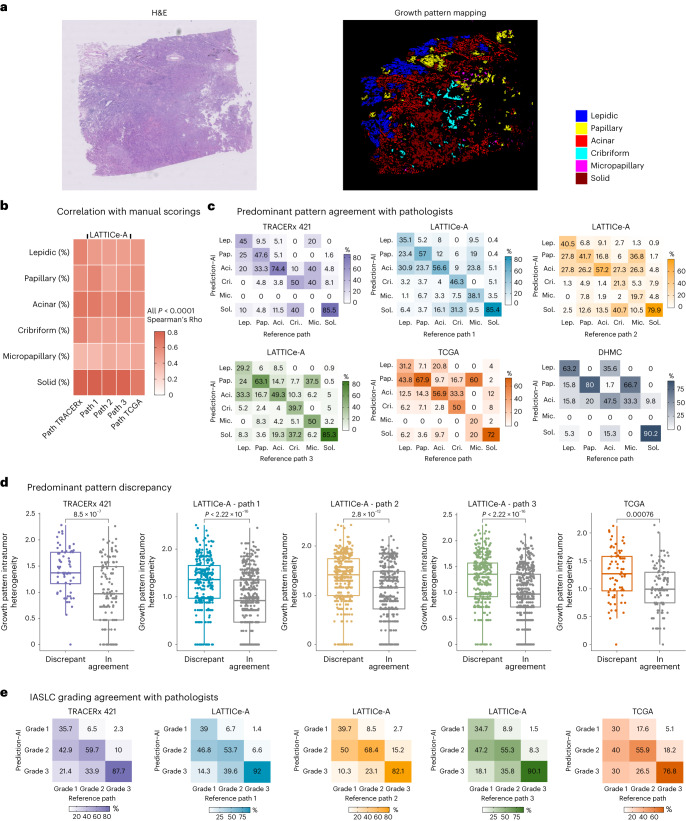
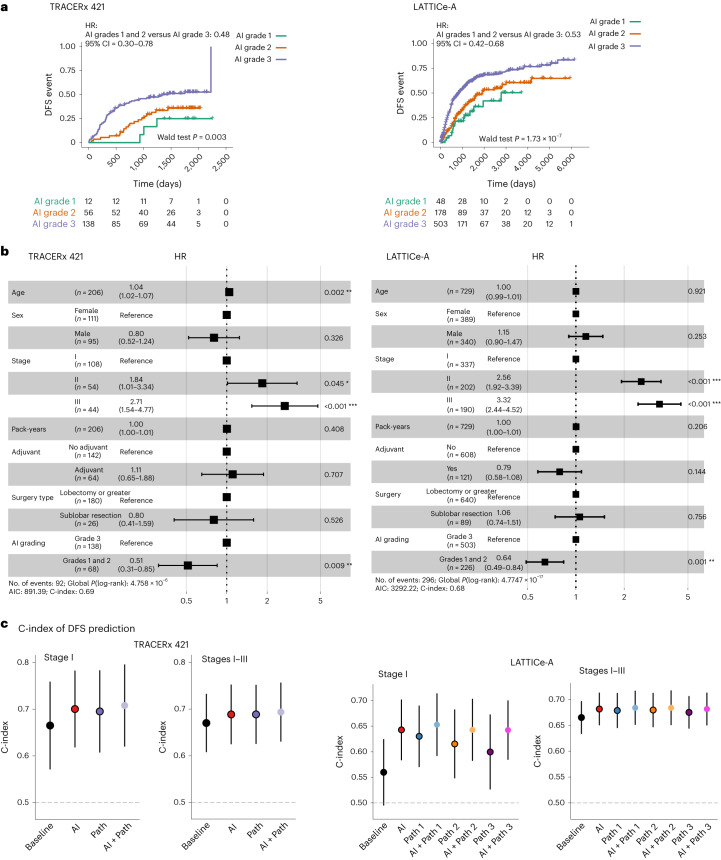
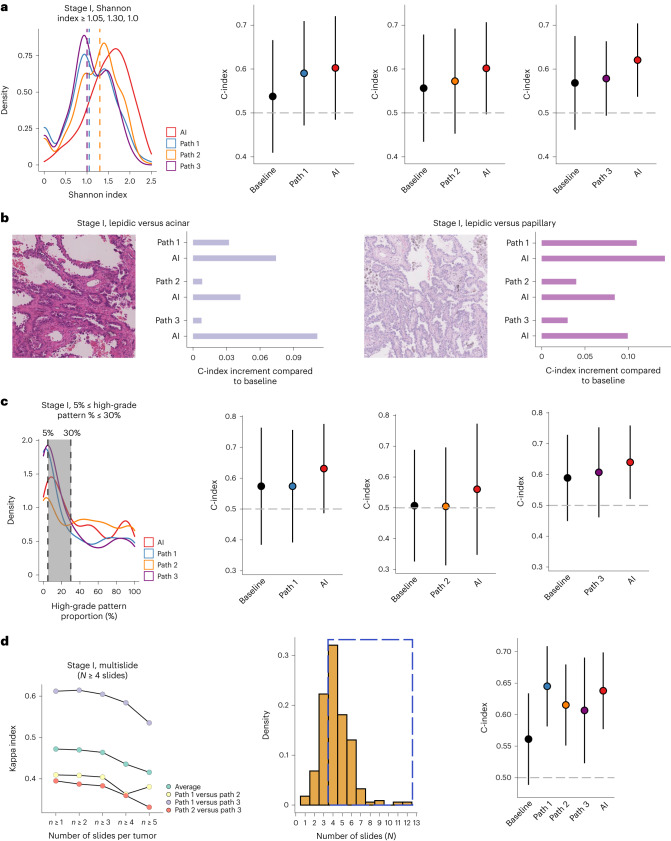
The introduction of the International Association for the Study of Lung Cancer grading system has furthered interest in histopathological grading for risk stratification in lung adenocarcinoma. Complex morphology and high intratumoral heterogeneity present challenges to pathologists, prompting the development of artificial intelligence (AI) methods. Here we developed ANORAK (pyrAmid pooliNg crOss stReam Attention networK), encoding multiresolution inputs with an attention mechanism, to delineate growth patterns from hematoxylin and eosin-stained slides. In 1,372 lung adenocarcinomas across four independent cohorts, AI-based grading was prognostic of disease-free survival, and further assisted pathologists by consistently improving prognostication in stage I tumors. Tumors with discrepant patterns between AI and pathologists had notably higher intratumoral heterogeneity. Furthermore, ANORAK facilitates the morphological and spatial assessment of the acinar pattern, capturing acinus variations with pattern transition. Collectively, our AI method enabled the precision quantification and morphology investigation of growth patterns, reflecting intratumoral histological transitions in lung adenocarcinoma.

Trial registration: ClinicalTrials.gov NCT01888601.


Conflict of interest statement

S.V. is a coinventor to a patent of methods for detecting molecules in a sample (patent no. 10578620). A.H. has received fees from Abbvie, Almirall, Boehringer Ingelheim, Clovis Oncology, Ipsen, Takeda Pharmaceuticals, AstraZeneca, Daiichi Sankyo, Merck Serono, Merck/MSD, UCB, Kyowa Kirin, Servier, Sobi, Pfizer and Roche for delivering general education and training in clinical trials; has received fees for member of independent data monitoring committees for Roche-sponsored clinical trials and academic projects on real-world evidence or tumor-agnostic therapies coordinated by Roche; he has been paid honoraria for speaking at Roche-funded conferences (on real-world data); he has an academic collaboration with Navio and is an unpaid member of their advisory board; he is an investigator for an academic study (SUMMIT) sponsored by UCL, which is funded by GRAIL; he has received one honorarium for an advisory board meeting for GRAIL; he has received a consulting fee from Evidera (for one GRAIL-initiated project); and he has previously owned shares in Illumina and Thermo Fisher Scientific (sold in 2020); he is on the scientific advisory board for Adela Bio and has received no payments or honoraria for this, although he has share options available. A.G.N. reports personal fees from Merck, Boehringer Ingelheim, Novartis, AstraZeneca, Bristol Myers Squibb, Roche, Abbvie, Oncologica, Uptodate, the European Society of Oncology, Takeda Pharmaceuticals, Sanofi and Liberium, as well as personal fees and grants from Pfizer. M.J-H. is a Cancer Research UK Career Establishment Awardee and has received funding from Cancer Research UK, the International Association for the Study of Lung Cancer and International Lung Cancer Foundation, the Lung Cancer Research Foundation, the Rosetrees Trust, UK and Ireland Neuroendocrine Tumour Society, the National Institute for Health Research (NIHR) and the NIHR UCLH Biomedical Research Centre. M.J-H. has consulted for, and is a member of, the Achilles Therapeutics Scientific advisory board and steering committee, has received speaker honoraria from Pfizer, Astex Pharmaceuticals and Oslo Cancer Cluster, and holds a patent (no. PCT/US2017/028013) relating to methods for lung cancer detection. C.S. acknowledges grant support from AstraZeneca, Boehringer Ingelheim, Bristol Myers Squibb, Pfizer, Roche-Ventana, Invitae (previously Archer Dx, collaboration in minimal residual disease sequencing technologies) and Ono Pharmaceutical. He is an AstraZeneca advisory board member and chief investigator for the AZ MeRmaiD 1 and 2 clinical trials; he is also co-chief investigator of the NHS Galleri trial funded by GRAIL and a paid member of GRAIL’s scientific advisory board. He receives consultant fees from Achilles Therapeutics (scientific advisory board member), Bicycle Therapeutics (scientific advisory board), Genentech, Medicxi, Roche Innovation Centre-Shanghai, Metabomed (until July 2022) and the Sarah Cannon Research Institute. C.S. has received honoraria from Amgen, AstraZeneca, Pfizer, Novartis, GlaxoSmithKline, MSD, Bristol Myers Squibb, Illumina and Roche-Ventana. C.S. had stock options in Apogen Biotechnologies and GRAIL until June 2021; he currently has stock options in Epic Bioscience, Bicycle Therapeutics; he has stock options and is a cofounder of Achilles Therapeutics. C.S. holds patents relating to assay technology to detect tumor recurrence (no. PCT/GB2017/053289), target neoantigens (no. PCT/EP2016/059401), identify patent response to immune checkpoint blockade (no. PCT/EP2016/071471), determine HLA loss of heterozygosity (no. PCT/GB2018/052004), predict survival rates of patients with cancer (no. PCT/GB2020/050221) and identify patients who respond to cancer treatment (no. PCT/GB2018/051912), as well as a US patent related to detecting tumor mutations (no. PCT/US2017/28013) and methods for lung cancer detection (no. US20190106751A1), and both European and US patents related to identifying insertion and deletion mutation targets (no. PCT/GB2018/051892). Y.Y. has received speaker’s bureau honoraria from Roche and consulted for Merck. D.A.M. reports speaker fees from Eli Lilly, AstraZeneca and Takeda Pharmaceuticals, consultancy fees from AstraZeneca, Thermo Fisher Scientific, Takeda Pharmaceuticals, Amgen, Janssen, MIM Software, Bristol Myers Squibb and Eli Lilly, and has received educational support from Takeda Pharmaceuticals and Amgen. All other authors declare no competing interests.

Figures

Fig. 1
Fig. 1. Proposed computational pipeline for precision mapping and spatial heterogeneity analyses.
a, The deep learning network architecture for growth pattern segmentation integrating inputs over multiple spatial resolutions and delivering pixel-wise delineations. b, Overview of all the cohorts and available data. c, Downstream analyses enabled by the AI method, including abundance quantification, risk stratification and morphological and spatial heterogeneity analyses. PPM, Pyramid Pooling Module; Lep., lepidic; Pap., papillary; Aci., acinar; Cri., cribriform; Mic., micropapillary; Sol., solid; NA, not applicable. Source data
Fig. 2
Fig. 2. Performance of AI in the prediction and quantification of growth patterns.
a, Segmentation example generated by ANORAK. b, Correlations of growth pattern proportions at the tumor level between AI and pathologists. Growth pattern proportions were not available in the DHMC cohort; thus, plots relevant to proportions were not illustrated for the DHMC (same in d and e). P values were corrected for multiple comparisons using the Benjamini–Hochberg method. c, Performance comparison with pathologists in predicting the predominant pattern per case (the cribriform predominant slide per tumor was not available in the DHMC cohort). d, Growth pattern intratumoral heterogeneity substantially contributed to the discrepancy between AI and pathologists (TRACERx 421, P = 8.467 × 10−7, n = 206; LATTICe-A, P1 < 2.22 × 10−16, P2 = 2.816 × 10−12, P3 < 2.22 × 10−16, n = 845; TCGA, P = 0.0007632, n = 177). Each P value was calculated using a two-sided Wilcoxon rank-sum test and not adjusted for multiple comparisons. The median value is indicated by a thick horizontal line; the first and third quartiles are represented by the box edges; the whiskers indicate 1.5× the interquartile range. e, Performance comparison with pathologists in the prediction of IASLC grading per case. Source data
Fig. 3
Fig. 3. Survival analyses of AI and pathologist grading.
a, Kaplan–Meier curves illustrating the difference in DFS according to AI grading. b, Multivariable Cox regression analyses showing that the prognostic effect of AI grading is independent of age, sex, tumor stage, smoking pack-years, adjuvant therapy and type of surgery (TRACERx 421: P = 0.009408, LATTICe-A: P = 0.00118). HRs of each variable with 95% CIs are shown on the horizontal axis; the P value was derived using a Wald test. *P < 0.05, **P < 0.01, ***P < 0.001. c, Comparison of DFS prediction measured according to C-index for stage I (TRACERx 421, n = 108; LATTICe-A, n = 337) and stage I–III (TRACERx 421, n = 206, LATTICe-A, n = 729) tumors, where the baseline characteristics included age, sex and tumor stage; AI included baseline parameters and AI grading; path included baseline parameters and pathologist grading; AI + path included baseline parameters, and AI and pathologist gradings. C-indexes with 95% CIs are shown on the vertical axis. AIC, Akaike information criterion. Source data
Fig. 4
Fig. 4. Assistance of AI in challenging scenarios for grading stage I tumors in LATTICe-A.
a, Scenario 1: tumors with highly diversified growth patterns indicated by the Shannon diversity index (equal to or greater than the median). The vertical dashed lines indicate median values. Comparison of DFS prediction measured using the C-index (n1 = 169, n2 = 162, n3 = 167), where baseline included age and sex, AI included baseline parameters and AI grading, and path included baseline parameters and pathologist grading. C-indexes with 95% CIs are shown on the vertical axis (same with c,d). b, Scenario 2: differentiation between lepidic-predominant and acinar-predominant tumors (n1 = 146, n2 = 136, n3 = 175), and between lepidic-predominant and papillary-predominant tumors (n1 = 92, n2 = 77, n3 = 79). C-index improvement compared with baseline regarding DFS prediction. c, Scenario 3: tumors with high-grade patterns between 5% and 30% (n1 = 79, n2 = 63, n3 = 128, gray areas between two vertical dashed lines). d, Scenario 4: tumors with no fewer than four slides (n = 233, dashed box), for which the interobserver kappa index decreased. Source data
Fig. 5
Fig. 5. Characterization of tumors with acinar morphological features and spatial heterogeneity.
a, LUAD subtype distribution across stages in LATTICe-A showing that acinar is the most prevalent pattern in stage I tumors. b, Area distribution of growth pattern islands delineated by AI in TRACERx 421 and LATTICe-A, indicating that the areas of acinar islands are similar to micropapillary islands, but smaller than lepidic, papillary, cribriform and solid islands. c, Smaller acinar island areas were enriched in lepidic-predominant (TRACERx 421, P = 0.0005161, n = 108; LATTICe-A, P = 5.413 × 10−12, n = 420) and high-grade-predominant tumors (TRACERx 421, P = 9.797 × 10−11, n = 157; LATTICe-A, P < 2.2 × 10−16, n = 593) compared to acinar-predominant and papillary-predominant tumors. d, Acinar island areas were notably smaller in cribriform-predominant tumors compared to acinar-predominant tumors (TRACERx 421, P = 0.0006956, n = 95; LATTICe-A, P = 1.515 × 10−7, n = 290). e, Acinar island shapes were notably regular in high-grade-predominant tumors compared to lepidic-predominant tumors (TRACERx 421, P = 0.002439, n = 81; LATTICe-A, P = 4.118 × 10−7, n = 295). ce, Each point is a tumor; the y axis is the mean area (c,d) or solidity index (e) of all the individual acinar islands within a tumor. The P value was calculated using a two-sided Wilcoxon rank-sum test not adjusted for multiple comparisons. The median value is indicated by a thick horizontal line; the first and third quartiles are represented by the box edges; the whiskers indicate 1.5× the interquartile range. f, Acinar morphological features reflecting different growth patterns; small-area acinar islands with irregular shapes were more likely observed in lepidic-predominant tumors, whereas in cribriform-predominant and solid-predominant tumors, small-area acinar islands with a regular shape were enriched. g, Spatial arrangement of acinar islands across predominant subtypes. h, Kaplan–Meier curves comparing tumors with low and high levels of acinar scattering for TRACERx 421 and LATTICe-A. i, Multivariable Cox regression analyses showing that tumors exhibiting a high degree of acinar scattering were linked to decreased DFS compared to tumors with low acinar scattering, independent of AI grading in TRACERx 421 (P = 0.004209) and LATTICe-A (P = 2.61 × 10−5). HRs of each variable with 95% CIs are shown on the horizontal axis; the P value was derived using a Wald test. **P < 0.01, ***P < 0.001. Source data
Extended Data Fig. 1
Extended Data Fig. 1. Precise pathological annotations for training and sub-modules of the developed deep learning model (ANORAK).
a. Examples illustrating morphologically distinct growth patterns in lung adenocarcinoma. b. Distribution of annotations regarding the number of patches and pixels. c. Detailed architectures of sub-modules developed for the AI method.
Extended Data Fig. 2
Extended Data Fig. 2. Segmentation performance.
a,b. Segmentations generated by AI at low-power and high-power resolutions, deposited in 10.6084/m9.figshare.24599796.
Extended Data Fig. 3
Extended Data Fig. 3. Segmentation performance and intra- and inter-comparisons.
a. Segmentations generated by AI at low-power and high-power resolutions, deposited in 10.6084/m9.figshare.24599796. b. Comparison of segmentation and prediction performance for ablation experiments. c. Comparison of segmentation and prediction performance with other methods.
Extended Data Fig. 4
Extended Data Fig. 4. Inter-pathologists comparison for predominant pattern and IASLC grading in LATTICe-A.
a. Interobserver agreement of each pattern. b, c. Interobserver agreement of predominant pattern and IASLC grading at tumor level. d. Growth pattern intra-tumoral heterogeneity substantially contributed to the discrepancy between pathologists (n = 845 each, P1 < 2.22 × 10−16, P2 = 4.323× 10−13, P3 = 1.589 × 10−15). P value was calculated using a two-sided Wilcoxon rank-sum test and not adjusted for the multiple comparisons. The median value is indicated by a thick horizontal line; the first and third quartiles are represented by box edges; whiskers indicate 1.5 times interquartile range. e. Interobserver agreement of each grade.
Extended Data Fig. 5
Extended Data Fig. 5. Survival analyses of AI and pathological gradings.
a. Pair-wise comparison of AI grades in univariable and multivariable Cox proportional hazards models. b–d. Multivariable Cox regression analyses showing pathological gradings were independent of age, sex, tumor stage, smoking pack-years, adjuvant therapy, type of surgery in LATTICe-A (P1 = 0.00524, P2 = 0.000913, P3 = 0.0169). HRs of each variable with 95% confidence intervals are shown on the horizontal axis; P value was derived with Wald test. Asterisks indicate: *P < 0.05, **P < 0.01, ***P < 0.001. e. Comparison of improvements driven by AI and additional manual scoring for stage I (n = 337) and stage I-III (n = 729) tumors in LATTICe-A, where models included age, sex, tumor stage and gradings from AI or/and pathologists. C-indexes with 95% confidence intervals are shown on the vertical axis. Source data
Extended Data Fig. 6
Extended Data Fig. 6. Assistance of AI in grading challenging scenarios for stage I-III tumors in LATTICe-A.
a. Challenging scenario 1, tumors with highly diversified growth patterns indicated by the Shannon diversity index (n1 = 363, n2 = 361, n3 = 390). b. Challenging scenario 2, differentiation between lepidic- and acinar-predominant tumors (n1 = 274, n2 = 222, n3 = 340), and between lepidic- and papillary-predominant tumors (n1 = 162, n2 = 134, n3 = 137). c. Challenging scenario 3, tumors with high-grade patterns between 5% and 30% (n1 = 162, n2 = 117, n3 = 252). d. Challenging scenario 4, tumors with no less than 4 slides (n = 551). C-indexes of each variable with 95% confidence intervals are shown on the vertical axis. Source data
Extended Data Fig. 7
Extended Data Fig. 7. Morphological and spatial analyses of acinar island.
a. Acinar morphological feature measures, area and solidity index. b. Acinar islands are morphologically different among tumors with different predominant patterns (TRACERx 421, P = 1.493 × 10−9 and P = 0.0005932, n = 173; LATTICe-A, P < 2.22 × 10−16 and P = 2.626 × 10−10, n = 654). P value was calculated using a one-way Kruskal-Wallis rank-sum test and not adjusted for the multiple comparisons. c. Acinar island areas were less varied in lepidic-predominant (TRACERx 421, P = 0.002889, n = 108; LATTICe-A, P = 7.743 × 10−9, n = 420) and high-grade-predominant (TRACERx 421, P = 7.617 × 10−8, n = 157; LATTICe-A, P = 1.611 × 10−15, n = 593) tumors than acinar- and papillary-predominant tumors. d. Acinar island shapes were less varied in high-grade-predominant tumors than lepidic predominant tumors (TRACERx 421, P = 6.374 × 10−6, n = 81; LATTICe-A, P = 8.184 × 10−16, n = 295). b-d. Each point is a tumor, y axis is the standard deviation of the area or solidity index for all the individual acinar islands within a tumor. The median value is indicated by a thick horizontal line; the first and third quartiles are represented by box edges; whiskers indicate 1.5 times interquartile range. c-d. P value was calculated using a two-sided Wilcoxon rank-sum test and not adjusted for the multiple comparisons. e. Example illustrating the transition from acinar to cribriform. f. Examples of high and low acinar scattering inferred from H&E images with the AI method, deposited in 10.6084/m9.figshare.24599796. Source data
Extended Data Fig. 8
Extended Data Fig. 8. Acinar scattering stratifying subgroups of AI grading.
a. Acinar scattering stratifying patients at AI grade 1 (TRACERx 421 P = 0.5112, n = 12; LATTICe-A P = 0.5397, n = 55). b. Acinar scattering stratifying patients at AI grade 2 (TRACERx 421 P = 0.0533, n = 56; LATTICe-A P = 1.947 × 10−5, n = 212). c. Acinar scattering stratifying patients at AI grade 3 (TRACERx 421 P = 0.04235, n = 137; LATTICe-A P = 0.007446, n = 570). d. Acinar scattering stratifying patients at AI grades 1&2 (TRACERx 421 P = 0.02517, n = 68; LATTICe-A P = 1.387 × 10−5, n = 267). HRs of each variable with 95% confidence intervals are shown on the horizontal axis. P value was derived with Wald test, and not adjusted for multiple comparisons. Asterisks indicate: *P < 0.05, **P < 0.01, ***P < 0.001. Source data

References

    1. Nicholson AG, et al. The 2021 WHO Classification of Lung Tumors: impact of advances since 2015. J. Thorac. Oncol. 2022;17:362–387. doi: 10.1016/j.jtho.2021.11.003. - DOI - PubMed
    1. Moreira AL, et al. A grading system for invasive pulmonary adenocarcinoma: a proposal from the International Association for the Study of Lung Cancer Pathology Committee. J. Thorac. Oncol. 2020;15:1599–1610. doi: 10.1016/j.jtho.2020.06.001. - DOI - PMC - PubMed
    1. Boland JM, Wampfler JA, Yang P, Yi ES. Growth pattern-based grading of pulmonary adenocarcinoma—analysis of 534 cases with comparison between observers and survival analysis. Lung Cancer. 2017;109:14–20. doi: 10.1016/j.lungcan.2017.04.013. - DOI - PubMed
    1. Thunnissen E, et al. Reproducibility of histopathological subtypes and invasion in pulmonary adenocarcinoma. An international interobserver study. Mod. Pathol. 2012;25:1574–1583. doi: 10.1038/modpathol.2012.106. - DOI - PMC - PubMed
    1. Deng C, et al. Validation of the novel International Association for the Study of Lung Cancer grading system for invasive pulmonary adenocarcinoma and association with common driver mutations. J. Thorac. Oncol. 2021;16:1684–1693. doi: 10.1016/j.jtho.2021.07.006. - DOI - PubMed

Publication types