. 2024 Jan;30(1):279-289.
doi: 10.1038/s41591-023-02682-0. Epub 2024 Jan 11.

Insights for precision oncology from the integration of genomic and clinical data of 13,880 tumors from the 100,000 Genomes Cancer Programme

Affiliations

Insights for precision oncology from the integration of genomic and clinical data of 13,880 tumors from the 100,000 Genomes Cancer Programme

Alona Sosinsky et al. Nat Med. 2024 Jan.

Abstract

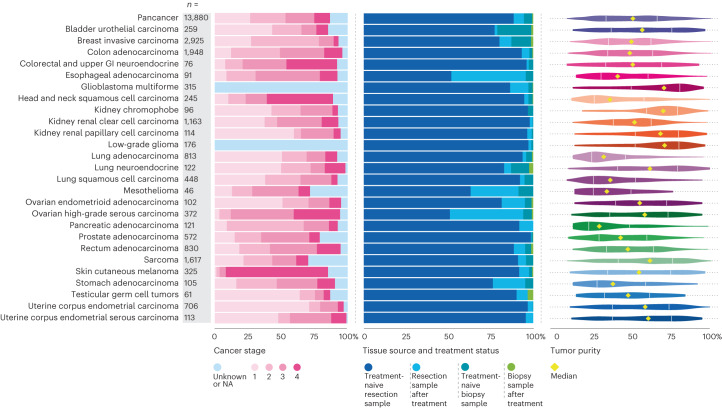
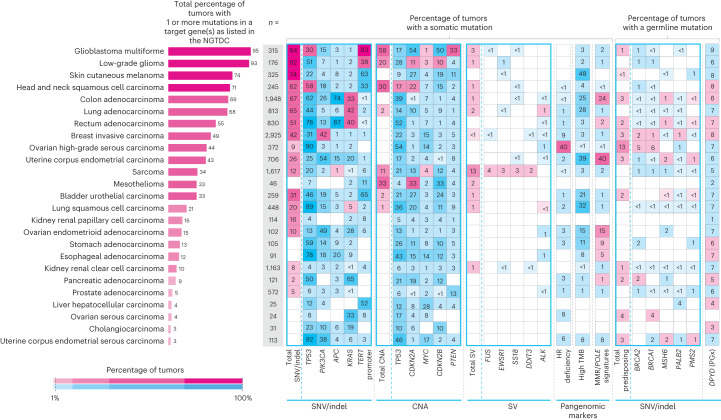
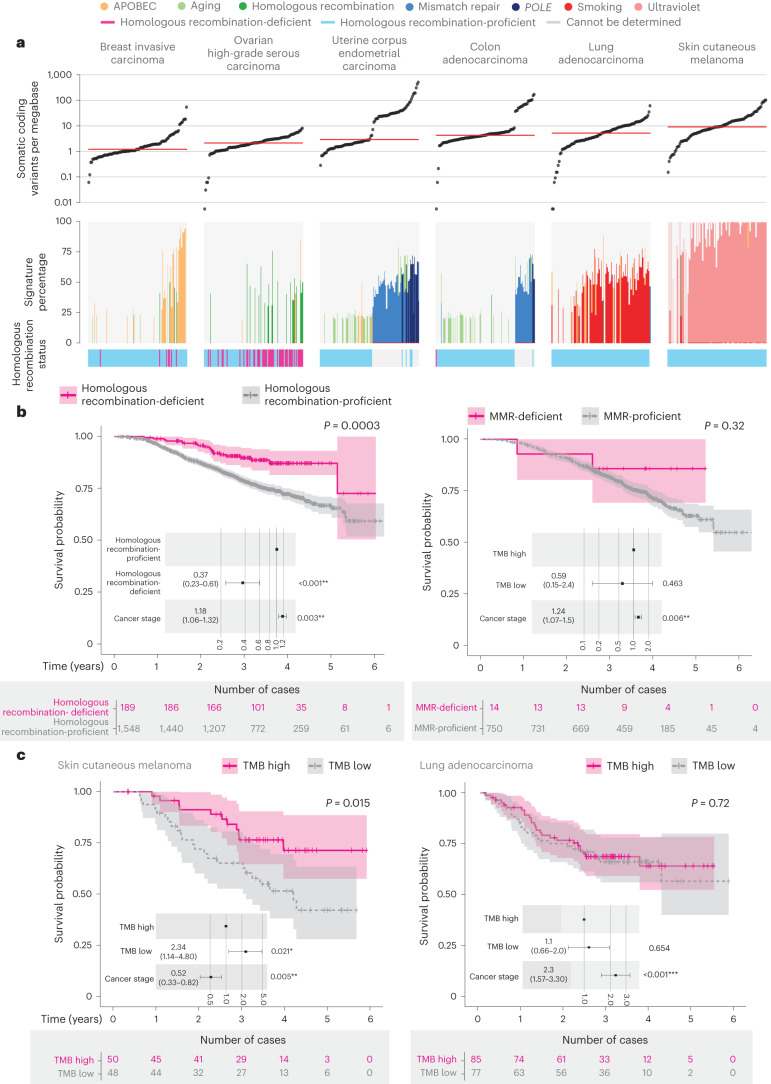
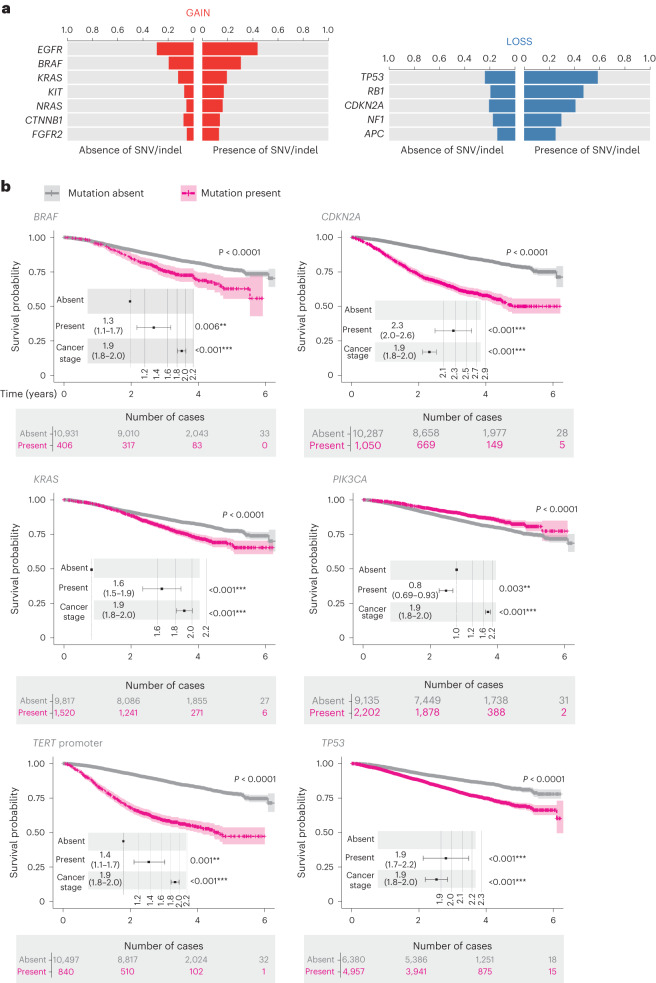
The Cancer Programme of the 100,000 Genomes Project was an initiative to provide whole-genome sequencing (WGS) for patients with cancer, evaluating opportunities for precision cancer care within the UK National Healthcare System (NHS). Genomics England, alongside NHS England, analyzed WGS data from 13,880 solid tumors spanning 33 cancer types, integrating genomic data with real-world treatment and outcome data, within a secure Research Environment. Incidence of somatic mutations in genes recommended for standard-of-care testing varied across cancer types. For instance, in glioblastoma multiforme, small variants were present in 94% of cases and copy number aberrations in at least one gene in 58% of cases, while sarcoma demonstrated the highest occurrence of actionable structural variants (13%). Homologous recombination deficiency was identified in 40% of high-grade serous ovarian cancer cases with 30% linked to pathogenic germline variants, highlighting the value of combined somatic and germline analysis. The linkage of WGS and longitudinal life course clinical data allowed the assessment of treatment outcomes for patients stratified according to pangenomic markers. Our findings demonstrate the utility of linking genomic and real-world clinical data to enable survival analysis to identify cancer genes that affect prognosis and advance our understanding of how cancer genomics impacts patient outcomes.


Conflict of interest statement

Genomics England is a company wholly owned by the UK DHSC and was created in 2013 to introduce WGS into healthcare in conjunction with NHS England. All authors affiliated with Genomics England (A. Sosinsky, J.A., C.T., S. Henderson, L.J., A.H., P.A., G.C., J.M., S.W., K.B., D.P., M.B.P., N.V., A.R.-M., D.P.-G., J.L., J.P., A. Siddiq, T.Z., T.C., O.Y., T.F., A.R., M.C. and N.M.) are, or were, salaried by or seconded to Genomics England. D.B. and C.K. are full-time employees and shareholders of Illumina. A.H. has received speaker fees from Gilead, Roche, Pfizer, Jazz, AbbVie, Incyte and Astellas. N.M. has provided consulting and advisory support for Pfizer, Guardant, Seagen and Janssen, and received speaker fees from Novartis, Pfizer and Servier outside of the submitted work. The remaining authors declare no competing interests.

Figures

Fig. 1
Fig. 1. Overview of the 100,000 Genomes Cancer Programme.
a, Journey of the patient’s genome. Patients provided written informed consent for paired tumor and normal (germline) WGS analysis. DNA was extracted from tumor and normal (blood) samples using standardized protocols and samples were submitted for WGS, which was performed on an Illumina sequencer. An automated pipeline was constructed for sequence quality control, alignment, variant calling and interpretation, with results returned to the 13 NHS Genomic Medicine Centers for review in regional GTABs. b, Linked genomic and real-world clinical datasets. In the 100,000 Genomes Project, participants are followed over their life course using electronic health records (all hospital episodes, cancer registration entries, systemic anticancer therapies and cause of death). c, Infinity loop representing the link between healthcare and research in genomics.
Fig. 2
Fig. 2. Overview of the 100,000 Genomes Cancer Programme cohort demographics.
a, Distribution of 12,948 cases represented by 33 tumor types (cases with more than one sample per tumor were only counted once). b, Thirteen NHS GMCs recruited patients diagnosed with cancer across England. The area of the pie chart is proportional to the number of patients recruited; the total number of participants recruited per GMC is indicated in parentheses. Map source: Office for National Statistics licensed under the Open Government Licence v.3.0. c, Breakdown of biological sex and age at diagnosis according to disease. The age plot shows the interquartile range (IQR) and median values.
Fig. 3
Fig. 3. Overview of the sample characteristics for the 100,000 Genomes Cancer Programme cohort.
Breakdown according to the stage of the disease (left) (NA, not available or not applicable in the context of glioblastoma multiforme and low-grade glioma), type of sample obtained (middle) and tumor purity (right) for each tumor type; the IQR and median values are shown.
Fig. 4
Fig. 4. Somatic and germline alterations across common tumor types.
Prevalence of different types of mutations identified using WGS in genes indicated for testing in the NGTDC. The leftmost panel indicates the total percentage of cases harboring one or more genomic alterations of clinical relevance as listed in the NGTDC (where the number of cancers sequenced is ten or more). In the subsequent panels, somatic variants (from left to right) consisting of small variants (SNVs, indels), CNAs, SVs, HRD, MMR signatures and TMB along with germline variants related to inherited cancer risk (predisposing genes) and pharmacogenomic (PGx) findings (toxicity-associated DPYD variants) are shown. The top five genes with the most prevalent mutation rates for each mutation type are shown (see Extended Data Fig. 1 for the full analysis). The percentage of tumors harboring a specific type of mutation in the gene(s) indicated for testing according to tumor type in the NGTDC are shown in magenta. Mutation incidence (as a percentage) in other tumor types, not currently indicated in the NGTDC, is shown in blue. Color gradation reflects the percentage of affected cases.
Fig. 5
Fig. 5. Predictive value of pangenomic markers derived from WGS data.
a, Distribution of TMB and mutational signatures across six tumor types. (Samples that underwent PCR amplification during library preparation were excluded and the dataset for each tumor type was downsampled to 100 samples.) The horizontal red bar indicates the median TMB for each cancer type. Etiology definitions based on COSMIC (v.3) single-base substitution signatures: APOBEC activity, signatures 2 and 13; aging, signature 1; HRD, signature 3; MMR deficiency, signatures 6, 15, 20, 21, 26 and 44; POLE mutations, signatures 10a, 10b and 14; smoking, signatures 4 and 92; ultraviolet exposure, signatures 7a–d. Only signatures with more than 20% contribution are shown. Homologous recombination status is indicated in the bars below the signature plots. b,c, Kaplan–Meier estimates of overall survival with P values calculated using a stratified log-rank test. The numbers of patients at risk at different time points are indicated below the survival curves. The points and error bars on the embedded forest plots indicate the hazard ratios (HRs) with 95% confidence intervals (CIs), correspondingly. HRs, CIs and P values were calculated from Cox proportional-hazards models corrected according to cancer stage. Patients were stratified according to HRD status in cancers treated with platinum chemotherapy (n = 1,737, left, b); according to MMR signatures in cancers treated with immunotherapies (n = 764, right, b); according to high and low TMB in skin cutaneous melanoma (n = 98, left, c); and according to lung adenocarcinoma (n = 162, right, c). Exact P values can be found in Supplementary Table 2.
Fig. 6
Fig. 6. Prognostic value of small variants and CNAs from WGS data.
a, Co-occurrence of CNAs and small variants in clinically actionable genes. The bars represent the proportion of cases with CNA in the subset of cases with or without small variants (SNV or small indels) in clinically actionable genes. Oncogenes and tumor suppressor genes were tested for gain (red) or loss (blue) of at least one copy of the corresponding gene, respectively. b, Kaplan–Meier estimates of overall survival with P values calculated using a stratified log-rank test. The numbers of patients at risk at different time points are indicated below the survival curves. Points and error bars on the embedded forest plots indicate HRs with 95% CIs, correspondingly. HRs, CIs and P values were calculated from Cox proportional-hazards models corrected according to cancer stage. Patients were stratified according to the mutational status of genes indicated for testing in NGTDC across all cancer types (n = 11,337). Exact P values can be found in Supplementary Table 2.
Extended Data Fig. 2
Extended Data Fig. 2. Distribution of tumor mutation burden (TMB) and mutational signatures across tumor types.
Assignment of signatures to known etiologies matches Fig. 3.
Extended Data Fig. 3
Extended Data Fig. 3. Kaplan-Meier estimates of overall survival with p-values calculated using a stratified log-rank test.
Numbers of patients at risk at different time points are indicated below the survival curves. Points and error bars on the embedded forest plots indicate hazard ratios (HR) with 95% confidence intervals (CI), correspondingly. HR, CI and p-values are calculated from cox proportional hazards models corrected by cancer stage. Patients are stratified by mutational status of genes indicated for testing in NGTDC across all cancer types (n = 11337). Exact p-values can be found in Supplementary Table S2.

References

    1. Cancer Incidence Statistics. Cancer Research UKwww.cancerresearchuk.org/health-professional/cancer-statistics/incidence (undated).
    1. Zehir, A. et al. Mutational landscape of metastatic cancer revealed from prospective clinical sequencing of 10,000 patients. Nat. Med.23, 703–713 (2017). 10.1038/nm.4333 - DOI - PMC - PubMed
    1. Smedley, D. et al. 100,000 Genomes Pilot on Rare Disease Diagnosis in Health Care—preliminary report. N. Engl. J. Med.385, 1868–1880 (2021). 10.1056/NEJMoa2035790 - DOI - PMC - PubMed
    1. Turnbull, C. et al. The 100 000 Genomes Project: bringing whole genome sequencing to the NHS. BMJ361, k1687 (2018). 10.1136/bmj.k1687 - DOI - PubMed
    1. Turnbull, C. Introducing whole-genome sequencing into routine cancer care: the Genomics England 100 000 Genomes Project. Ann. Oncol.29, 784–787 (2018). 10.1093/annonc/mdy054 - DOI - PubMed