. 2024 Jan;4(1):145-162.
doi: 10.1038/s43587-023-00552-5. Epub 2024 Jan 10.

A single-cell atlas of the aging mouse ovary

Affiliations

A single-cell atlas of the aging mouse ovary

José V V Isola et al. Nat Aging. 2024 Jan.

Abstract

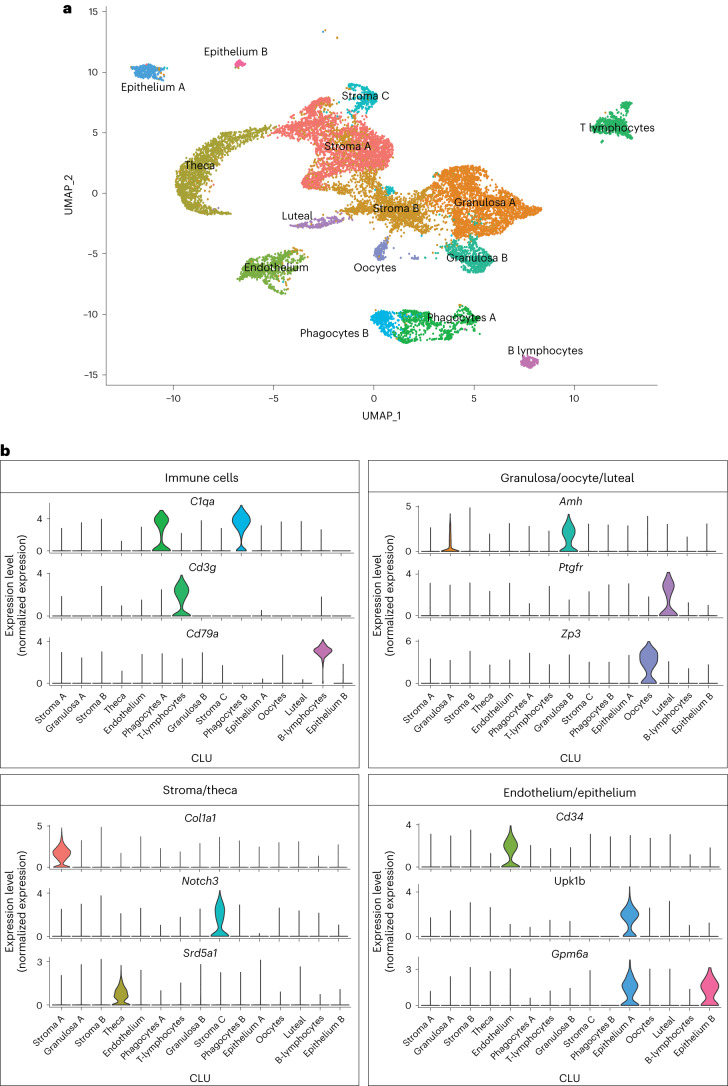
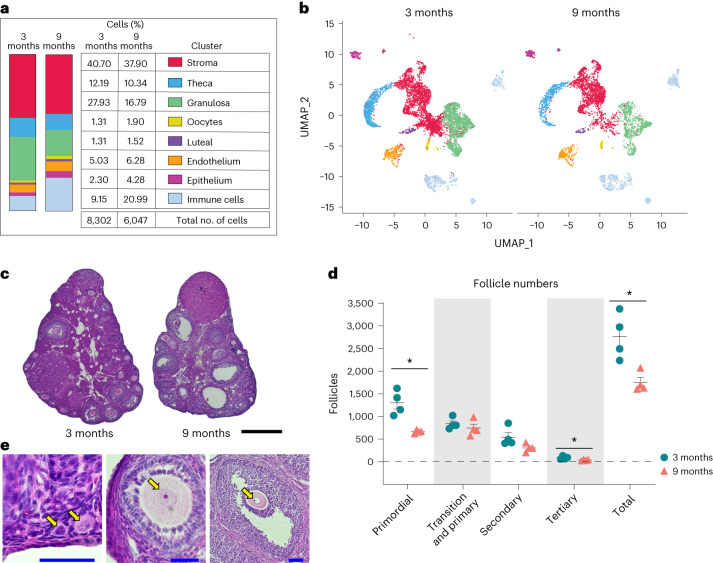
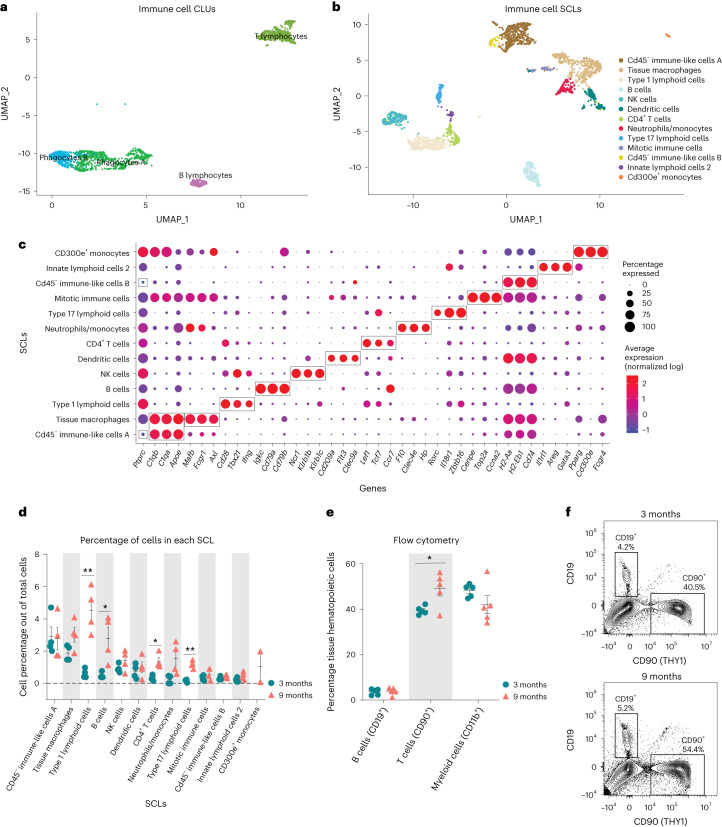
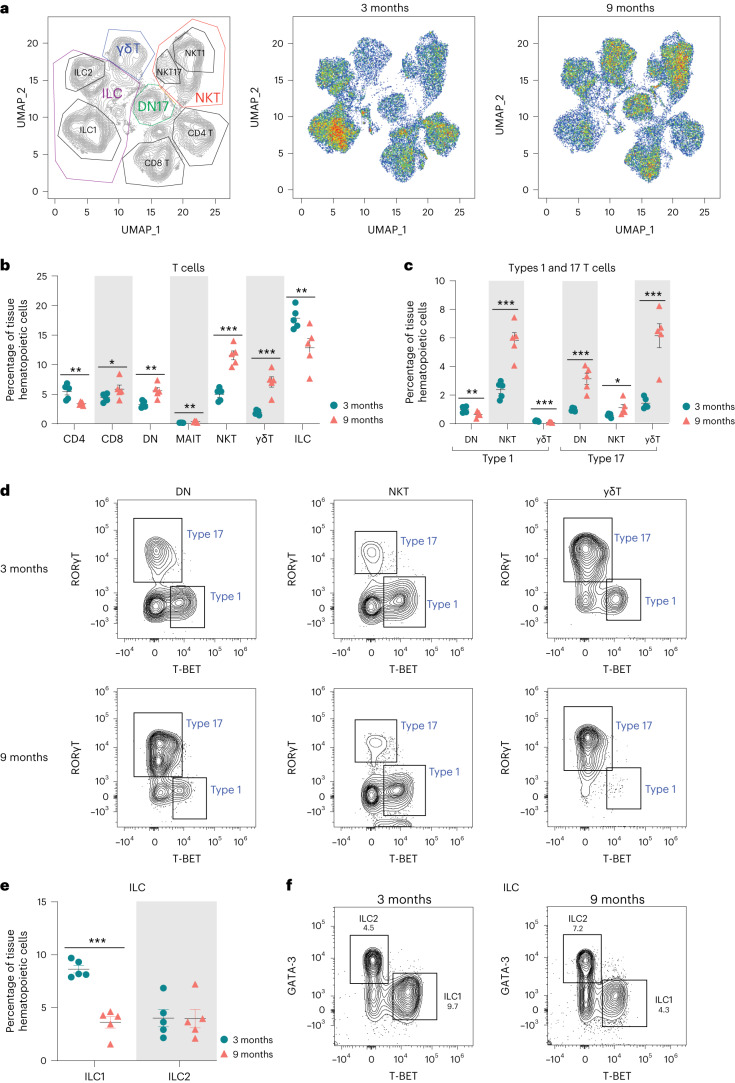
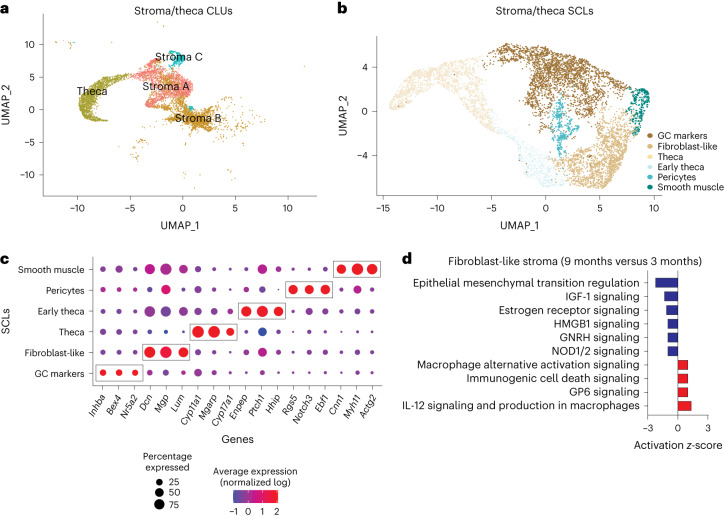
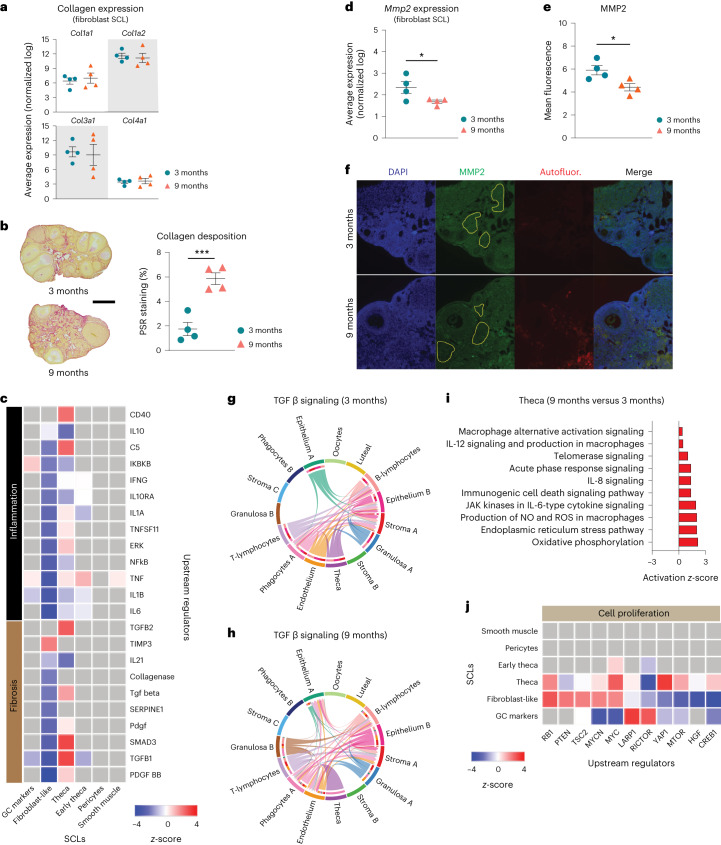
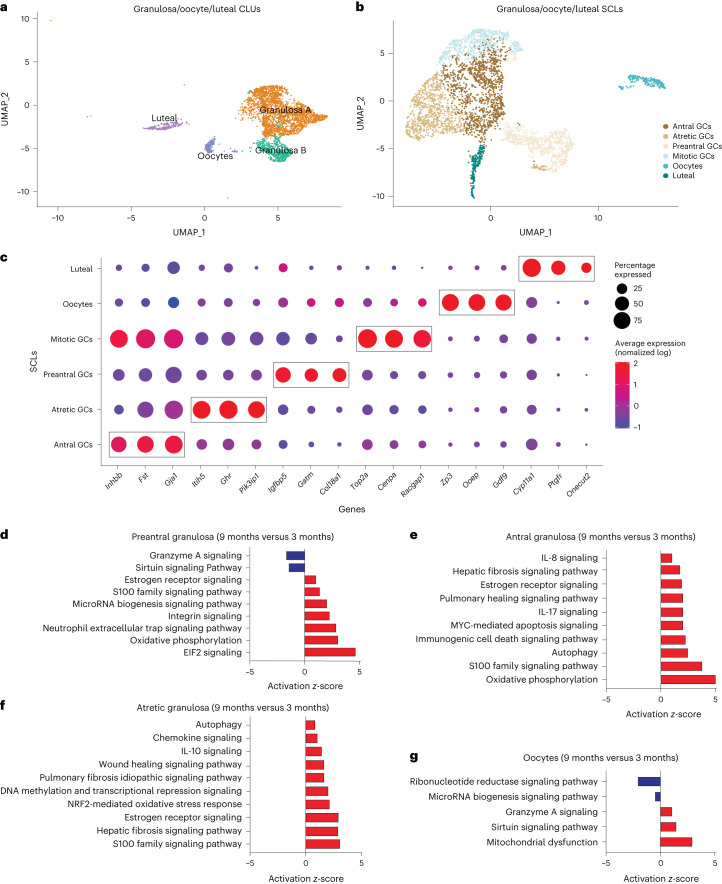
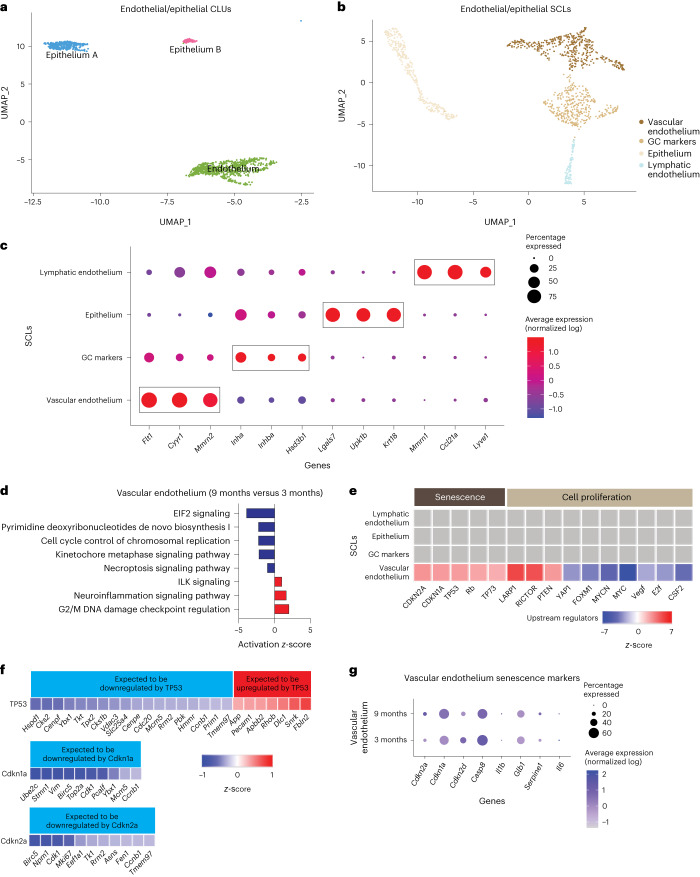
Ovarian aging leads to diminished fertility, dysregulated endocrine signaling and increased chronic disease burden. These effects begin to emerge long before follicular exhaustion. Female humans experience a sharp decline in fertility around 35 years of age, which corresponds to declines in oocyte quality. Despite a growing body of work, the field lacks a comprehensive cellular map of the transcriptomic changes in the aging mouse ovary to identify early drivers of ovarian decline. To fill this gap we performed single-cell RNA sequencing on ovarian tissue from young (3-month-old) and reproductively aged (9-month-old) mice. Our analysis revealed a doubling of immune cells in the aged ovary, with lymphocyte proportions increasing the most, which was confirmed by flow cytometry. We also found an age-related downregulation of collagenase pathways in stromal fibroblasts, which corresponds to rises in ovarian fibrosis. Follicular cells displayed stress-response, immunogenic and fibrotic signaling pathway inductions with aging. This report provides critical insights into mechanisms responsible for ovarian aging phenotypes. The data can be explored interactively via a Shiny-based web application.


Conflict of interest statement

The authors declare no competing interests.

Figures

Fig. 1
Fig. 1. scRNA-seq of the mouse ovary.
a,b, Whole-ovarian tissue was collected from 3- and 9-month-old C57BL/6 J mice and processed for 10X Genomics 3′ scRNA-seq. a, UMAP plot of age-combined ovarian cells. Clustering analysis revealed 15 distinct ovarian cell populations. b, Violin plots of specific marker genes for each ovarian cell type. scRNA-seq was performed in n = 4 ovaries per age group.
Fig. 2
Fig. 2. Age-related changes in ovarian cell populations.
a, Numbers and percentages of cells in broad categories of cell type identity, by age. b, UMAP plot of ovarian cells, by age (color coding as in a). c, Representative images of H&E-stained ovaries. H&E staining and follicle counting were repeated for each biological replicate. Scale bar, 500 µm. d, Estimated numbers of follicles in 3- and 9-month-old ovaries. e, Representative images of follicles stained by H&E. Arrows (from left to right) indicate primordial, primary, secondary and tertiary follicles, respectively. Scale bars, 50 µm. Data presented as mean ± s.e.m. *FDR < 0.05, **FDR = 0.01, ***FDR = 0.005 by multiple two-tailed t-test with Benjamini, Krieger and Yekutieli correction for multiple comparisons. scRNA-seq was performed in n = 4 ovaries per age group. Exact P values shown in Source Data. Source data
Fig. 3
Fig. 3. Immune cells accumulate in the ovary with age.
a, UMAP of immune CLUs selected for subclustering analyses. b, UMAP of immune SCLs. c, Dot plot of markers used for SCL cell type identification. d, Percentages of cells in each immune SCL out of total cells. e, Percentages of immune cells out of tissue hematopoietic cells (following gating out of intravascular hematopoietic cells) by flow cytometry. f, Representative gating of CD19+ and CD90+ cells following gating out of tissue hematopoietic cells (intravascular CD45, CD45+) in young and aged ovaries (see Supplementary Fig. 4a for complete gating strategy). For flow cytometry, six ovaries from mice in the same phase of estrous cycle were pooled (n = 5 per age group). scRNA-seq was performed in n = 4 ovaries per age group. Data presented as mean ± s.e.m. *FDR < 0.05, **FDR = 0.01, ***FDR = 0.005 by multiple two-tailed t-test with Benjamini, Krieger and Yekutieli correction for multiple comparisons. Exact P values given in Source Data. THY1, Thy-1 cell surface antigen. Source data
Fig. 4
Fig. 4. Lymphocyte populations are altered in the aged ovary.
a, UMAP of flow cytometry panel of lymphoid cells, annotated using conventional gating strategies. The number of cells plotted was normalized to better observe differences in population distribution. b, Percentage of T cell subpopulations out of tissue hematopoietic cells. c, Percentage of Types 1 and 17 T cells out of tissue hematopoietic cells. d, Representative gating of Types 1 and 17 lymphoid cells in young and aged ovaries. e, Percentages of ICL1 and ILC2 out of tissue hematopoietic cells. f, Representative gating of innate lymphoid cells in young and aged ovaries. For flow cytometry, six ovaries from mice in the estrous cycle stage were pooled (n = 5 per age group). Data presented as mean ± s.e.m. *FDR < 0.05, **FDR = 0.01, ***FDR = 0.005 by multiple two-tailed t-test with Benjamini, Krieger and Yekutieli correction for multiple comparisons. Exact P values are given in Source Data. Source data
Fig. 5
Fig. 5. Subclustering of stroma and TCs.
a, UMAP of stroma and TC CLUs used for subclustering. b, UMAP of stroma and TC SCLs. c, Dot plot of markers used for SCL cell type identification. d, IPA canonical pathways indicating activation or inhibition of specific pathways by aging in stromal fibroblast-like cells. scRNA-seq was performed in n = 4 ovaries per age group.
Fig. 6
Fig. 6. Biological significance of altered pathways in ovarian stroma and theca SCLs.
a, Expression of collagen genes in the fibroblast-like stroma SCL does not change with age. b, Picrosirius red (PSR) staining of collagen deposition in 3- and 9-month-old ovaries. Scale bar, 500 µm. c, IPA upstream regulator analyses of age-related changes in stroma and TC SCLs (9 versus 3 months old, z-score) related to inflammation and fibrosis. d, Expression of Mmp2 gene in fibroblast-like stroma decreases with age. e, MMP2 protein is decreased in aged ovarian stroma, as shown by immunofluorescence. f, Representative immunofluorescence images of MMP2 (green), DAPI (blue) and autofluorescence (red). Yellow-bordered areas represent stromal regions analyzed, avoiding follicles and autofluorescent regions. This assay was repeated independently for each biological replicate. g,h, CellChat chord diagrams of TGFβ signaling pathway interactions in 3-month (g) and 9-month ovarian CLUs (h). i, IPA canonical pathways indicating activation of specific pathways by aging in TCs. j, IPA upstream regulator analyses of age-related changes in stroma and TC SCLs (9 versus 3 months old, z-score) related to cell proliferation (n = 5 per age group). scRNA-seq was performed in n = 4 ovaries per age group. Data presented as mean ± s.e.m. *FDR< 0.05, **FDR = 0.01, ***FDR = 0.005 by one-tailed t-test (a,b) or two-tailed t-test (d,e). ROS, reactive oxygen species. Exact P values shown in Source Data. Source data
Fig. 7
Fig. 7. Subclustering of GCs, oocytes and luteal cells.
a, UMAP of granulosa, oocyte and luteal cell CLUs used for subclustering. b, UMAP of granulosa, oocyte and luteal SCLs. c, Dot plot of markers used for SCL cell type identification. dg, Z-scores indicating activation or inhibition of pathways during aging by IPA analysis in preantral GCs (d), antral GCs (e), atretic GCs (f) and oocytes (g). scRNA-seq was performed in n = 4 ovaries per age group.
Fig. 8
Fig. 8. Subclustering of endothelial and epithelial cells.
a, UMAP of endothelial and epithelial CLUs used for subclustering. b, UMAP of endothelial and epithelial SCLs. c, Dot plot of markers used for SCL cell type identification. d, Z-scores indicating activation or inhibition of pathways altered with aging, as evidenced by IPA analysis, in vascular endothelial cells. e, Z-scores indicating activation or inhibition of upstream regulators during aging, as evidenced by IPA analysis, in endothelial and epithelial SCLs. f, Z-scores indicating up- or downregulation of genes by genes TP35, Cdkn1a and Cdkn2a. g, Dot plot showing expression of cell senescence markers in vascular endothelial cells in 3- and 9-month-old ovaries. scRNA-seq was performed in n = 4 ovaries per age group.

Update of

References

    1. Johnson JA, Tough S. No-271-delayed child-bearing. J. Obstet. Gynaecol. Can. 2017;39:e500–e515. doi: 10.1016/j.jogc.2017.09.007. - DOI - PubMed
    1. Broekmans FJ, Soules MR, Fauser BC. Ovarian aging: mechanisms and clinical consequences. Endocr. Rev. 2009;30:465–493. doi: 10.1210/er.2009-0006. - DOI - PubMed
    1. Levine ME, et al. Menopause accelerates biological aging. Proc. Natl Acad. Sci. USA. 2016;113:9327–9332. doi: 10.1073/pnas.1604558113. - DOI - PMC - PubMed
    1. Wellons M, Ouyang P, Schreiner PJ, Herrington DM, Vaidya D. Early menopause predicts future coronary heart disease and stroke: the Multi-Ethnic Study of Atherosclerosis. Menopause. 2012;19:1081–1087. doi: 10.1097/gme.0b013e3182517bd0. - DOI - PMC - PubMed
    1. Tchernof A, Calles-Escandon J, Sites CK, Poehlman ET. Menopause, central body fatness, and insulin resistance: effects of hormone-replacement therapy. Coron. Artery Dis. 1998;9:503–511. doi: 10.1097/00019501-199809080-00006. - DOI - PubMed