. 2024 Jan;625(7994):329-337.
doi: 10.1038/s41586-023-06862-3. Epub 2024 Jan 10.

100 ancient genomes show repeated population turnovers in Neolithic Denmark

Morten E Allentoft #  1   2 Martin Sikora #  3 Anders Fischer #  4   5 Karl-Göran Sjögren  6 Andrés Ingason  7   8 Ruairidh Macleod  7   9   10 Anders Rosengren  7   8 Bettina Schulz Paulsson  4 Marie Louise Schjellerup Jørkov  11 Maria Novosolov  7 Jesper Stenderup  7 T Douglas Price  12 Morten Fischer Mortensen  13 Anne Birgitte Nielsen  14 Mikkel Ulfeldt Hede  15 Lasse Sørensen  13 Poul Otto Nielsen  13 Peter Rasmussen  13 Theis Zetner Trolle Jensen  16 Alba Refoyo-Martínez  7 Evan K Irving-Pease  7 William Barrie  9   17 Alice Pearson  9   17 Bárbara Sousa da Mota  18   19 Fabrice Demeter  7   20 Rasmus A Henriksen  7 Tharsika Vimala  7 Hugh McColl  7 Andrew Vaughn  21 Lasse Vinner  7 Gabriel Renaud  22 Aaron Stern  21 Niels Nørkjær Johannsen  23 Abigail Daisy Ramsøe  7 Andrew Joseph Schork  11   24 Anthony Ruter  7 Anne Birgitte Gotfredsen  16 Bjarne Henning Nielsen  25 Erik Brinch Petersen  26 Esben Kannegaard  27 Jesper Hansen  28 Kristoffer Buck Pedersen  29 Lisbeth Pedersen  30 Lutz Klassen  27 Morten Meldgaard  7   31 Morten Johansen  32 Otto Christian Uldum  32 Per Lotz  33   34 Per Lysdahl  35 Pernille Bangsgaard  16 Peter Vang Petersen  13 Rikke Maring  23   27 Rune Iversen  26 Sidsel Wåhlin  35 Søren Anker Sørensen  33 Søren H Andersen  36 Thomas Jørgensen  33 Niels Lynnerup  37 Daniel J Lawson  38 Simon Rasmussen  39 Thorfinn Sand Korneliussen  7 Kurt H Kjær  7 Richard Durbin  17   40 Rasmus Nielsen  7   41 Olivier Delaneau  18   19 Thomas Werge  7   8   42 Kristian Kristiansen  7   6 Eske Willerslev  43   44   45
Affiliations

100 ancient genomes show repeated population turnovers in Neolithic Denmark

Morten E Allentoft et al. Nature. 2024 Jan.

Abstract

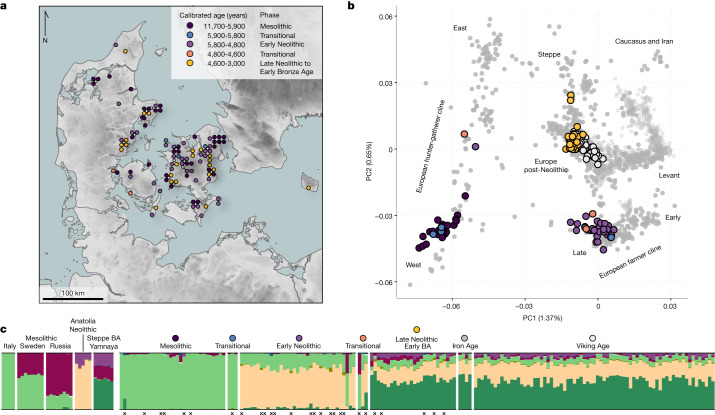
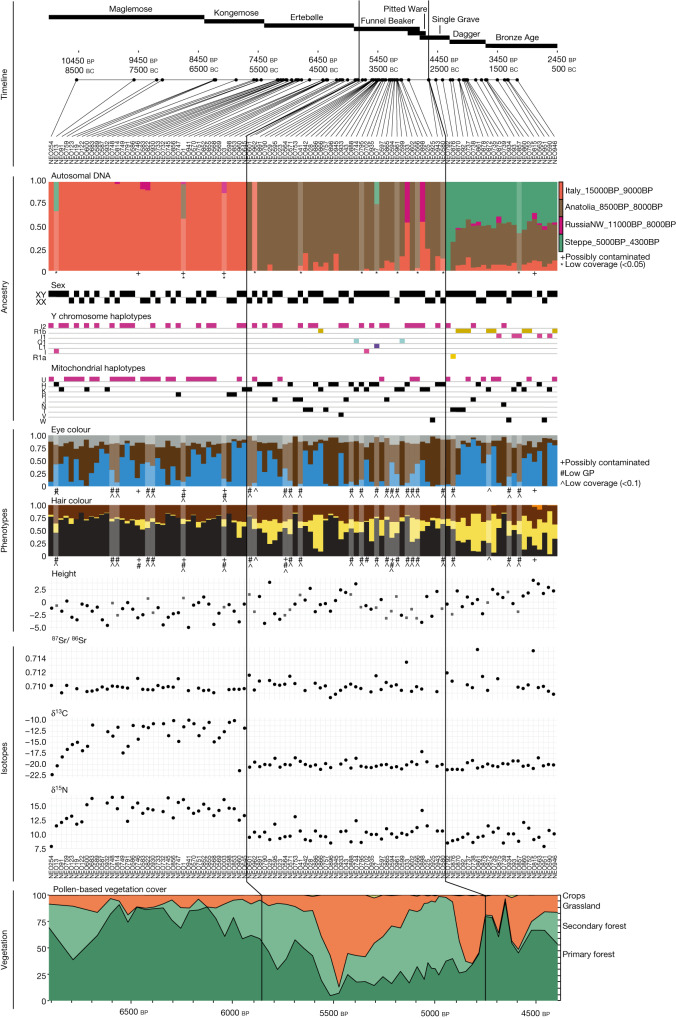
Major migration events in Holocene Eurasia have been characterized genetically at broad regional scales1-4. However, insights into the population dynamics in the contact zones are hampered by a lack of ancient genomic data sampled at high spatiotemporal resolution5-7. Here, to address this, we analysed shotgun-sequenced genomes from 100 skeletons spanning 7,300 years of the Mesolithic period, Neolithic period and Early Bronze Age in Denmark and integrated these with proxies for diet (13C and 15N content), mobility (87Sr/86Sr ratio) and vegetation cover (pollen). We observe that Danish Mesolithic individuals of the Maglemose, Kongemose and Ertebølle cultures form a distinct genetic cluster related to other Western European hunter-gatherers. Despite shifts in material culture they displayed genetic homogeneity from around 10,500 to 5,900 calibrated years before present, when Neolithic farmers with Anatolian-derived ancestry arrived. Although the Neolithic transition was delayed by more than a millennium relative to Central Europe, it was very abrupt and resulted in a population turnover with limited genetic contribution from local hunter-gatherers. The succeeding Neolithic population, associated with the Funnel Beaker culture, persisted for only about 1,000 years before immigrants with eastern Steppe-derived ancestry arrived. This second and equally rapid population replacement gave rise to the Single Grave culture with an ancestry profile more similar to present-day Danes. In our multiproxy dataset, these major demographic events are manifested as parallel shifts in genotype, phenotype, diet and land use.


Conflict of interest statement

The authors declare no competing interests.

Figures

Fig. 1
Fig. 1. Overview of dataset.
a, Geographic locations and age ranges relating to the 100 sequenced genomes from Denmark. Groupings are designated through a combination of chronology, culture, and ancestry (see Supplementary Notes 1 and 3). b, PCA for 179 ancient Danish individuals (Supplementary Data 3) ranging from the Mesolithic to the Viking Age, including previously published ones,,,, in the context of broader West Eurasian genetic diversity (n = 983 modern individuals, open grey circles; n = 1,105 ancient individuals, filled grey circles). Ancient individuals from Denmark are coloured according to the period as defined in a and c. c, Unsupervised model-based clustering (ADMIXTURE) for K = 8 ancestry components in Danish individuals, as well as contextual data from selected groups (left) that represent relevant ancestry components. See Extended Data Fig. 1 for individual labels. Black crosses indicate low-coverage genomes represented by pseudo-haploid genotypes. BA, Bronze Age.
Fig. 2
Fig. 2. Identity-by-descent sharing patterns in ancient Danish individuals from circa 10,500–3000 cal. BP.
Heat map showing relative IBD-sharing rate of 72 imputed ancient individuals from Denmark (n = 67 individuals reported in this Article, n = 5 previously published individuals,,,) from the Mesolithic to the Bronze Age with selected genetic clusters. Individuals are grouped by their genetic cluster membership. See Supplementary Data 3 for dataset and ancestry category definition.
Fig. 3
Fig. 3. Genetic, phenotypic, dietary and environmental shifts in Denmark through time.
Evidence of two population turnovers in chronologically sorted multiproxy data from 100 Danish Mesolithic, Neolithic and Early Bronze Age skeletons (Supplement Data 1). The figure shows concomitant changes in (from the top) admixture proportions in non-imputed genome-wide data, Y chromosomal and mitochondrial haplogroups, genetic phenotype predictions (based on imputed data) and 87Sr/86Sr and δ13C and δ15N isotope data as proxies for mobility and diet, respectively. Predicted height values represent differences (in cm) from the average height of the present-day Danish population; probabilities for the hair colours (blond, brown, black and red) and eye colours (blue and brown) are shown, with grey denoting probability of intermediate eye colour (including grey, green and hazel). Lower panel shows the quantitative changes in vegetation cover, based on pollen analyses at Lake Højby in Zealand. Note that the vegetation panel covers a shorter time interval than the other panels. Black vertical lines mark the first presence of Anatolian Neolithic farmer ancestry and Steppe-related ancestry, respectively. Individuals with low genomic coverage, signs of possible contamination and/or low genotype prediction score (GP) are indicated (Methods).
Fig. 4
Fig. 4. Genetic legacy of ancient Danish individuals.
PCA of 2,000 modern Danish genomes from the iPSYCH study in the context of ancient western Eurasian individuals. Coloured symbols indicate sample age for ancient Danish individuals, whereas grey symbols indicate 1,145 ancient imputed individuals from across Western Eurasia. Modern Danish individuals are indicated by black filled circles and are shown on the right. Inset, a magnified view of the cluster with modern Danes. The colour scale in the inset represents the age range of the ancient samples within the magnified region only.
Extended Data Fig. 1
Extended Data Fig. 1. Model-based clustering.
Unsupervised model-based clustering results (ADMIXTURE) for K = 2 to K = 15 assumed components for all published shotgun-sequenced ancient individuals from Denmark - including the herein presented 93 genomes (contamination <5% and close relative pairs excluded). Imputed genomes were used where available. For low-coverage individuals (indicated with black cross) pseudo-haploid genotypes were used.
Extended Data Fig. 2
Extended Data Fig. 2. Allele sharing of Danish Mesolithic individuals.
a, D-statistic testing whether Danish Mesolithic individuals form a clade with the earliest Danish Mesolithic individual in the dataset (NEO254, Koelbjerg Man) to the exclusion of a genetic cluster of Mesolithic hunter-gatherer individuals from Sweden (Sweden_10000BP_7500BP). b, D-statistic testing whether Danish Mesolithic individuals form a clade with a genetic cluster of Western European HG individuals (EuropeW_13500BP_8000BP) to the exclusion of a genetic cluster of Eastern European HG individuals (RussiaNW_11000BP_8000BP). Error bars indicate three standard errors.
Extended Data Fig. 3
Extended Data Fig. 3. IBD sharing among ancient individuals from Denmark.
Heatmap showing pairwise amount of total length of IBD shared between 72 ancient Danish individuals dated to older than 3,000 cal. BP. Colours in border and text indicate genetic cluster membership, and dendrograms show clustering hierarchy.
Extended Data Fig. 4
Extended Data Fig. 4. Genetic affinities of ancient individuals from Denmark.
Panels show principal component analyses based on pairwise IBD-sharing of a, 30 imputed Danish Mesolithic individuals in context of 105 European HGs (right panel shows Danish individuals coloured by age); b, 22 imputed Danish early Neolithic individuals within the context of 170 Anatolian and European Neolithic farmers c, 21 imputed Danish LNBA individuals within the context of 127 European LNBA individuals. Symbol colour and shape indicate the genetic cluster of an individual (Supplementary Data III). The extent of PCA positions of individuals from Denmark are indicated with a dotted line hull. Ancestry cluster categories defined in.
Extended Data Fig. 5
Extended Data Fig. 5. Dietary isotopic signatures.
δ13C and δ15N values in bone/dentine samples from 100 ancient Danish individuals, coloured according to their main genetic ancestry group. A fundamental dietary and genetic shift is observed at the transition from the Mesolithic to the Neolithic c. 5,900 cal. BP (dashed line). Four anomalous individuals are highlighted. Data from and Supplementary Data II.
Extended Data Fig. 6
Extended Data Fig. 6. Ancestry modelling of ancient individuals.
a, Heatmap of ancestry proportions for 72 ancient individuals from Denmark dated to older than 3,000 cal. BP estimated from supervised mixture models. Results for three different sets of ancestry source groups (deep, fEur, postNeol, Supplementary Data IV) are distinguished in facet rows. Genetic cluster membership for Danish target individuals is indicated by column facets. b, Spatial distribution of estimated ancestry proportions of three different HG sources for Neolithic farmer individuals from Scandinavia and Poland. c, Spatial distribution of estimated ancestry proportions of two different farmer sources for LNBA individuals from Scandinavia and Poland. d, Ancestry proportions for Scandinavian Iron Age and Viking Age individuals (postBA reference set). e, Ancestry proportions for selected ancient European individuals with ancestry related to Scandinavian LNBA individuals (source Scandinavia_4000BP_3000BP, postBA reference set, Supplementary Data IV).
Extended Data Fig. 7
Extended Data Fig. 7. Contrasting hunter-gatherer admixture dynamics in Neolithic farmer individuals from Denmark and Sweden.
a, Admixture time estimated using DATES as a function of age for Neolithic farmer individuals from Denmark (left) and Sweden (right). Pie charts indicate ancestry composition (light grey - farmer ancestry; dark grey - non-local hunter-gatherer ancestry; colour - local hunter-gatherer ancestry). b, Total amount of hunter-gatherer ancestry proportion as a function of admixture time for Neolithic farmer individuals from Denmark (left) and Sweden (right). Error bars indicate ± 1 standard error of admixture time estimate.
Extended Data Fig. 8
Extended Data Fig. 8. Fine-scale structure in late Neolithic and Early Bronze Age (LNBA) Scandinavians c. 4,500-3,000 cal. BP.
ae, Geographic locations and PCA based on pairwise IBD sharing (middle) of 148 European LNBA individuals predating 3,000 cal. BP (Supplementary Data IV). Geographic locations are shown for 65 individuals belonging to the five genetic clusters observed in 38 ancient Scandinavians (a,b, LNBA phase I; c,d, LNBA phase II; e, LNBA phase III; temporal sequence shown in timeline in centre of plot). Individual assignments and frequency distribution of major Y chromosome haplogroups are indicated in maps and timeline. Plot symbols with black circles indicate the 38 Scandinavian individuals in the PCA panels. Ancestry proportions for the 38 Scandinavian individuals estimated using proximal source groups from outside Scandinavia (postNeolScand source set) are shown on the right of the respective cluster results.

References

    1. Allentoft ME, et al. Population genomics of Bronze Age Eurasia. Nature. 2015;522:167–172. doi: 10.1038/nature14507. - DOI - PubMed
    1. Haak W, et al. Massive migration from the steppe was a source for Indo-European languages in Europe. Nature. 2015;522:207–211. doi: 10.1038/nature14317. - DOI - PMC - PubMed
    1. Allentoft, M. E. et al. Population genomics of post-glacial western Eurasia. Nature10.1038/s41586-023-06865-0 (2024). - PMC - PubMed
    1. Posth C, et al. Palaeogenomics of Upper Palaeolithic to Neolithic European hunter-gatherers. Nature. 2023;615:117–126. doi: 10.1038/s41586-023-05726-0. - DOI - PMC - PubMed
    1. Johannsen NN, Larson G, Meltzer DJ, Vander Linden M. A composite window into human history. Science. 2017;356:1118–1120. doi: 10.1126/science.aan0737. - DOI - PubMed

Supplementary concepts