. 2024 Jan;625(7995):585-592.
doi: 10.1038/s41586-023-06889-6. Epub 2024 Jan 10.

MRE11 liberates cGAS from nucleosome sequestration during tumorigenesis

Affiliations

MRE11 liberates cGAS from nucleosome sequestration during tumorigenesis

Min-Guk Cho et al. Nature. 2024 Jan.

Abstract

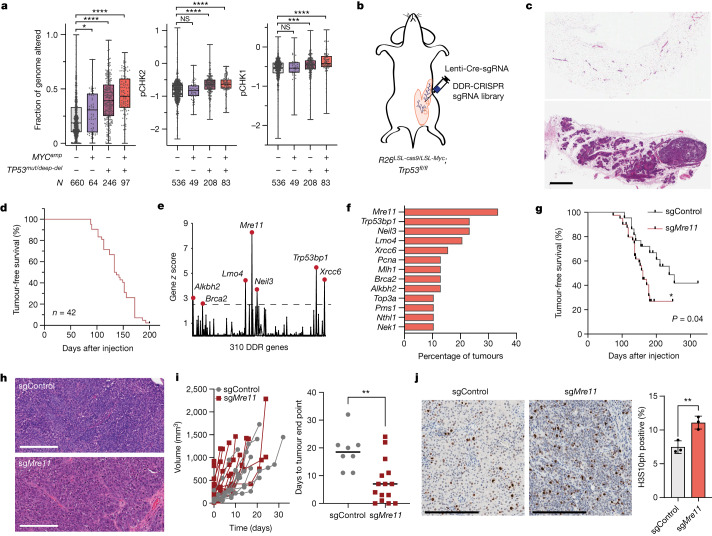
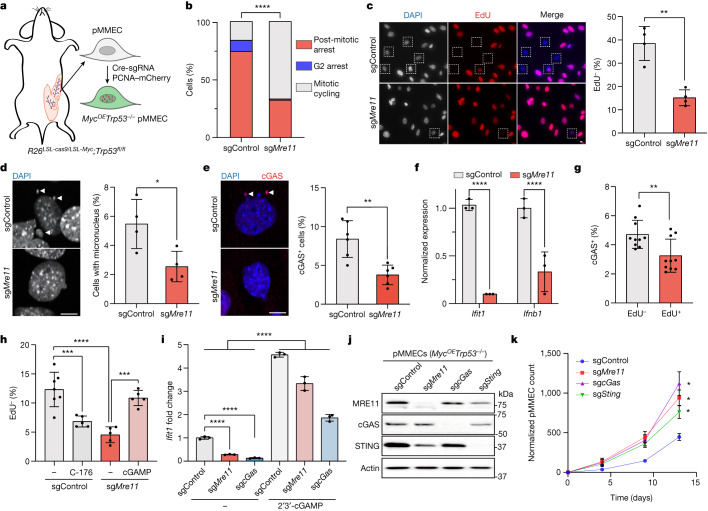
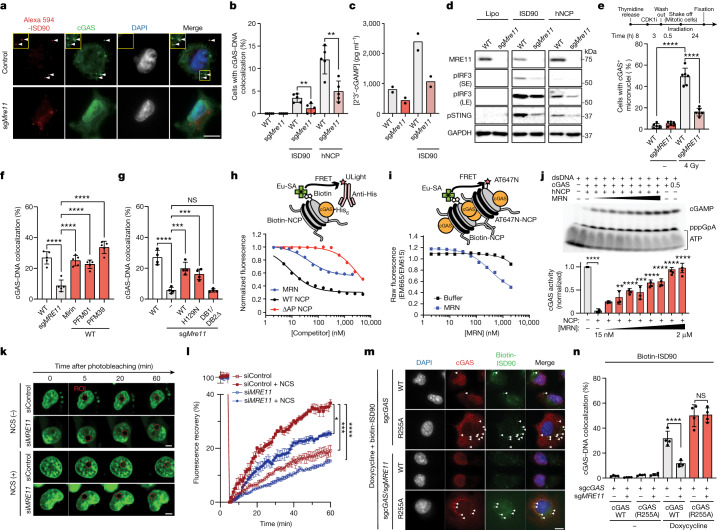
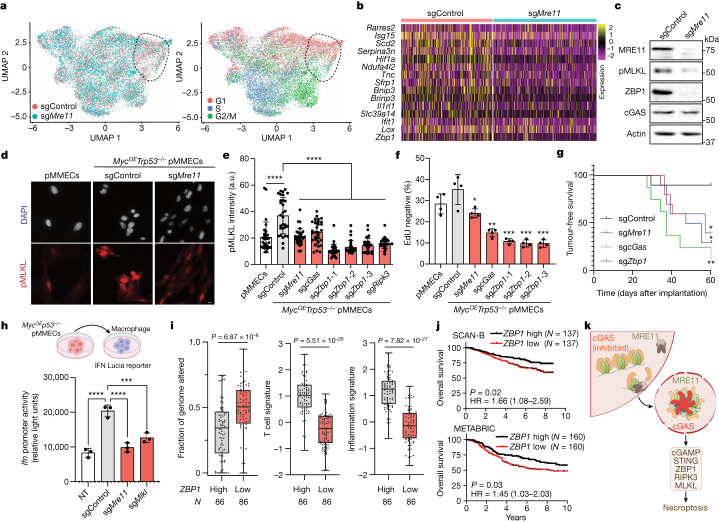
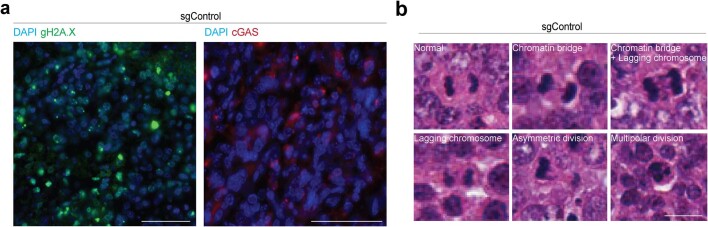
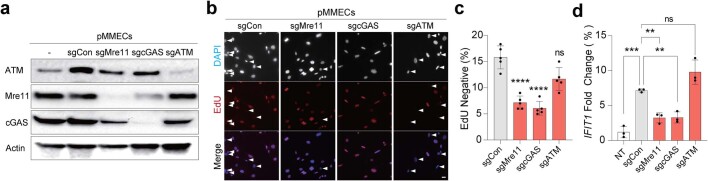
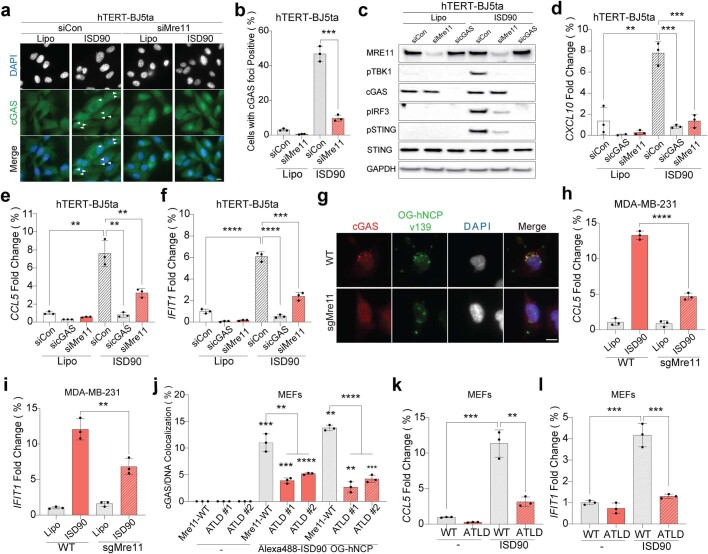
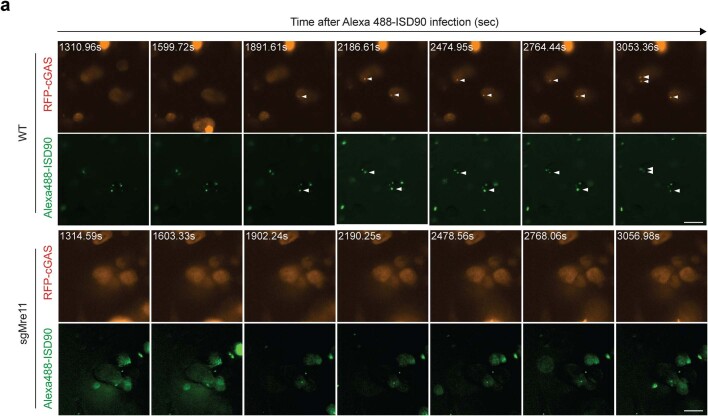
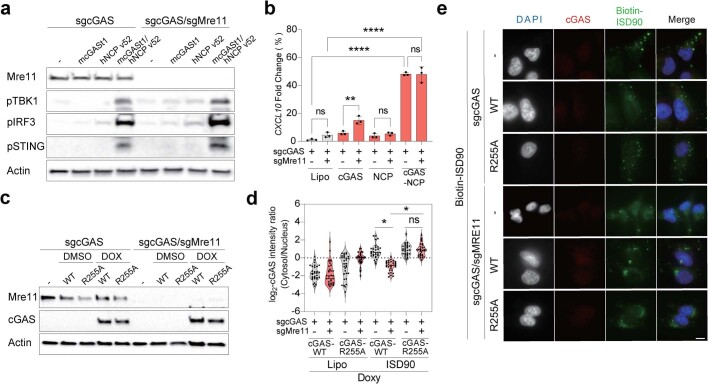
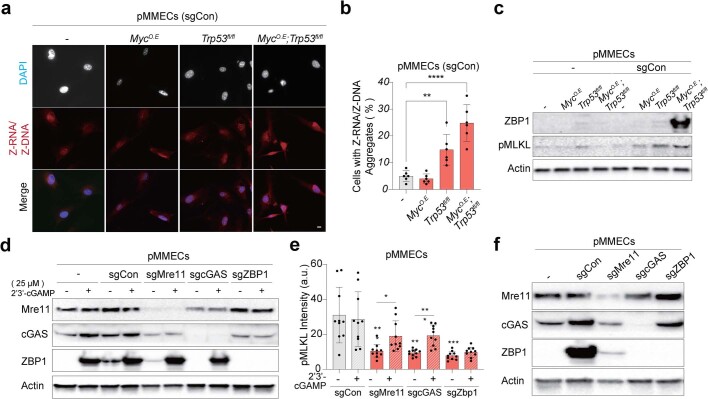
Oncogene-induced replication stress generates endogenous DNA damage that activates cGAS-STING-mediated signalling and tumour suppression1-3. However, the precise mechanism of cGAS activation by endogenous DNA damage remains enigmatic, particularly given that high-affinity histone acidic patch (AP) binding constitutively inhibits cGAS by sterically hindering its activation by double-stranded DNA (dsDNA)4-10. Here we report that the DNA double-strand break sensor MRE11 suppresses mammary tumorigenesis through a pivotal role in regulating cGAS activation. We demonstrate that binding of the MRE11-RAD50-NBN complex to nucleosome fragments is necessary to displace cGAS from acidic-patch-mediated sequestration, which enables its mobilization and activation by dsDNA. MRE11 is therefore essential for cGAS activation in response to oncogenic stress, cytosolic dsDNA and ionizing radiation. Furthermore, MRE11-dependent cGAS activation promotes ZBP1-RIPK3-MLKL-mediated necroptosis, which is essential to suppress oncogenic proliferation and breast tumorigenesis. Notably, downregulation of ZBP1 in human triple-negative breast cancer is associated with increased genome instability, immune suppression and poor patient prognosis. These findings establish MRE11 as a crucial mediator that links DNA damage and cGAS activation, resulting in tumour suppression through ZBP1-dependent necroptosis.


Conflict of interest statement

G.P.G. is a co-inventor on a patent held by the University of North Carolina at Chapel Hill on methods for detecting tumour-derived viral DNA in blood (US patent 11,168,373), receives patent licensing fees from and has equity in Naveris, and is the recipient of research funding from Breakpoint Therapeutics and Merck. C.M.P is an equity stockholder and consultant of BioClassifier. C.M.P. is also listed as an inventor on patent applications for the Breast PAM50 Subtyping assay. M.-G.C, R.J.K., C.-C.L., J.A.B., J.A.S., K.F.-S., D.A.S., C.F., C.E.F., A.M.G., L.M.L., S.W.E., Q.W., Y.W., A.Y.H., P.L., Q.Z., R.K.M. and J.E.P. have no competing interests.

Figures

Fig. 1
Fig. 1. MRE11 suppresses breast tumorigenesis driven by MYC overexpression and p53 deficiency.
a, Fraction of genome altered (left), and RPPA signals for pCHK2(T68) (middle) and pCHK1(S345) (right) in TCGA breast cancers stratified by MYC amplification (MYCamp) and TP53 alterations (TP53mut/deep-del), analysed by one-way analysis of variance (ANOVA). Box plots show the median, the 25th to 75 percentiles and range. N indicates the number of independent tumours from the TCGA-BRCA Pan-Cancer Atlas dataset. P values (left to right): fraction of genome altered, P = 0.0251, P < 0.0001, P < 0.0001; pCHK2, P = 0.9999, P < 0.0001, P < 0.0001; pCHK1, P = 0.9999, P = 0.0003, P < 0.0001. b, Schematic of the transgenic breast cancer model used for the DDR-CRISPR sgRNA library screen. c, Sections from a non-injected mammary gland (top) and a mammary gland 4 months after DDR-CRISPR lentiviral injection (bottom) and stained with haematoxylin and eosin. d, Kaplan–Meier tumour-free survival curve after injection with the DDR-CRISPR library. e, Normalized gene z scores relative to control. f, Bar plot depicting the most commonly targeted DDR genes. g, Kaplan–Meier tumour-free survival curves of R26LSL-cas9/LSL-Myc;Trp53fl/fl female mice after mammary intraductal injection with Cre-sgControl (n = 24 biologically independent animals) or Cre-sgMre11 (n = 42 biologically independent animals), analysed by two-tailed log-rank test. h, Sections of mammary tumours induced by Cre-sgControl or Cre-sgMre11 (bottom) stained with haematoxylin and eosin. i, Spider plot (left) of tumour growth after initial palpation of mammary tumours and bar plot (right) of time from palpation to tumour end point. sgControl versus sgMre11, P = 0.0033. j, Representative immunohistochemistry images (left and middle) and quantification (right) of histone H3S10ph. sgControl (n = 3 biologically independent tumours) versus sgMre11 (n = 3 biologically independent tumours), P = 0.01. Graph depicts mean ± s.e.m. Grouped comparisons analysed by unpaired, two-tailed t-test. NS, not significant, *P < 0.05, **P < 0.01, ***P < 0.001, ****P < 0.0001. Scale bar, 200 µm (h,j), 1 mm (c). Source Data
Fig. 2
Fig. 2. MRE11 promotes post-mitotic arrest through cGAS–STING activation.
a, Schematic of the generation of PCNA–mCherry-labelled MycOETrp53−/− pMMECs for time-lapse microscopy. b, Cell fate analyses of sgControl (n = 135 independent cells) versus sgMre11 (n = 117 independent cells) pMMECs by time-lapse microscopy. sgControl versus sgMre11, P < 0.0001, two-tailed chi-squared test. c, Left, representative images of 24-h EdU pulse quiescence assays, with dashed squares indicating EdU-negative (that is, quiescent) nuclei. Right, percentage of EdU-negative cells in sgControl and sgMre11 pMMECs. Each data point represents n = 300 independent cells, P = 0.0012. Representative of three independent biological experiments. d,e, Images (left) and percentage (right) of cells with micronuclei (d) or cGAS foci (e), annotated with arrowheads. n = 440 independent sgControl and sgMre11 cells, P = 0.0256 (d) or n = 1,800 independent sgControl and sgMre11 cells, P = 0.0018 (e). Representative of three independent biological experiments. f, Relative mRNA levels of ISGs Ifit1 and Ifnb1, normalized to Actb, measured by quantitative PCR with reverse transcription. Graph shows three biological replicates, P < 0.0001. Representative of three independent biological experiments. g, Percentage of EdU and EdU+ sgControl pMMECs with cGAS foci. n = 338 (EdU) and n = 1,971 (EdU+) independent cells, P = 0.0061. Representative of three independent biological experiments. h, Percentage of quiescent (EdU) sgControl pMMECs (n = 797 independent cells) with or without 24 h of C-176 (STING antagonist, n = 633 independent cells) treatment, and sgMre11 pMMECs (n = 646 independent cells) with or without 24 h of 2′3′-cGAMP (n = 580 independent cells) treatment. sgControl versus sgControl + C-176, P = 0.0009; sgControl versus sgMre11, P < 0.0001; sgMre11 versus sgMre11 + cGAMP, P = 0.0004. Representative of three independent biological experiments. i, Ifit1 expression is induced by treatment of sgControl, sgMre11 and sgcGas MycOETrp53−/− pMMECs with 2′3′-cGAMP. Data show mean ± s.e.m. for n = 3 biological replicates; ****P < 0.0001. Representative of three independent biological experiments. Grouped analyses performed with a two-tailed t-test (ci). *P < 0.05, **P < 0.01, ***P < 0.001, ****P < 0.0001. j, Western blot confirmation of MRE11, cGAS and STING CRISPR targeting in MycOETrp53−/− pMMECs. k, Normalized pMMEC counts over time. Data show mean ± s.e.m. for n = 4 independent biological replicates for each genotype and time point. Representative of three independent biological experiments. Grouped analyses performed with a two-tailed t-test. *P < 0.0001. Scale bars, 10 µm (c,d,e). Source Data
Fig. 3
Fig. 3. MRN stimulates cGAS activation by antagonizing nucleosome sequestration.
a,b, Images (a) and quantification (b) of cGAS and ISD90, or cGAS and human nucleosomal core particles (hNCP) colocalization in control cells and sgMRE11 MDA-MB-231 cells. Left to right, n = 344, 312, 491, 405, 366 and 243 independent cells. White arrowheads indicate colocalization of cGAS and ISD90 foci. WT versus sgMRE11, ISD90, P = 0.007; hNCP, P = 0.0038. c, 2′3′-cGAMP ELISA after ISD90 transfection in sgControl versus sgMRE11 cells. Two independent biological replicates for WT, sgMRE11, WT + ISD90 and sgMRE11 + ISD90. CDK1i refers to the CDK1 inhibitor (Ro-3306). Representative of two independent biological experiments. d, Top, schematic of the experiment. Bottom, western blot for the STING pathway in WT versus sgMRE11 cells after Lipofectamine (Lipo) only, ISD90 or hNCP transfection. e, cGAS+ micronuclei after 24 h of irradiation in WT or sgMRE11 mitotic cells. n = 404 (WT), 441 (sgMRE11), 419 (WT + 4 Gy) and 438 (sgMRE11 + 4 Gy) independent cells. Representative of two independent biological experiments. f,g, cGAS–ISD90 colocalization. f, In the presence of MRE11 nuclease inhibitors, n = 500 independent cells per cell line per condition, ****P < 0.0001, representative of two independent biological experiments. g, sgMRE11 cells expressing different MRE11 constructs. n = 1,200 independent cells per cell line; WT versus sgMRE11, P = 0.0001; sgMRE11 versus sgMRE11 + WT, P = 0.0002; sgMRE11 versus sgMRE11 + H129N, P = 0.0004; sgMRE11 versus sgMRE11 + DB1/DB2Δ, P = NS. Representative of two independent biological experiments. h,i, Schematic (top) and quantification (bottom) of TR-FRET fluorescence assays using europium–streptavidin (Eu–SA)-labelled hNCP and an anti-His antibody conjugated to the FRET acceptor ULight to measure cGAS–NCP interaction (h) and FRET acceptor AT647N conjugated hNCP to measure nucleosome stacking (i). Results representative of three independent experiments. j, Top, cGAMP accumulation in the presence of 1 µM cGAS, 5 µM dsDNA, 0.5 µM NCP and a 2-fold gradient of MRN concentrations (0.0156–2 µM). Bottom, quantified cGAS activity from triplicate experiments. Left to right, including comparisons to +NCP/–MRN: P < 0.0001, P = 0.0693 (NS), P = 0.0042, P < 0.0001, P = 0.0002, P < 0.0001, P < 0.0001, P < 0.0001 and P < 0.0001, by two-tailed one-way ANOVA. Representative of three independent experiments. k,l, Images (k) and quantification (l) FRAP assays in sgControl versus siMRE11 cells stably expressing GFP–cGAS. Images taken at 1-min intervals before and after photobleaching an arbitrary nuclear region of interest (ROI) for 60 min. Neocarzinostatin (NCS; 0.1 mg ml–1) was added immediately after photobleaching as indicated. n = 3 independent cells for each condition. Two-tailed two-way ANOVA: siControl + NCS versus siMRE11 + NCS, P = 0.041; siControl versus siControl + NCS, P = 0.0003; siControl + NCS versus siMRE11, P < 0.0001. m,n, Images (m) and quantification (n) of colocalization of cGAS-ISD90 in cGAS-deficient control or sgMRE11 cells reconstituted with cGAS WT or cGAS(R255A). White arrowheads indicate colocalization of cGAS and ISD90 foci. Data are mean ± s.e.m., n = 1,200 independent cells per condition. sgcGAS + cGAS WT + doxycycline versus sgcGAS/sgMRE11 + cGAS WT + doxycycline, P < 0.0001; sgcGAS + cGAS(R255A) + doxycycline versus sgcGAS/sgMRE11 + cGAS(R255A) + doxycycline, P > 0.99 (NS). Unless otherwise specified, grouped analyses performed with a two-tailed t-test. Scale bars, 10 µm (k,m), 20 µm (a). Source Data
Fig. 4
Fig. 4. MRE11–cGAS–STING stimulates ZBP1–RIPK3–MLKL-dependent necroptosis.
a, scRNA-seq UMAP analyses of sgControl versus sgMre11 MycOETrp53−/− pMMECs. The UMAP on the right is pseudocoloured according to the predicted cell cycle state. A ROI with an increased abundance of sgControl compared with sgMre11 pMMECs is outlined. b, Heatmap showing gene expression in sgControl G1 compared with sgMre11 G1 single cells. c, Western blot of ZBP1 and pMLKL in sgControl and sgMre11 pMMECs, representative across three independent experiments. d, Immunocytochemistry analysis of pMLKL in pMMECs: untransduced, sgControl and sgMre11. e, Quantification of pMLKL fluorescence intensity across genotypes in arbitrary units (a.u.). Data are mean ± s.e.m., n = 30 cells for each cell line, representative of 3 independent biological experiments. Statistical comparisons to sgControl by two-tailed t-test: ****P < 0.0001. Scale bar, 10 µm. f, Twenty-four hour EdU percentage (mean ± s.e.m.) in the indicated pMMEC genotypes. Number of independent cells analysed per condition: 401 (pMMECs), 400 (sgControl, sgMre11 and sgcGas, sgZbp1-1 and sgZbp1-2), 390 (sgZbp1-3) and 398 (sgRipk3). Representative of three independent biological experiments. Statistical comparisons by two-tailed t-test to the sgControl genotype: sgMre11, P = 0.0224; sgcGas, P = 0.0014; sgZbp1-1, P = 0.0005; sgZbp1-2, P = 0.0004; and sgZbp1-3, P = 0.0004. g, Tumour-free survival after orthotopic transplantation of pMMECs expressing the indicated sgRNAs into the fourth mammary fat pad of female NOD/RAG1 mice, n = 10 independent animals per group. Two-tailed log-rank (Mantel–Cox) tests compared with sgControl are shown. *P = 0.0336 (sgMre11); **P = 0.0014 (sgcGas); *P = 0.0126 (sgZbp1). h, Schematic (top) and quantification (bottom) of IFN Lucia reporter activity in RAW 264.7 macrophages after treatment with supernatant from control pMMECs (NT) or pMMECs expressing the indicated sgRNAs. Graph depicts mean ± s.e.m., n = 3 (NT, sgControl, sgMre11, sgMlkl) samples from 3 independent biological experiments. Comparisons by two-tailed t-tests, NT versus sgControl, P < 0.0001; sgControl versus sgMre11, P < 0.0001; sgControl versus sgMlkl, P = 0.0007. i, Fraction of genome altered (left), T cell signature (middle) and inflammation signature (right) levels in TCGA TNBC cohort stratified by median-thresholded expression of ZBP1. Box plots display medians, interquartile range, and minimum and maximum values. Statistical comparisons by two-tailed t-tests. j, Kaplan–Meier overall survival analysis of TNBC with ZBP1 high versus low expression in the SCAN-B and METABRIC cohorts, using a two-tailed log-rank test. HR, hazard ratio. k, MRE11-mediated activation of cGAS and ZBP1-dependent necroptosis during tumorigenesis. Schematic in h was created using BioRender (www.biorender.com). Source Data
Extended Data Fig. 1
Extended Data Fig. 1. DNA damage and genome instability in mammary tumors induced in Rosa26LSL-Myc/LSL-Cas9;Trp53FL/FL mice by in vivo transduction with Cre-sgControl or Cre-sgMre11.
a, Immunofluorescence imaging of mammary tumors induced by mammary intraductal injection of lentivirus expressing Cre recombinase and control sgRNA (targeting a non-coding region on Chromosome 2) for gH2A.X or cGAS showing abundant DNA damage (gH2A.X foci) and cytoplasmic cGAS localization, demonstrating consistent results across at least three independent repetitions. Scale bar, 50 µm. b, Mitotic aberration figures were morphologically analyzed in H&E-stained sections from mouse mammary tumors induced by Cre and sgControl (top panel) or sgMre11 (bottom panel). sgControl-induced mouse tumor tissues have 56.5% normal, 17.4% chromatin bridges, 13% lagging chromosomes, 13% multipolar divisions, and 0% asymmetric divisions in mitotic cells. In contrast, sgMre11-induced tumors displayed 56% normal, 30% chromatin bridges, 1.2% lagging chromosomes, 1.2% multipolar division and 12% asymmetric division in mitotic cells, revealing consistent findings across at least three independent replicates. Scale bar, 20 µm.
Extended Data Fig. 2
Extended Data Fig. 2. Mre11, but not ATM, is required for quiescence and ISG induction in MycOEp53−/− pMMECs.
a, Western blot confirmation of ATM, Mre11, cGAS, and Actin in MycOEp53−/− pMMECs expressing the indicated sgRNAs, demonstrating consistent findings across three independent replicates. b, Representative images for 24-hours EdU pulse-chase quiescence assay in MycOEp53−/− pMMECs. Scale bar, 20μm. c, Quantification of EdU negative percentage. n = 1,500 (sgControl, sgMre11, sgcGas and sgAtm) independent cells. ****, p < 0.0001. Representative of 2 independent biological experiments; d, 8 days after infection with each lentivirus, qRT-PCR was performed to normalize gene expression levels for interferon-stimulated genes IFIT1, with mRNA levels normalized to β-actin mRNA levels. N = 3 (sgCon, sgMre11, sgcGas and sgAtm) independent samples. NT vs sgControl; p = 0.0002. sgControl vs sgMre11; p = 0.0047, sgcGas; p = 0.0052. n = 3 independent biological experiments;. Data are mean ± SEM. Unless otherwise specified, statistical analyses were determined by one-way ANOVA followed by Sidak’s multiple comparison post-test using a two-tailed test: *, p < 0.05; **, p < 0.01; ***, p < 0.001; ****, p < 0.0001. Source Data
Extended Data Fig. 3
Extended Data Fig. 3. Mre11 is essential for activation of the cGAS-STING pathway by cytosolic DNA or nucleosomal core particles (NCPs).
a, b, ICC of cGAS localization to cytoplasmic interferon stimulating dsDNA 90 bp (ISD90) a, 1 h after transfection in siControl vs siMRE11 BJ-5ta cells (72 h after siRNA transfection). b, Percentage of cells with cGAS foci. Scale bar, 10 µm. n = 900 cells for each cell lines. siControl+ISD90 vs siMRE11+ ISD90; p = 0.0001. n = 3 independent biological experiments; c, Western blot was performed on innate immune signaling pathways in siControl, siMRE11, and sicGAS BJ-5ta cells, 3 h post transfection with 4 μg/mL dsDNA 90 bp (ISD90), demonstrating consistent findings across three independent replicates. d, e, and f, Quantitative RT-PCR was used to analyze normalized gene expression for human interferon-stimulated genes (ISGs), namely CXCL10, CCL5, and IFIT1 in BJ-5ta cells. n = 2 independent biological experiments; 3 samples for each cell lines. (d) siControl (Lipo vs ISD90); p = 0.0027. siControl+ISD90 vs sicGAS+ISD90; p = 0.0004 and siMre11 + ISD90; p = 0.0009. (e)siControl (Lipo vs ISD90); p = 0.0014. siControl+ISD90 vs sicGAS+ISD90; p = 0.0013 and siMRE11 + ISD90; p = 0.0076. (f) siControl (Lipo vs ISD90); p < 0.0001. siControl+ISD90 vs sicGAS+ISD90; p < 0.0001 andsiMRE11 + ISD90; p = 0.0003. g, Representative immunocytochemistry analysis of cGAS (Red) localization to cytoplasmic Oregon Green conjugated human NCP (OG-hNCP) (Green), 60 min after transfection with 72 nM OG-hNCP in siControl or siMRE11 human MDA-MB-231 cells. Cell nuclei stained by 4′,6-diamidino-2-phenylindole (DAPI; Blue). Scale bar, 10 µm. Image quantification is shown in Fig. 3b, right panel. h, i, qRT-PCR normalized gene expression for human interferon-stimulated genes (ISG) IFIT1 and CCL5. Cells were transfected with Lipo only or 4 μg/mL ISD90 for 6 h. mRNA levels were normalized to β-actin mRNA levels. n = 3 independent biological experiments; 3 samples for each cell lines. (h) ISD90 (WT vs sgMRE11); p < 0.0001. (i) p = 0.0008. j, WT or two different Mre11ATLD/ATLD MEF cell lines were transfected with 4 μg/mL Alexa488-ISD90 or 72 nM OG-hNCP for 60 min. Quantification of cells with colocalization for cGAS foci and cytosol DNA (ISD90 or OG-hNCP) is shown. Alexa488-ISD90 (WT vs ATLD #1; p = 0.0021, ATLD#2; p = 0.004). OG-hNCP (WT vs ATLD #1; p < 0.0001, ATLD#2; p < 0.0001). n = 3 independent biological experiments; 900 cells for each cell lines. k, l, qRT-PCR normalized gene expression for mouse ISG IFIT1 and CCL5. (k) WT vs WT + ISD90; p = 0.0007, WT + ISD90 vs ATLD + ISD90; p = 0.0022. (l) WT vs WT + ISD90; p = 0. 0006, WT + ISD90 vs ATLD + ISD90; p = 0.0009. n = 3 independent biological experiments; 3 samples for each cell lines. Data are mean ± SEM. Unless otherwise specified, P values estimated using a two-tailed t-test. *, p < 0.05; **, p < 0.01; ***, p < 0.001; ****, p < 0.0001. Source Data
Extended Data Fig. 4
Extended Data Fig. 4. Time-lapse microscopy of cGAS recruitment to cytoplasmic dsDNA in WT and Mre11-mutant cells.
a, Time-lapse microscopy of WT and sgMRE11 MDA-MB-231 cells expressing RFP-cGAS after transfection with 4 μg/mL Alexa 488-ISD90. Images were captured with a Nikon fluorescence microscope, and the time stamp is relative to transfection. White arrows indicate co-localization of RFP-cGAS foci and Alexa 488-ISD90 foci. Scale bar, 20 μm.
Extended Data Fig. 5
Extended Data Fig. 5. The translocation of cGAS to the micronuclei in mitotic MDA-MB-231 cells in response to ionizing radiation (IR) is dependent on Mre11.
a, b WT or sgMRE11 MDA-MB-231 cells transfected with control siRNA (siControl) or Mre11-targeting siRNA (siMRE11) and analyzed 24 h after 15 Gy IR. Cells with micronuclei (a) or cGAS foci (b) were counted by ICC analysis. n = 2 independent experiments; 615 (WT + siControl), 387 (sgMre11+ siControl), 467 (WT + siMre11), 620 (sgMre11 + siMre11) samples for each cell lines. (a) WT+siControl vs sgMre11+siControl; p = 0.029, WT+siMRE11; p = 0.0022, sgMRE11+siMRE11; p = 0.0014. (b) WT+siControl vs sgMRE11+siControl; p = 0.008, WT+siMRE11; p = 0.0058, sgMRE11+siMRE11; p = 0.0074. c, d, human ISG expression IFIT1 (c) and CCL5 (d) were observed in WT and sgMRE11 MDA-MB-231 cells 48 h after IR (20 Gy) by RT-qPCR. mRNA levels were normalized to β-actin mRNA levels. (c) WT vs WT + 20 Gy; p = 0.0121, WT + 20 Gy vs sgMRE11 + 20 Gy; p = 0.0099. (d) WT vs WT + 20 Gy; p = 0.0048, WT + 20 Gy vs sgMRE11+ 20 Gy; p = 0.0025. n = 2 independent experiments; 3 samples for each cell lines. e, Mitotic cells of the indicated MDA-MB-231 cells were irradiated and then fixed 24 h after irradiation. Scale bar, 20 μm. Image quantification is shown in Fig. 3e. Data are mean ± SEM. Unless otherwise specified, statistical analyses were determined by one-way ANOVA followed by Sidak’s multiple comparison post-test using a two-tailed test: *, p < 0.05; **, p < 0.01; ***, p < 0.001; ****, p < 0.0001. Source Data
Extended Data Fig. 6
Extended Data Fig. 6. The DNA binding domain, but not the nuclease activity, of Mre11 is required to facilitate cGAS-dsDNA interaction.
a, b, MDA-MB-231 cells were transfected with the indicated siRNA and incubated for 48 h. Subsequently, cells were harvested 6 h (a) or 1 h (b) after transfection with 4 μg/mL ISD90. a, Western blot analysis of each cell line with the indicated antibodies. Mre11, Nbs1, Rad50 and GAPDH (a loading control). b, Quantification of cells positive for cGAS foci. (a) and (b) were double-checked using a blinded experiment. n = 2 independent biological experiments; 400 cells for each cell lines. WT + ISD90 vssiMRE11 + ISD90; p < 0.0001, siRad50, siNBS1 and siMRN; p = 0.0002. c, d, e, MDA-MB-231 cells were transfected with dsDNA, following treatment with indicated nuclease inhibitors (Mirin, PFM01 and PFM39) for 30 min. c, Representative images showing the localization of cGAS and Biotin-ISD90 were obtained 2 h after transfection with Biotin-ISD90. Scale bar, 10 μm. Image quantification is shown in Fig. 3f. d, Western blot analysis for cGAS-STING pathways. Cells were obtained 3 h after transfection of ISD90. e, Cells were obtained 6 h after transfection of ISD90. qRT-PCR normalized gene expression for human interferon-stimulated genes IFIT1. mRNA levels were normalized to human β-actin RNA levels. n = 3 independent biological experiments; 3 samples for each cell lines. p < 0.0001. f, g, sgMRE11 MDA-MB-231 stable cell lines were generated via retroviral infection, with each line expressing human Mre11 WT, H129N (nuclease dead mutant), and DB1/DB2 deletion (DNA binding mutant) in sgMRE11 MDA-MB-231 cells. These cell lines were then transfected with dsDNA. f, Western blot analysis of Halo, human Mre11, pSTING, pIRF3 and α-tubulin in each MDA-MB-231 cell lines, demonstrating consistent findings across three independent replicates. g, Representative images showing the localization of cGAS and Biotin-ISD90 were obtained 2 h after transfection with Biotin-ISD90. Scale bar, 10 μm. Image quantification is shown in Fig. 3g. h, ICC 30 min after transfection with Oregon Green (OG)-NCP in MDA-MB-231 cells expressing RFP-cGAS and HaloTag-Mre11. Right panel, quantification of Mre11 and cGAS colocalization at cytoplasmic NCP foci. Scale bar, 10 μm. n = 3 independent biological experiments; 474 cells were analyzed for Fraction of NCP foci. NCP+cGAS vs NCP + cGAS+Mre11; p = 0.0006, NCP+Mre11 vs NCP+cGAS+Mre11; p = 0.0055. Data are mean ± SEM. Unless otherwise specified, statistical analyses were determined by one-way ANOVA followed by Sidak’s multiple comparison post-test using a two-tailed test: *, p < 0.05; **, p < 0.01; ***, p < 0.001; ****, p < 0.0001. Source Data
Extended Data Fig. 7
Extended Data Fig. 7. Biochemical analysis of purified MRN, Nucleosome Core Particles (NCP), and cGAS.
a, b, c, d, Electrophoretic mobility shift assays (EMSA) a, Native gel of nucleosomes containing 147 or 185 bp DNA in presence of increasing concentrations of MRN complex, stained with ethidium bromide. b, Native gel of 147 bp nucleosomes containing either wild type or acidic patch mutant (APM) histones in the presence of increasing concentrations of MRN complex, stained with ethidium bromide. c, Native gel as in panel (b) using 185 bp nucleosomes with 20 bp symmetric linker on each side of the nucleosome core. d and e, Native gel of 50 nM (d) or 100 nM (e) 147-bp hNCPs without or with 200 nM (d) or 50 nM (e) carboxyrhodamine-labelled mouse cGAS catalytic domain (mcGAScat-CR) and 0-1.2 μM MRN. The upper gel shows ethidium bromide staining of DNA, and the lower gel shows fluorescence signal from mcGAScat-CR. hNCP alone as well as 1:1 and 2:1 cGAS:hNCP complexes are indicated. (The results from the tests (a, b, c, d, e) demonstrate consistent findings across three independent replicates. f, Quantification of bands from the corresponding gels (e). g, TR-FRET assay for detection of nucleosome stacking mediated by human cGAS catalytic domain (hcGAScat) or MRN complex. EU-SA, LANCE Eu-W1024 Streptavidin; AT647N, Atto647N; biotin-NUC, H2BK125C-biotin 147-bp nucleosomes. Data are mean ± s.d. h, i, Substrate, intermediate, and product are ATP, pppGpA, and cGAMP, respectively. h, 1 μM cGAS: 5 μM dsDNA, 0.5 μM hNCP, 0–2 μM MnucdeadRN (containing Mre11H129N nuclease deficient protein), demonstrating consistent findings across three independent replicates. i, 0.5 μM cGAS: 5 μM dsDNA, 0.5 μM hNCP, 0–2 μM MRN demonstrating consistent findings across two independent replicates. j, Quantification of standardized percentage of cGAMP product across three biological replicates demonstrates greater cGAS activity in the presence of increasing concentrations of MRN, but only when the cGAS:hNCP ratio is 2:1 versus 1:1. Shown are the mean value with error bars representing the standard deviation. Source Data
Extended Data Fig. 8
Extended Data Fig. 8. Mre11 facilitates cGAS cytoplasmic translocation in response to cytosolic DNA and DNA damage induction.
a, b, ICC of cGAS re-localization to cytoplasmic ISD90 in a subset of cells, a, 6 h after transfection in siControl versus siMRE11 BJ-5ta cells (72 h after siRNA transfection). b, Percentage of cells with cGAS localization in both cytosol and nucleus (C + N; Cytosol + Nucleus [0.4 </= C/N ratio </= 1.25]), predominantly cytosolic (C:cytosol [C/N ratio > 1.25]), and predominantly nuclear (N: Nucleus [C/N ratio <0.4]) 0, 3, and 6 h after 4 µg/mL ISD90 transfection in a series of images containing at least 10 evaluable cells each. n = 2 independent experiments; n = 500 cells for each cell condition. siControl (C + N) 0 h vs 3 h: p = 0.0002, 0 h vs 6 h: p < 0.0001; (C) 0 h vs 3 h: p = 0.0001, 0 h vs 6 h: p = 0.0002; (N) 0 h vs 3 h: p < 0.0001, 0 h vs 6 h: p < 0.0001. siMRE11 (C) 0 h vs 3 h: p = 0.0234, 0 h vs 6 h: p = 0.0012; (N) 0 h vs 3 h: p = 0.0116. c, d, Indicated MDA-MB-231 cells were either transfected with dsDNA or treated with NCS for 6 h. c, The Log2-transformed cGAS localization ratio (Cytosol/Nucleus). N = 2 independent experiments; 10 (WT and sgMRE11) cells. WT + Lipo vs WT + ISD90; p = 0.034, WT + Lipo vs WT + NCS; p < 0.0001. d, Representative images of cGAS staining, demonstrating consistent findings across three independent replicates. Scale bar, 10μm. Data are mean ± SEM. Unless otherwise specified, statistical analyses were determined by one-way ANOVA followed by Sidak’s multiple comparison post-test using a two-tailed test: *, p < 0.05; **, p < 0.01; ***, p < 0.001; ****, p < 0.0001. Source Data
Extended Data Fig. 9
Extended Data Fig. 9. Mre11 is required to release cGAS from nucleosome tethering.
a, b, Human cGAS knock-out MDA-MB231 cell lines were made with CRISPR technology using multiguided sgRNA (Synthego). Then, MDA-MB-231 sgcGAS stable cell lines were transfected with mcGASt1, hNCP v52, or mcGASt1/hNCP v52. a, After 2 h, cells were harvested for Western blot analysis to confirm human Mre11, pTBK, pSTING, and Actin, demonstrating consistent findings across two independent replicates. b, Six hours after transfection, qRT-PCR was performed to normalize gene expression levels for interferon-stimulated genes CXCL10, with mRNA levels normalized to β-actin mRNA levels. n = 3 independent experiments; 3 samples for each cell lines. sgcGAS + Lipo vs sgcGAS + cGAS-NCP; p < 0.0001, sgcGAS/sgMRE11 + Lipo vs sgcGAS/sgMRE11 + cGAS-NCP; p < 0.0001, sgcGAS + cGAS vs sgcGAS/sgMRE11+ cGAS; p = 0.0067. c, d, PiggyBac Transposon system was used to deliver PB-cGAS-WT or PB-cGAS-R255A (an AP site binding mutant) to each cell line, followed by selection with puromycin for two days. After selection, cells were incubated with doxycycline for 24 h, and then transfected with ISD90. c, Western blot analysis of human Mre11, cGAS and Actin 24 h after doxycycline treatment, demonstrating consistent findings across two independent replicates. d, The cGAS localization ratio (Nucleus/cytosol) 2 h after Biotin-ISD90 transfection. n = 2 independent experiments; 31 cells for each cell lines. sgcGAS + cGAS-WT + ISD90 vs sgcGAS/sgMRE11 + cGAS-WT + ISD90; p = 0.0394, sgcGAS/sgMRE11 + cGAS-WT + ISD90 vs ssgcGAS/sgMRE11 + cGAS-R255A + ISD90; p = 0.022. e, Representative images showing the localization of cGAS and Biotin-ISD90 were obtained 2 h after transfection with Biotin-ISD90, demonstrating consistent findings across two independent replicates. Scale bar, 10 μm. Data are mean ± SEM. Unless otherwise specified, statistical analyses were determined by one-way ANOVA followed by Sidak’s multiple comparison post-test using a two-tailed test: *, p < 0.05; **, p < 0.01; ***, p < 0.001; ****, p < 0.0001. n.s., not significant. Source Data
Extended Data Fig. 10
Extended Data Fig. 10. Myc overexpression and p53 depletion stimulate Z-RNA/Z-DNA accumulation and ZBP1-dependent necroptosis in pMMECs.
a, Representative images of Z-RNA/Z-DNA immunocytochemistry in sgControl pMMECs. Scale bar, 10 μm. b, Quantification of cells with Z-RNA/Z-DNA aggregation percentage. n = 2 independent experiments; 600 cells for each cell lines. NT vs Trp53fl/fl; p = 0.0043, NT vs MycOE;Trp53fl/fl; p < 0.0001. c, Western blot confirmation of ZBP, pMLKL and Actin in pMMECs 8 days after sgControl lentiviral infection, demonstrating consistent findings across three independent replicates. d, Western blot analysis of untransduced or MycOEp53−/− pMMECs expressing the indicated sgRNA, 6 h after treatment with DMSO control or 25 µM 2′3′-cGAMP. e, ICC analysis for pMLKL intensity 6 h after treatment with DMSO control or 25 µM 2′3′-cGAMP in MycOEp53−/− pMMECs expressing the indicated sgRNA. n = 2 independent experiments; 10 cells for each cell lines. sgMre11 vs sgMre11+cGAMP; p < 0.011, sgcGas vssgcGas+cGAMP; p = 0.0001. f, Western blot confirming inhibition of Mre11, cGAS, and ZBP1 proteins in MycOEp53−/− pMMECs expressing the indicated sgRNA, in support of the tumorigenesis experiment shown in Fig. 4g. Data are mean ± SEM. Unless otherwise specified, statistical analyses were determined by one-way ANOVA followed by Sidak’s multiple comparison post-test using a two-tailed test: *, p < 0.05; **, p < 0.01; ***, p < 0.001; ****, p < 0.0001. Source Data

References

    1. Dou Z, et al. Cytoplasmic chromatin triggers inflammation in senescence and cancer. Nature. 2017;550:402–406. doi: 10.1038/nature24050. - DOI - PMC - PubMed
    1. Glück S, et al. Innate immune sensing of cytosolic chromatin fragments through cGAS promotes senescence. Nat. Cell Biol. 2017;19:1061–1070. doi: 10.1038/ncb3586. - DOI - PMC - PubMed
    1. Miller KN, et al. Cytoplasmic DNA: sources, sensing, and role in aging and disease. Cell. 2021;184:5506–5526. doi: 10.1016/j.cell.2021.09.034. - DOI - PMC - PubMed
    1. Boyer JA, et al. Structural basis of nucleosome-dependent cGAS inhibition. Science. 2020;370:450–454. doi: 10.1126/science.abd0609. - DOI - PMC - PubMed
    1. Cao D, Han X, Fan X, Xu R-M, Zhang X. Structural basis for nucleosome-mediated inhibition of cGAS activity. Cell Res. 2020;30:1088–1097. doi: 10.1038/s41422-020-00422-4. - DOI - PMC - PubMed

MeSH terms