. 2024 Jan;625(7996):750-759.
doi: 10.1038/s41586-023-06891-y. Epub 2024 Jan 10.

Spatial IMA1 regulation restricts root iron acquisition on MAMP perception

Affiliations

Spatial IMA1 regulation restricts root iron acquisition on MAMP perception

Min Cao et al. Nature. 2024 Jan.

Abstract

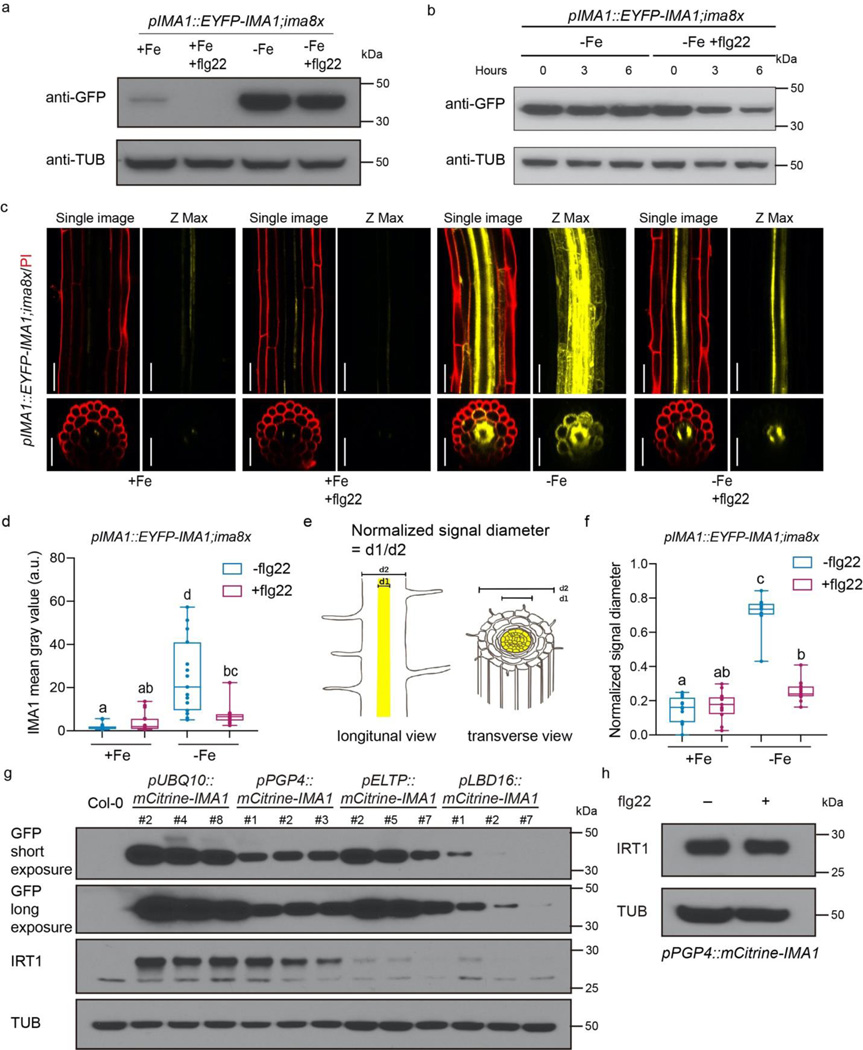
Iron is critical during host-microorganism interactions1-4. Restriction of available iron by the host during infection is an important defence strategy, described as nutritional immunity5. However, this poses a conundrum for externally facing, absorptive tissues such as the gut epithelium or the plant root epidermis that generate environments that favour iron bioavailability. For example, plant roots acquire iron mostly from the soil and, when iron deficient, increase iron availability through mechanisms that include rhizosphere acidification and secretion of iron chelators6-9. Yet, the elevated iron bioavailability would also be beneficial for the growth of bacteria that threaten plant health. Here we report that microorganism-associated molecular patterns such as flagellin lead to suppression of root iron acquisition through a localized degradation of the systemic iron-deficiency signalling peptide Iron Man 1 (IMA1) in Arabidopsis thaliana. This response is also elicited when bacteria enter root tissues, but not when they dwell on the outer root surface. IMA1 itself has a role in modulating immunity in root and shoot, affecting the levels of root colonization and the resistance to a bacterial foliar pathogen. Our findings reveal an adaptive molecular mechanism of nutritional immunity that affects iron bioavailability and uptake, as well as immune responses.


Conflict of interest statement

DECLARATION OF INTERESTS

The authors declare no competing interests.

Figures

Extended Data figure 1.
Flg22 represses iron uptake through FLS2. (a) Phenotype of 15-day-old Arabidopsis seedling leaves response to different iron concentration (shown in figures) with or without low levels of flg22 (10 nM) treatment. Scale bar 1cm. (b-c) Phenotype of 15-day-old Arabidopsis seedling leaves response to sufficient iron (50 μM) or low iron (10 μM) with or without low levels of flg20 or flg22 (10 nM) treatment. (b) Shoots; Scale bar 1cm, (c) Total chlorophyll concentration of Col-0 shoots. Bar chart centers show means of 3 biological replicates. Error bar: s.e.m. The numbers correspond to P-values were analyzed by two-tailed Student t-test. (d) Quantitative analysis of ferric chelate reductase activities in Col-0 roots grown for 7 days under +Fe conditions and transferred to -Fe, -Fe with flg20 and -Fe with flg22 liquid medium for 2 days. The bar chart centers show means of 5 biological replicates. Error bar: s.e.m. Different letters indicate statistically significant differences between different conditions analyzed by one-way ANOVA and Tukey’s test (p<0.05). (e) Promoter activity of IRT1 in the root of pIRT1::NLS-2xYpet seedlings in response to -Fe, -Fe with flg20 and -Fe with flg22 treatment. Seedlings were grown on the +Fe medium and after 5 days transferred to the different liquid media for 24 hours treatment. Green: Nuclear localized Ypet; Red: propidium iodide (PI) cell wall stain. For each treatment, a representative single confocal section (single image, GFP/PI), Maximum Intensity Z-Projection (Z-max, GFP only), a single optical section of the transverse view, and the Z-projection of the transverse section are shown. Scale bar, 50 μm. (f-h) Western blots showing IRT1 protein levels in Col-0 and irt1–1 roots grown in +Fe and -Fe (f) or Col-0 under +Fe, -Fe and -Fe with different concentrations of flg22 treatment (g) or Col-0 under +Fe, -Fe and -Fe with flg20 or flg22 treatment (h). Arrow indicates the IRT1 protein band. The asterisk indicates non-specific band. Tubulin protein was blotted as an internal control. (i-k) Phenotype of 15-day-old Arabidopsis Col-0 and fls2 seedling leaves in response to sufficient iron (50 μM) or low iron (10 μM) with or without low levels of flg22 (10 nM) treatment. The numbers correspond to p-values that were analyzed by two-tailed Student t-test. (i) Shoots; Scale bar 1cm, (j) total chlorophyll concentration of Col-0 shoots, (k) Iron concentration of Col-0 seedlings; bar chart centers show means of 3 biological replicates. Error bar: s.e.m. (l) Quantitative analysis of ferric chelate reductase activities in Col-0 and fls2 roots grown for 7 days under +Fe conditions and transferred to +Fe, +Fe with flg22, -Fe and -Fe with flg22 liquid medium for 2 days. The bar chart centers show means of 5 biological replicates. Error bar: s.e.m. Different letters indicate statistically significant differences between different conditions analyzed by one-way ANOVA and Tukey’s test (p<0.05). (m) Western blots showing IRT1 protein levels in Col-0 and fls2 roots in +Fe, +Fe with flg22, -Fe and -Fe with flg22 treatment. The tubulin protein was blotted as an internal control.
Extended Data figure 2.
MAMPs regulate iron uptake through distinct mechanisms. (a-b) Promoter activity of FRK1 in roots of pFRK1::NLS-3xmVenus seedlings in response to -Fe and -Fe with flg22 treatment (a) or promoter activity of MYB51 in roots of pMYB51::NLS-3xmVenus seedlings in response to -Fe and -Fe with elf18 treatment (b). 7-day-old seedlings are treated with -Fe and -Fe with 100nM flg22 (a) or -Fe and -Fe with 100nM elf18 (b) for 24 hours in liquid media. Green: Nuclear localized mVenus signals; Red: propidium iodide (PI) cell wall stain. In each treatment, a representative single confocal section (single image, GFP/PI) and Maximum Intensity Z-Projection (Z-max, GFP only) is shown. Scale bar, 50 μm. (c) Promoter activity of CYP71A12 in roots of pCYP71A12::GUS seedlings in response to -Fe and -Fe with chitin treatment. 7-day-old seedlings are treated with -Fe and -Fe with 1mg/mL chitin for 24 hours in liquid media. Scale bar, 0.5cm. (d) Quantitative analysis of ferric chelate reductase activities in Col-0 roots grown for 7 days under +Fe conditions and transferred to -Fe, -Fe only or -Fe with flg22, elf18 and chitin liquid medium for 2 days. The bar chart centers show means of 5 biological replicates. Error bars, s.e.m. Different letters indicate statistically significant differences between different conditions analyzed by one-way ANOVA and Tukey’s test (p<0.05). (e) Western blots showing IRT1 protein levels in Col-0 roots grown +Fe, -Fe only or -Fe with flg22, elf18 and chitin treatment. Tubulin protein was blotted as an internal control. (f) Promoter activity of IRT1 in the root of pIRT1::NLS-2xYpet seedlings in response to -Fe only or -Fe with flg22, elf18 and chitin treatment. Green: Nuclear localized Ypet signals; Red: propidium iodide (PI) cell wall stain. In each treatment, the Z-stack scan is processed to single confocal section (single image, GFP/PI), maximal Z-projection (Z-max, GFP only). Scale bar, 50 μm. (g) Western blots showing IRT1 protein levels in 35S::3xHA-FIT roots in response to +Fe, +Fe with flg22, -Fe and -Fe with flg22 treatment. HA-tagged FIT protein was blotted using anti-HA antibody. Tubulin protein was blotted as an internal control.
Extended Data figure 3.
Flg22 antagonistically regulates the iron deficiency transcriptional landscape through FLS2. (a) Venn diagram of up/down-regulated genes of -Fe vs +Fe, +Fe+flg22 vs +Fe, and -Fe+flg22 vs -Fe, respectively. The statistical analysis of p-value was calculated by hypergeometric test (one-sided). (b) Heat map of mean-centered Z-scores for 1290 differentially expressed genes identified across different treatments (+Fe, +Fe+flg22, -Fe and -Fe+flg22), arranged by k-means clustering. Box plot indicates the relative expression level based on median centered Z-score in different clusters. The GO terms analysis was performed using PANTHER17.0 (Fisher’s Exact test, p-value<0.05) and indicated on the right side of the heatmap. (c&d) Heat map of mean-centered Z-scores for differentially expressed genes (cluster 5 (c) and cluster 1 (d) in WT and fls2) identified across different treatments (+Fe, +Fe+flg22, -Fe and -Fe+flg22), arranged by k-means clustering. (e) Heat map of mean-centered Z-scores (normalized by Col-0 +Fe) for well-known iron responsive genes in response to +Fe, +Fe+flg22, -Fe and -Fe+flg22 in Col-0 and fls2 roots. (f) Gene expression analysis in response to +Fe, +Fe with flg22, -Fe and -Fe with flg22 treatment in Col-0 and fls2 roots by quantitative RT-PCR. The gene expression level is normalized to ACT2 internal control. The bar chart centers show means of 3 biological replicates. Error bars, s.e.m. Different letters indicate statistically significant differences between different conditions analyzed by one-way ANOVA and Tukey’s test (p<0.05).
Extended Data figure 4.
Flg22 antagonistically regulates the iron deficiency transcriptional landscape through IMA1. (a&b) Venn diagram of the iron deficiency up-regulated genes in Col-0 vs down-regulated genes of -Fe+flg22 vs -Fe in Col-0 vs down-regulated genes of -Fe+flg22 vs -Fe in UBQ10::mCitrine-IMA1 (a). Venn diagram of the iron deficiency up-regulated genes in Col-0 vs upregulated genes in UBQ10::mCitrine-IMA1 in +Fe vs Col-0 +Fe (b). The statistical analysis of p-value was calculated by hypergeometric test. (c&d) Heat map of mean-centered Z-scores for differentially expressed genes (cluster 5 and cluster 1 refer to extended data fig.3b in WT and UBQ10::mCitine-IMA1) identified across different treatments (+Fe, +Fe+flg22, -Fe and -Fe+flg22), arranged by k-means clustering. (e) Heat map of mean-centered Z-scores (normalized by Col-0 +Fe) for well-known PTI components in response to +Fe, +Fe+flg22, -Fe and -Fe+flg22, respectively.
Extended Data figure 5.
Flg22 spatially regulates IMA1 protein level in the ground tissue of the root through FLS2. (a) Western blots showing IRT1 protein levels in Col-0, ima8x and pIMA1::EYFP-IMA1;ima8x in different treatment conditions. Seedlings were treated with +Fe and -Fe (Col-0 and ima8x) and +Fe, +Fe with flg22, -Fe and -Fe with flg22 treatment (pIMA1::EYFP-IMA1;ima8x). Tubulin protein was blotted as an internal control. (b) Quantitative analysis of ferric chelate reductase activities in pIMA1::EYFP-IMA1;ima8x roots grown for 7 days under +Fe conditions and transferred to +Fe, +Fe with flg22, -Fe and -Fe with flg22 liquid medium for 2 days. The bar chart centers show mean of 5 biological replicates. Error bars, s.e.m. Different letters indicate statistically significant differences between different conditions analyzed by one-way ANOVA and Tukey’s test (p<0.05). (c) IMA1 distribution in response to +Fe, +Fe with flg22, -Fe and -Fe with flg22 treatment in differentiation zone of the root. 5-day-old pIMA1::EYFP-IMA1;ima8x and pIMA1::EYFP-IMA1;fls2 seedlings were grown on the +Fe medium and then transferred to different liquid media for 24 hours treatment. The cytosolic and nuclear localized EYFP-IMA1 signals (yellow channel) are visualized with propidium iodide (PI, cell wall staining, red channel). For each treatment, a representative single confocal section (single image, EYFP/PI), a maximal Z-projection of the Z-stack (Z-max, EYFP only), a single optical section of the transverse view, and the Z-projection of the transverse section is shown. Scale bar, 50 μm. (d-e) Quantification of IMA1 fluorescence signal intensity (d) and normalized IMA1 signal diameter (e) in response to +Fe, +Fe with flg22, -Fe and -Fe with flg22 treatment in differentiation zone of the root in pIMA1::EYFP-IMA1;ima8x and pIMA1::EYFP-IMA1;fls2 (n=15 biologically independent seedlings from 3 biological repeats). The same dataset from Figure 3d&f of pIMA1::EYFP-IMA1;ima8x were used here as the images for quantification were taken at the same time. Different letters indicate statistically significant differences between different conditions analyzed by Kruskal Wallis/two tailed test followed by Multiple pairwise comparisons using the Steel-Dwass-Critchlow-Fligner procedure/two-tailed test (p<0.05). (f) Western blots showing IMA1 protein levels in the roots of pIMA1::EYFP-IMA1;ima8x and pIMA1::EYFP-IMA1;fls2 in +Fe, +Fe with flg22, -Fe and -Fe with flg22 treatments. Tubulin protein was blotted as an internal control. (g) Western blots showing IMA1 protein levels in pIMA1::EYFP-IMA1;ima8x and pIMA1::EYFP-IMA1;fls2 roots. The seedlings were pre-treated with -Fe for 36 hours, then treated with -Fe+flg22 (1μm flg22) for 0, 3 and 6 hours. Tubulin protein was blotted as an internal control. (h) Representative image of EYFP-IMA1 signal intensity profile in response to +Fe, +Fe with flg22, -Fe and -Fe with flg22 treatment in differentiation zone of root in pIMA1::EYFP-IMA1;ima8x (left panel) and pIMA1::EYFP-IMA1;fls2 (right panel). The white line in YFP channel indicates the line for signal quantification. The red dashed lines indicate the boundary between the ground tissue and the stele. Scale bar, 50 μm.
Extended Data figure 6.
Flg22 does not fully repress IMA1 transcription in the ground tissue and flg22 dependent callose deposition is not required for IRT1 repression. (a) Promoter activity of IMA1 in the root of pIMA1::mCitrine-NLS-mCitrine seedlings in response to +Fe, +Fe with flg22, -Fe and -Fe with flg22 treatment. 5-day-old seedlings were grown on the +Fe medium and then transferred to the different liquid media for 24 hours treatment. The nuclear localized mCitrine signals (Yellow channel) are visualized with propidium iodide (PI, red channel). For each treatment, a representative single confocal section (single image, GFP/PI), Maximum Intensity Z-Projection (Z-max, GFP only), a single optical section of the transverse view, and the Z-projection of the transverse section is shown. Scale bar, 50 μm. (b-c) Normalized IMA1 promoter activity quantification in all cell layers (b) or in epidermis-cortex cell layers (c) in response to +Fe, +Fe+flg22, -Fe and -Fe+flg22 treatments (n=9, 3 repeats). Different letters indicate statistically significant differences between different conditions analyzed by one-way ANOVA and Fisher’s LSD test(two-sided, p<0.05). (d) Western blots showing IRT1 protein levels in Col-0 roots is in response to +Fe, +Fe with flg22, -Fe, -Fe with flg22 treatment and -Fe with flg22 and DDG treatment. Tubulin protein was blotted as an internal control. (e) Representative images of cell-layer specific IMA1 expression transgenic plants. 3 individual lines are shown under +Fe condition. Scale bar, 100 μm.
Extended Data figure 7.
IMA1 is not regulated through cell-to-cell movement but regulated through protein level in the epidermis-cortex under -Fe by flg22. (a) Representative images of roots of plants with different tissue-specific promoters driving IMA1 expression. 5-day-old transgenic seedlings were grown on +Fe solid medium and then transferred to +Fe or +Fe+flg22 liquid medium for 24 hours treatment. For each treatment, the cytosolic and nuclear-localized mCitrine-IMA1 signals (yellow channel) are visualized with longitudinal section and transverse section. Scale bar, 50 μm. (b) Representative images of roots of plants with pIMA1, pELTP or pPGP4 promoters driving IMA1 expression in response to +Fe, +Fe+flg22, -Fe and -Fe+flg22. For each treatment, mCitrine-IMA1 signals (yellow channel) and bright field are visualized with longitudinal section. Scale bar, 50 μm. (c) Quantification of normalized IMA1 signal diameter in different treatment conditions in differentiation zones of the roots. Different letters indicate statistically significant differences between different conditions analyzed by one-way ANOVA and Fisher’s LSD test (two-sided, p<0.05). (d) Quantification of normalized IMA1 signal intensity of pPGP4::mCitrine-IMA1 in different treatment conditions. Different letters indicate statistically significant differences between different conditions analyzed by one-way ANOVA and Fisher’s LSD test (two-sided, p<0.05).
Extended Data figure 8.
Flg22 dependent IMA1 degradation in the ground tissue is regulated by BTSL1 and BTSL2 but not by BTS. (a) Western blots showing IMA1 protein is degraded through ubiquitin-dependent proteasome mechanism under -Fe condition. The pIMA1::EYFP-IMA1;ima8x was pre-treated with -Fe with DMSO only or -Fe with 10 μM MG132 for 36 hours, subsequently with 100 μM Cycloheximide (CHX) for the indicated time period. Tubulin protein was blotted as an internal control. (b) Western blots showing IRT1 protein levels in Col-0 and bts-1 roots in +Fe, +Fe with flg22, -Fe and -Fe with flg22 treatment. Tubulin protein was blotted as an internal control. (c) Quantitative analysis of Ferric Chelate Reductase activities in Col-0 and bts-1 roots grown for 7 days under +Fe conditions and transferred to +Fe, +Fe with flg22, -Fe and -Fe with flg22 liquid medium for 2 days. The bar chart centers show mean of 5 biological replicates. Error bars, s.e.m. Different letters indicate statistically significant differences between different conditions analyzed by one-way ANOVA and Tukey’s test (p<0.05). (d) IMA1 distribution in bts-1 in response to +Fe, +Fe with flg22, -Fe and -Fe with flg22 treatment in differentiation zone of the root. 5-day-old pIMA1::EYFP-IMA1;bts-1 seedlings were grown on the +Fe medium and then transferred to different liquid medium for 24 hours treatment. The cytosolic and nuclear localized EYFP-IMA1 signals (yellow channel) are visualized with propidium iodide (PI, red channel). For each treatment, a representative single confocal section (single image, EYFP/PI), a maximal Z-projection of the Z-stack (Z-max, EYFP only), a single optical section of the transverse view, and the Z-projection of the transverse section is shown. Scale bar, 50 μm. (e) Western blots showing IMA1 protein levels in the roots of pIMA1::EYFP-IMA1;ima8x and pIMA1::EYFP-IMA1;btsl1,2 in +Fe, +Fe with flg22, -Fe and -Fe with flg22 treatments. Tubulin protein was blotted as an internal control. (f) Western blots showing IMA1 protein levels in pIMA1::EYFP-IMA1;ima8x and pIMA1::EYFP-IMA1;btsl1,2 roots. The seedlings were pre-treated with -Fe for 36 hours, then treated with -Fe+flg22 (1μm flg22) for 0, 3 and 6 hours. Tubulin protein was blotted as an internal control. (g) Representative image of EYFP-IMA1 signal intensity profile in response to +Fe, +Fe with flg22, -Fe and -Fe with flg22 treatment in differentiation zone of roots in pIMA1::EYFP-IMA1;ima8x and pIMA1::EYFP-IMA1;btsl1,2. The white line in YFP channel indicates the line for signal quantification. The red dashed lines indicate the boundary between the ground tissue and the stele. Scale bar, 50 μm. (h-j) Quantification of normalized total IMA1 signal intensity (h), normalized IMA1 signal intensity in epidermis and cortex (i) and IMA1 signal diameter (j) in differentiation zone of roots in pIMA1::EYFP-IMA1;ima8x and pIMA1::EYFP-IMA1;btsl1,2. The seedlings were pre-treated with +Fe/-Fe 36 hours with/without flg22 and treated with 100 μM CHX for 2 hours before imaging. Different letters indicate statistically significant differences between different conditions analyzed by one-way ANOVA and Fisher’s LSD test (two-sided, p<0.05). (k) Schematic of flg22-mediated IMA1 depletion in the outer cell layers (epidermis, cortex, and endodermis) and IRT1 repression in epidermis in response to +Fe, -Fe and -Fe with flg22 treatment respectively. By contrast, IMA1 is not fully degraded in btsl1,2 in the outer cell layers upon flg22 treatment, resulting in IRT1 level maintenance in epidermis.
Extended Data figure 9.
IMA1 mediates defense responses to different pathogens in the shoot. (a) Confocal images of pIMA1::EYFP-IMA1;ima8x responses to +Fe, +Fe with flg22, -Fe and -Fe with flg22 in the shoot. Three different zones were imaged: epidermal cells, mesophyll cells and vasculature. The cytosolic and nuclear localized EYFP-IMA1 signals (yellow channel) are visualized with bright field (bright field channel). For each treatment, a representative single confocal section is shown. Scale bar, 50 μm (b) Gene ontology analysis of upregulated genes in IMA1ox compared with Col-0 in the shoot. GO term analysis is performed by using PANTHER17.0 (p-value<0.05). X axis, fold enrichment. (c) Western blots showing MAPK phosphorylation by flg22 in Col-0, ima8x and UBQ10::mCitrine-IMA1 shoot in response to flg22. The shoot parts were treated with 1μM flg22 for 0, 5 and 10 minutes. Tubulin protein was blotted as an internal control. (d) Gene expression analysis in response to +Fe and +Fe with flg22 by quantitative RT-PCR. The gene expression level is normalized to ACT2 internal control. The shoot parts were treated with 1μM flg22 for 1 hour. The bar chart centers show means of 3 biological replicates and error bars show s.e.m. Different letters indicate statistically significant differences between different conditions analyzed by one-way ANOVA and Tukey’s test (p<0.05). (e) Growth of Pseudomonas syringae pv. tomato DC3000 in the leaves of Col-0 and UBQ10::mCitrine-IMA1. Bacteria were syringe-infiltrated at OD600=0.001, and bacterial colony forming units (CFUs) were counted 0 and 48 hours after inoculation (hpi). n=22–24 biological replicates from three independent experiments. Different letters indicate statistically significant differences (adjusted P < 0.01; two-tailed Student’s t-test followed by Benjamini–Hochberg method). Results are shown as box plots with boxes displaying the 25th–75th percentiles, the center line indicating the median and whiskers extending to the minimum and maximum values no further than 1.5× interquartile range.
Extended Data figure 10.
IRT1 and IMA1 accumulation is distinctly regulated by CHA0 or flg22 peptide. (a) Western blots showing IRT1 protein levels in Col-0 roots in response to +Fe, +Fe+CHA0, -Fe, -Fe+CHA0 and -Fe+flg22 treatments. The inoculation of CHA0-gfp2 was detected by anti-GFP western blot. Tubulin protein was blotted as an internal control. (b) Western blots showing IMA1 protein levels in pIMA1::EYFP-IMA1;ima8x roots in response to +Fe, +Fe+CHA0, -Fe, -Fe+CHA0 and -Fe+flg22 treatment. The EYFP-IMA1 and the inoculation of CHA0-gfp2 were detected by anti-GFP western blot. Tubulin protein was blotted as an internal control. (c) The promoter activity of FRK1 in pFRK1::NLS-3xmVenus roots in responses to +Fe, +Fe+CHA0, -Fe, -Fe+CHA0 in differentiation zone or at lateral root primordia. Scale bar, 50 μm. (d) Quantification of the total signal intensity of the promoter activity of FRK1 in response to +Fe, +Fe+CHA0, -Fe, -Fe+CHA0 in differentiation zone or at lateral root primordia. Different letters indicate statistically significant differences between different conditions analyzed by one-way ANOVA and Fisher’s LSD test(p<0.05). (e) Graphical summary of main findings. Red color gradient indicates IMA1 abundance. Left and middle columns: IMA1 and IRT expression in the root under +Fe (upper left), -Fe (lower left), +Fe + flg22 (upper middle), -Fe + flg22 (lower middle). In +Fe IMA1 and IRT1 are expressed at very low levels in the early differentiation zone of the root. In -Fe, IMA1 highly accumulates in the ground tissue of the root under; roots actively lower the rhizosphere pH and increase iron availability, but this decreases PTI responsiveness. In -Fe and flg22 treatment, IMA1 is degraded in a BTSL dependent manner. The rhizosphere pH is not decreased. Right column: IMA1 accumulation in relation to relation to root and shoot host-microbe interactions. Upper right: In +Fe conditions IMA1 levels are low and don’t respond to commensal bacteria CHA0. Lower right: High levels IMA1 enhances a subset of PTI in the shoot. In -Fe IMA1 is accumulated in the root. In the early differentiation zone, surface dwelling CHA0 bacteria don’t affect IMA1 levels; high IMA1 levels increase bacterial colonization on the surface. When CHA0 colonizes inner root tissues at lateral root primordia cracks, IMA1 decreases in cells adjacent to this colonization. IMA1 accumulation is distinctly regulated by CHA0 in early differentiation zone compared to emerging LR region. The differences in IMA1 signal intensity between the depictions in the panels relating to CHA0 are due to different experiment setting (half sucrose concentration and different laser power for real bacteria experiment; see methods section).
Figure 1.
Figure 1.
flg22 represses iron uptake during iron deficiency. (a-c) 15-day-old Arabidopsis seedling leaves in sufficient iron (50 μM) or low iron (10 μM) with or without low levels of flg22 (10 nM) treatment. (a) Shoots; Scale bar 1cm, (b) total chlorophyll concentration of Col-0 shoots, (c) Iron concentration of Col-0 seedlings; 3 biological replicates. Error bars: s.e.m. Statistically analysis: two-sided t-test. (d) Ferric chelate reductase activity in Col-0 roots grown for 7 days under +Fe conditions and transferred to +Fe, +Fe with flg22, -Fe and -Fe with flg22 liquid media for 2 days. 5 biological replicates. Error bars: s.e.m. Different letters indicate statistically significant differences between different conditions analyzed by one-way ANOVA and Tukey’s test (p<0.05). (e) Promoter activity of IRT1 in the root of pIRT1::NLS-2xYpet seedlings in response to +Fe, +Fe with flg22, -Fe and -Fe with flg22 treatment. seedlings were grown on the +Fe medium and after 5 days transferred to the different liquid media for 24 hours treatment. MZ: Meristematic zone; EZ: elongation zone; Green: Nuclear localized Ypet; Red: propidium iodide (PI) cell wall stain. For each treatment, a representative single confocal section (single image, GFP/PI), Maximum Intensity Z-Projection (Z-max, GFP only), a single optical section of the transverse view, and the Z-projection of the transverse section are shown. Scale bar, 50 μm. (f) Raw signal intensity quantification of pIRT1 reporter. Different letters indicate statistically significant differences between different conditions by one-way ANOVA and Tukey’s test (p<0.05). (g) Western blots showing IRT1 protein levels in Col-0 roots grown in +Fe, +Fe with flg22, -Fe and -Fe with flg22 treatment. Arrow indicates the IRT protein band. The asterisk indicates a non-specific band. Tubulin protein: internal control.
Figure 2.
Figure 2.
flg22 represses iron deficiency responses through IMA1. (a) Venn diagram of differentially expressed genes from RNAseq experiment. (b) Heat map of mean-centered Z-scores for well-known iron responsive genes (3 independent biological repeats): iron deficiency signaling components, iron uptake components and long-distance signaling components. (c-e) Phenotypes in 15-day-old Col-0 and IMA1ox seedlings in response to sufficient iron (50 μM) or low iron (10 μM) with or without low level flg22 (10 nM) treatment. (c) Shoots; Scale bar, 1cm. (d) Total chlorophyll concentrations of shoots. (e) Iron concentration of seedlings. (d,e) 3 biological replicates; Error bar: s.e.m. P-values from two-tailed Student t-test. (f) Western blots showing IRT1 protein levels in Col-0 and IMA1ox roots in response to +Fe, +Fe with flg22, -Fe and -Fe with flg22 treatment. Internal control Tubulin. (g) Quantitative analysis of ferric chelate reductase activities in Col-0 and IMA1ox roots grown for 7 days under +Fe conditions and transferred to +Fe, +Fe with flg22, -Fe and -Fe with flg22 liquid media for 2 days. 5 biological replicates. Error bars: s.e.m. Different letters indicate statistically significant differences between different conditions analyzed by one-way ANOVA and Tukey’s test (p<0.05). (h) Heat map of mean-centered Z-scores (normalized to Col-0 +Fe) for well-known iron-responsive genes.
Figure 3.
Figure 3.
flg22 spatially represses IMA1 in the ground tissue of the root. (a,b) IMA1 protein levels in pIMA1::EYFP-IMA1;ima8x roots. Internal control: Tubulin. (a) Response to +Fe, +Fe with flg22, -Fe and -Fe with flg22 treatment. (b) Time course: Seedlings were pre-treatment with -Fe for 36 hours, then treated with -Fe or -Fe+flg22 (1μm flg22) for 0, 3 and 6 hours. (c) IMA1 distribution in response to +Fe, +Fe with flg22, -Fe and -Fe with flg22 treatment in differentiation zone of the root. Five-day-old pIMA1::EYFP-IMA1;ima8x seedlings were grown on +Fe medium and then transferred to liquid treatment medium for 24 hours. Yellow: EYFP-IMA1 signals; Red: Propidium iodide (PI) cell wall stain. For each treatment, a representative single confocal section (single image, EYFP/PI), a maximal Z-projection of the Z-stack (Z-max, EYFP only), a single optical section of the transverse view, and the Z-projection of the transverse section is shown. Scale bar, 50 μm. (d) Quantification of IMA1 fluorescence signal intensity in the differentiation zone of roots (n=15 biologically independent seedlings). Statistical analysis: Kruskal Wallis/two-tailed test followed by Multiple pairwise comparisons using the Steel-Dwass-Critchlow-Fligner procedure/two-tailed test (p<0.05). (e) Schematic of quantification method for normalized signal diameter. (f) Quantification of normalized IMA1 signal diameter in different treatment conditions in differentiation zones of the roots (n=15 biologically independent seedlings). Statistical analysis: Kruskal Wallis/two-tailed test followed by Multiple pairwise comparisons using the Steel-Dwass-Critchlow-Fligner procedure/two-tailed test (p<0.05). (g,h) Western blots showing IRT1 protein levels in roots of transgenic plant with different tissue-specific promoter driving IMA1 expression. Internal control Tubulin. (g) All seedlings were grown in +Fe to avoid the endogenous IRT1 induction by low iron. Three independent lines of each transgenic plants are shown (refer to extended data fig. 6e). (h) pPGP4::mCtirine-IMA1 roots in response to +Fe and +Fe with flg22 treatment.
Figure 4.
Figure 4.
flg22 represses iron deficiency responses via IMA1 degradation through BTSL1 and BTSL2. (a-c) 15-day-old seedlings in +Fe (50 μM) or -Fe (10 μM) in without or low level flg22 (10 nM) treatment. (a) Shoots; Scale bar, 1cm. (b) Total chlorophyll concentrations of shoots. (c) Iron concentration of seedlings. (b,c) 3 biological replicates; Error bar: s.e.m. Two-tailed Student t-test. (d) Ferric chelate reductase activities in Col-0 and btsl1,2 roots grown for 7 days under +Fe and transferred to +Fe, +Fe with flg22, -Fe and -Fe with flg22 liquid media for 2 days. 5 biological replicates. Error bar: s.e.m. One-way ANOVA and Tukey’s test (p<0.05). (e) Western blots showing IRT1 protein levels in Col-0 and btsl1,2 roots in +Fe, +Fe with flg22, -Fe and -Fe with flg22 treatment. Control: Tubulin. (f) Transverse confocal microscopy sections of root differentiation zones of pBTSL1-GFP and pBSTL2-GFP in response to +Fe, +Fe with flg22, -Fe and -Fe with flg22 treatments. Green: GFP channel; scale bar, 50 μm. (g) Confocal microscopy images of IMA1 in +Fe, +Fe with flg22, -Fe and -Fe with flg22 treatment in root differentiation zone. 5-day-old pIMA1::EYFP-IMA1;ima8x and pIMA1::EYFP-IMA1;btsl1,2 seedlings grown on +Fe medium, then transferred to liquid treatment media for 24 hours. Yellow: EYFP-IMA1; Red: Propidium iodide (PI) cell wall stain. Shown per treatment: representative single confocal section (single image, EYFP/PI), maximal Z-projection (Z-max, EYFP only), single optical section of the transverse view, Z-projection of the transverse section. Scale bar, 50 μm. (h-i) IMA1 fluorescence signal intensity (h) and normalized IMA1 signal diameter (i) in +Fe, +Fe with flg22, -Fe and -Fe with flg22 treatment in root differentiation zone of pIMA1::EYFP-IMA1;ima8x and pIMA1::EYFP-IMA1;btsl1,2. Same dataset as shown in Fig.3 e&f of pIMA1::EYFP-IMA1;ima8x as images were taken at the same time. Statistical analysis: Kruskal Wallis/two-tailed test followed by Steel-Dwass-Critchlow-Fligner procedure/two-tailed test (p<0.05).
Figure 5.
Figure 5.
IMA1 dependent rhizosphere acidification regulates root immune-responses and bacterial colonization. (a,b) Rhizosphere acidification responses of Col-0, ima8x and UBQ10::mCitrine-IMA1 in +Fe and -Fe treatment. Bromocresol purple was used as pH indicator. (b) Standard media acidification by Col-0, ima8x and UBQ10::mCitrine-IMA1 in response to +Fe, +Fe with flg22, -Fe and -Fe with flg22 treatments. 6 biological replicates. Error bar: s.e.m. Statistical analysis: one-way ANOVA and Tukey’s test (p<0.05). Two-tailed Student t-test shows statistically significant difference of media acidification of Col-0 and UBQ10::mCitrine-IMA1 under +Fe. (c,d) Quantification of root length of Col-0, ima8x and UBQ10::mCitrine-IMA1 in +Fe and +Fe+flg22 conditions (c) without MES-KOH and (d) with 1mM MES-KOH. P-values: two-tailed Student t-test. (e) Quantification of flg22-mediated root growth responses (+flg22/-flg22, root length of +flg22 divided by mean of -flg22) of Col-0, ima8x and UBQ10::mCitrine-IMA1 with/without MES-KOH. Horizontal line: mean; Error bars s.e.m. P-values: two-tailed Student t-test. (f) CYP71A12 transcript level in +Fe and +Fe with flg22 by quantitative RT-PCR. Roots were treated with 1μM flg22 for 1 hour. Normalized to ACT2. 3 biological replicates. Error bars: s.e.m. Statistical analysis: one-way ANOVA and Tukey’s test (p<0.05). (g) Western blots showing MAPK phosphorylation by flg22 in Col-0, ima8x and UBQ10::mCitrine-IMA1 roots in response to flg22. The roots were treated with 1μM flg22 for 0, 5 and 10 minutes. Internal control Tubulin. (h) Colonization of 7-day-old Arabidopsis roots at 1 d post-inoculation by CHA0 under +Fe, -Fe and non-available iron (nAvFe) conditions. 3 biological replicates. Error bars: s.e.m. Statistical analysis: one-way ANOVA and Tukey’s test (p<0.05).
Figure 6.
Figure 6.
IMA1 accumulation is distinctly modulated by surface dwelling or invading bacteria. (a) pIRT1::NLS-2xYpet roots in +Fe, +Fe+CHA0, -Fe, -Fe+CHA0 and -Fe+flg22. Red: Cell surface-localized CHA0-mcherry bacteria; Green: nuclear localized Ypet. Representative single confocal section (single image, GFP/mCherry), a maximal Z-projection of the Z-stack (Z-max, GFP only) and a single optical section of the transverse view are shown. Scale bar, 50 μm. (b) Normalized signal quantification in pIRT1::NLS-2xYpet roots in +Fe, +Fe+CHA0, -Fe, -Fe+CHA0 and -Fe+flg22. One-way ANOVA and Fisher’s LSD test (two-sided, p<0.05). (c) IMA1 distribution in +Fe, +Fe+CHA0, -Fe, -Fe+CHA0 and -Fe+flg22 in root differentiation zone of pIMA1::EYFP-IMA1;ima8x. Red: root surface-localized CHA0-mcherry bacteria; Yellow: EYFP-IMA1 (yellow channel). Representative single confocal section (single image, EYFP/mCherry), maximal Z-projection of the Z-stack (Z-max, EYFP only), single optical section of the transverse view are shown. Scale bar, 50 μm. (d) Normalized IMA1 signal intensity in +Fe, +Fe+CHA0, -Fe, -Fe+CHA0 and -Fe+flg22. One-way ANOVA and Fisher’s LSD test (two-sided, p<0.05). (e) Normalized IMA1 signal intensity in epidermis-cortex cell layers in +Fe, +Fe+CHA0, -Fe, -Fe+CHA0 and -Fe+flg22. One-way ANOVA and Fisher’s LSD test (two-sided, p<0.05). (f) Normalized IMA1 signal diameter quantification in +Fe, +Fe+CHA0, -Fe, -Fe+CHA0 and -Fe+flg22. One-way ANOVA and Fisher’s LSD test (two-sided, p<0.05). (g) Representative images of EYFP-IMA1 in +Fe, +Fe+CHA0, -Fe, -Fe+CHA0 at emerging lateral root primordia. Red: Interior-localized CHA0-mcherry bacteria; Yellow: EYFP-IMA1 signals. Asterisks: CHA0-mcherry entered the roots through lateral root primordia site. Arrow: Weak IMA1 signal in cortex. Scale bar, 50 μm. Single confocal section (single image, EYFP/mCherry), maximal Z-projection of the Z-stack (Z-max, EYFP only), single optical section of the transverse view are shown. Scale bar, 50 μm. (h) Normalized IMA1 signal intensity quantification in +Fe, +Fe+CHA0, -Fe, -Fe+CHA0 and -Fe+flg22 in lateral root primordia region. One-way ANOVA and Fisher’s LSD test (two-sided, p<0.05).

References

    1. Yilmaz B. & Li H. Gut Microbiota and Iron: The Crucial Actors in Health and Disease. Pharmaceuticals (Basel) 11, doi:10.3390/ph11040098 (2018). - DOI - PMC - PubMed
    1. Seyoum Y, Baye K. & Humblot C. Iron homeostasis in host and gut bacteria - a complex interrelationship. Gut Microbes 13, 1–19, doi:10.1080/19490976.2021.1874855 (2021). - DOI - PMC - PubMed
    1. Harbort CJ et al. Root-Secreted Coumarins and the Microbiota Interact to Improve Iron Nutrition in Arabidopsis. Cell Host Microbe 28, 825–837 e826, doi:10.1016/j.chom.2020.09.006 (2020). - DOI - PMC - PubMed
    1. Stringlis IA et al. MYB72-dependent coumarin exudation shapes root microbiome assembly to promote plant health. Proceedings of the National Academy of Sciences of the United States of America 115, E5213–e5222, doi:10.1073/pnas.1722335115 (2018). - DOI - PMC - PubMed
    1. Ganz T. & Nemeth E. Iron homeostasis in host defence and inflammation. Nature Reviews Immunology 15, 500–510, doi:10.1038/nri3863 (2015). - DOI - PMC - PubMed

MeSH terms

Substances