. 2024 Jan;625(7996):768-777.
doi: 10.1038/s41586-023-06899-4. Epub 2024 Jan 10.

Nasopharyngeal lymphatic plexus is a hub for cerebrospinal fluid drainage

Affiliations

Nasopharyngeal lymphatic plexus is a hub for cerebrospinal fluid drainage

Jin-Hui Yoon et al. Nature. 2024 Jan.

Abstract

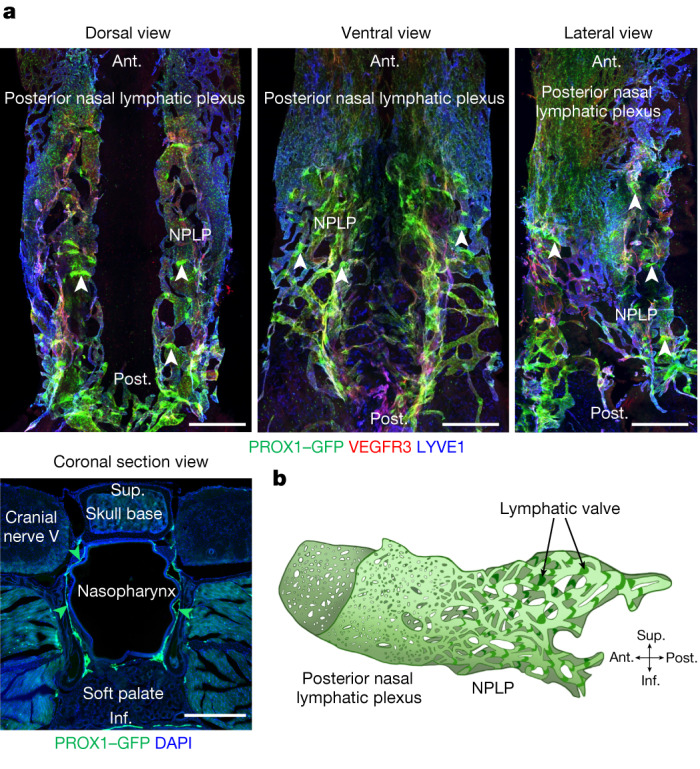
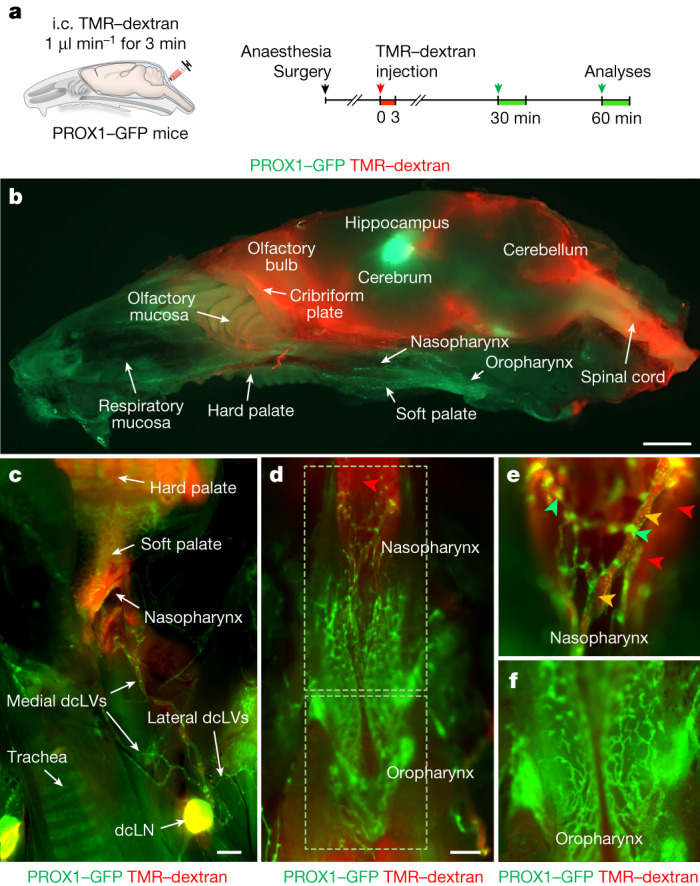
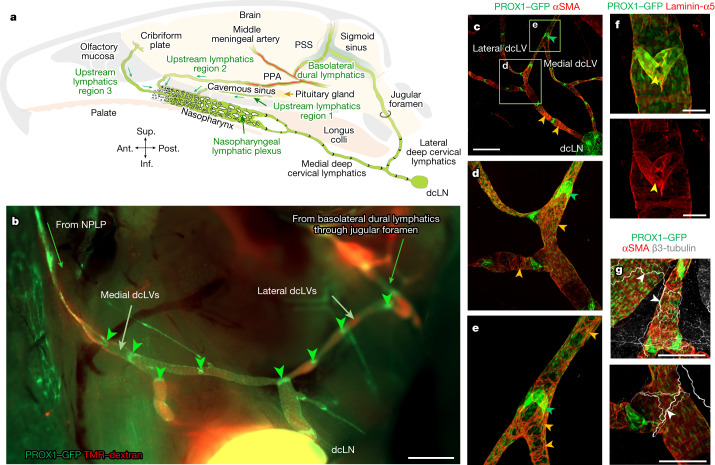
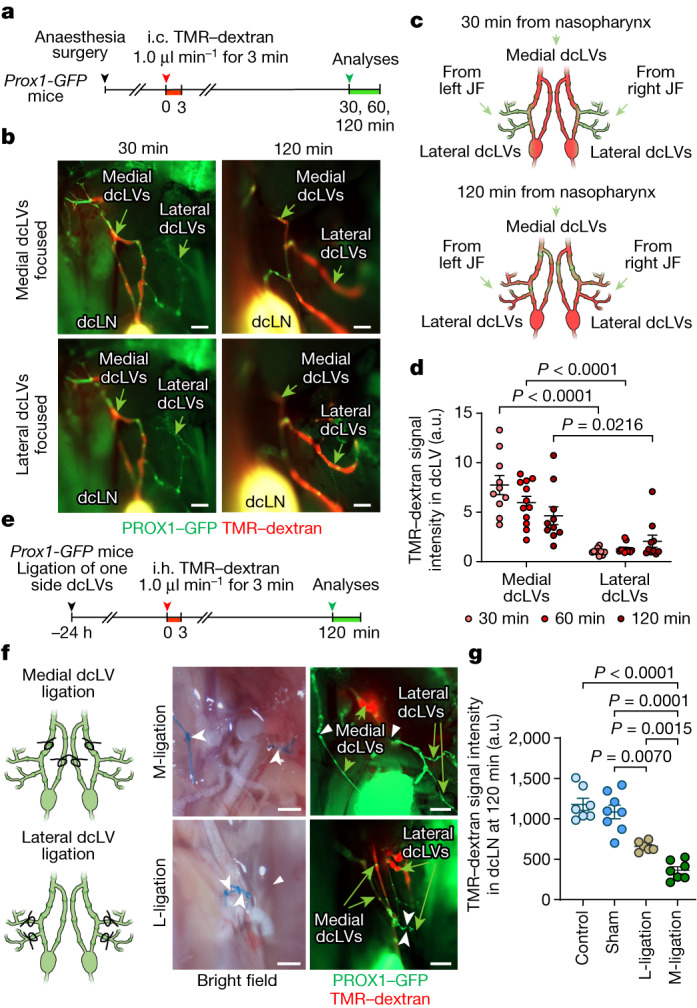
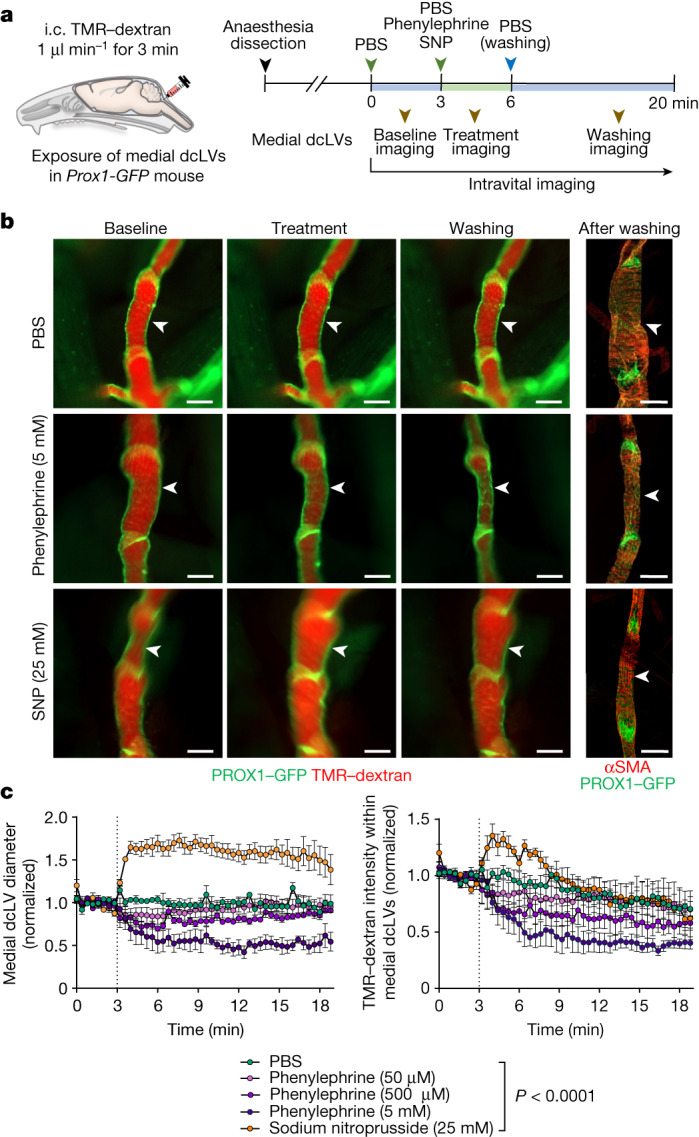
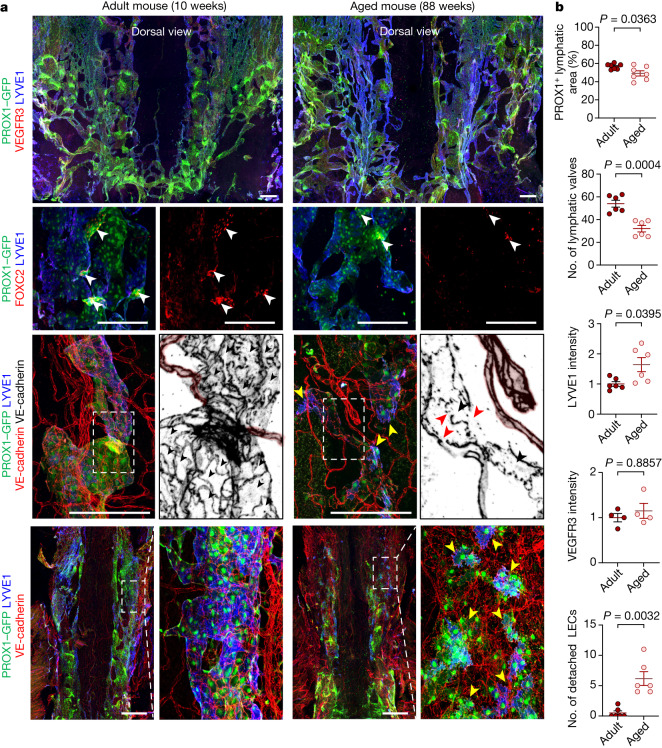
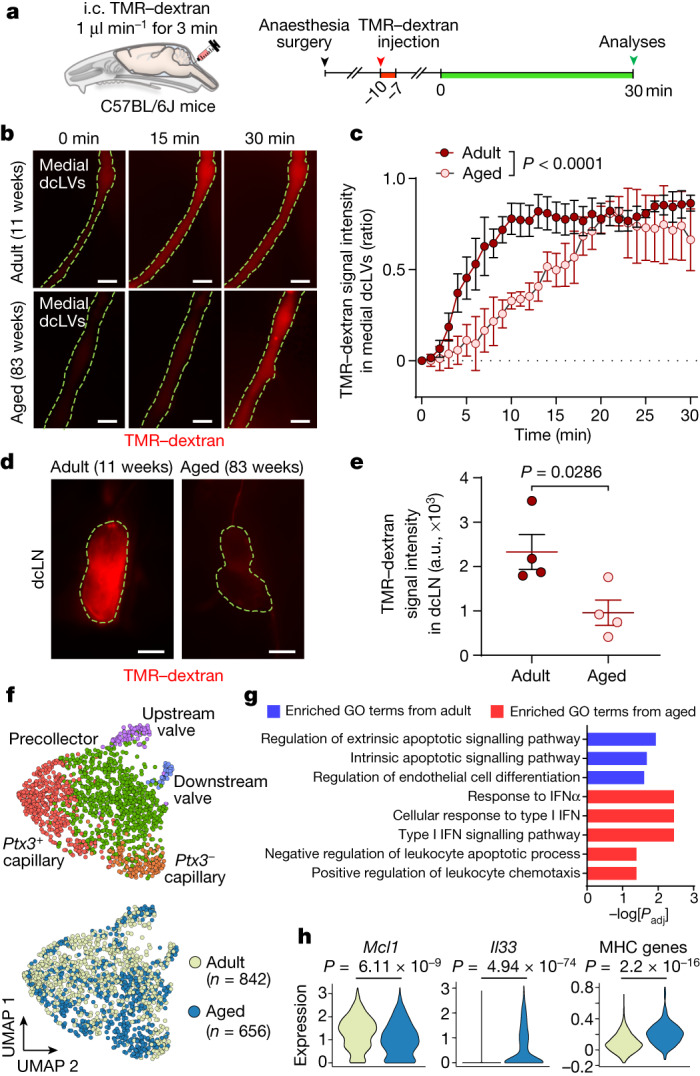
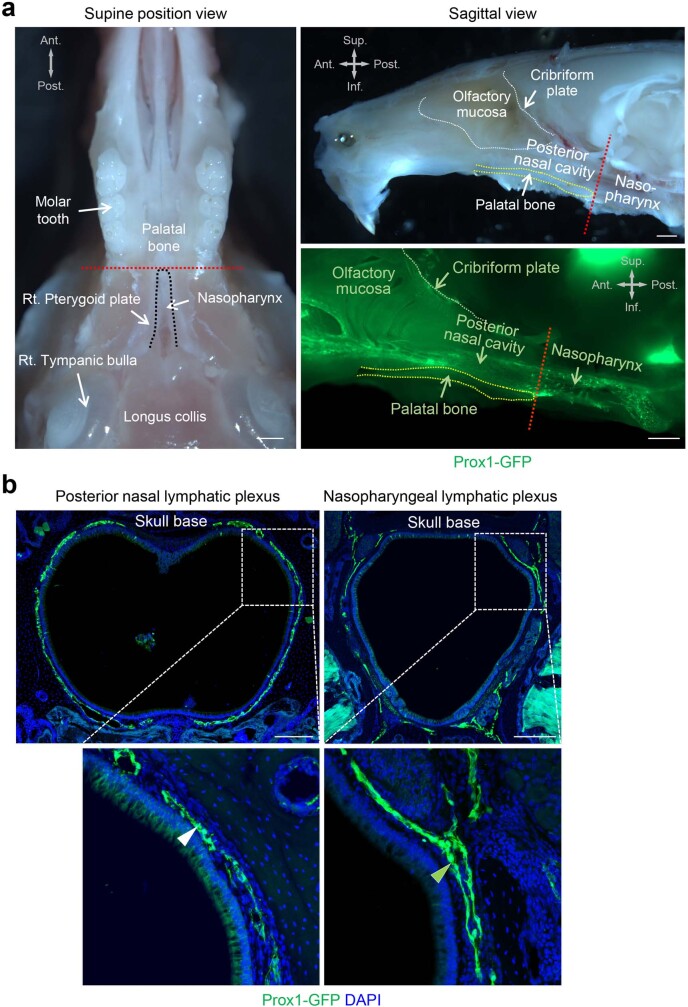
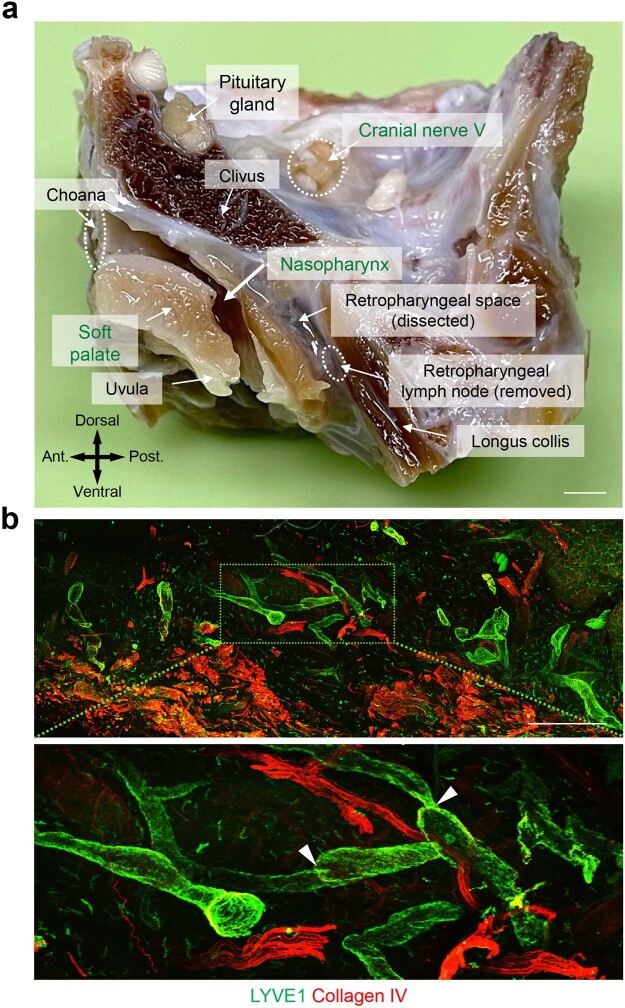
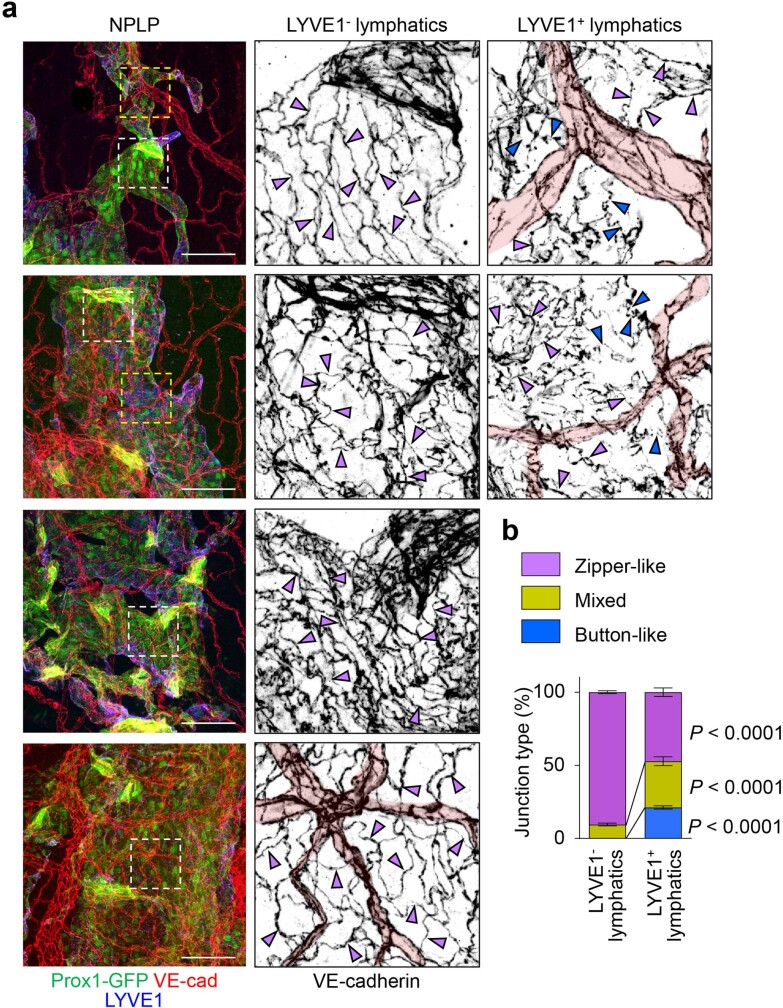
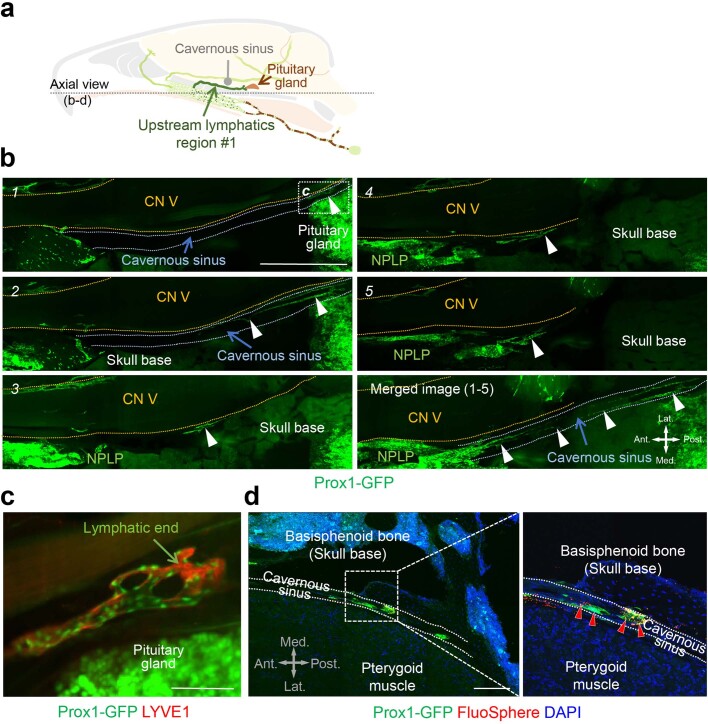
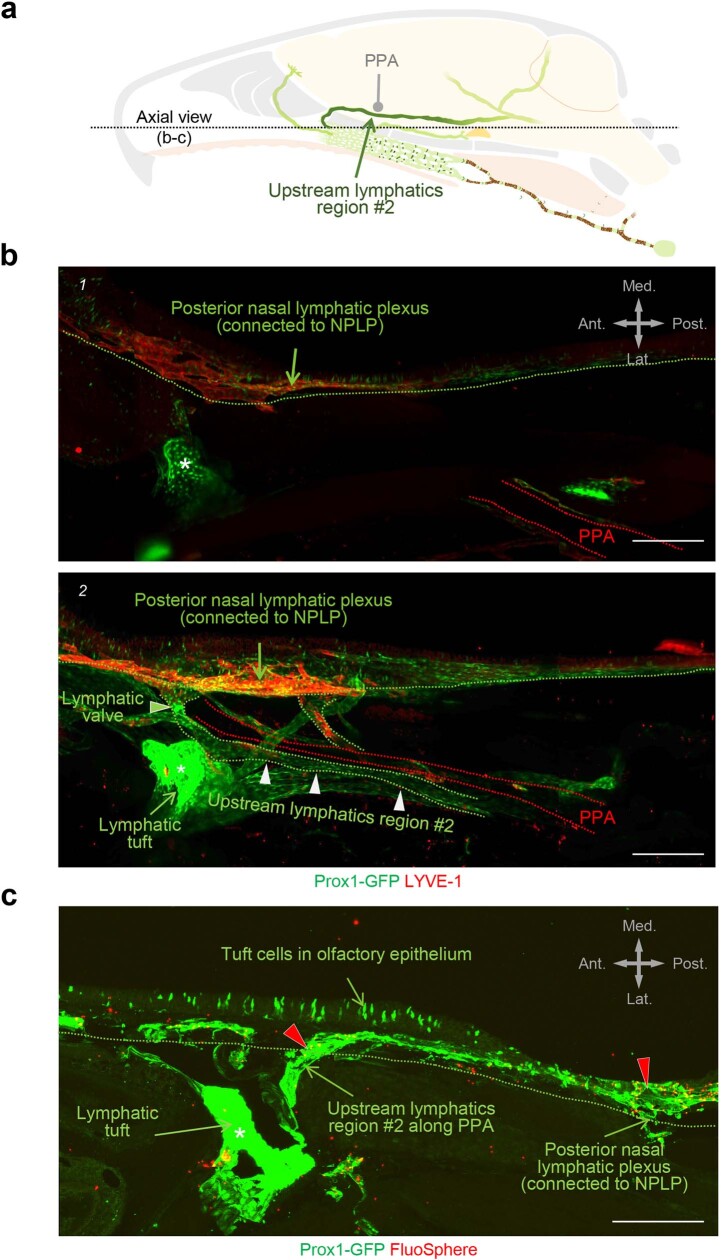
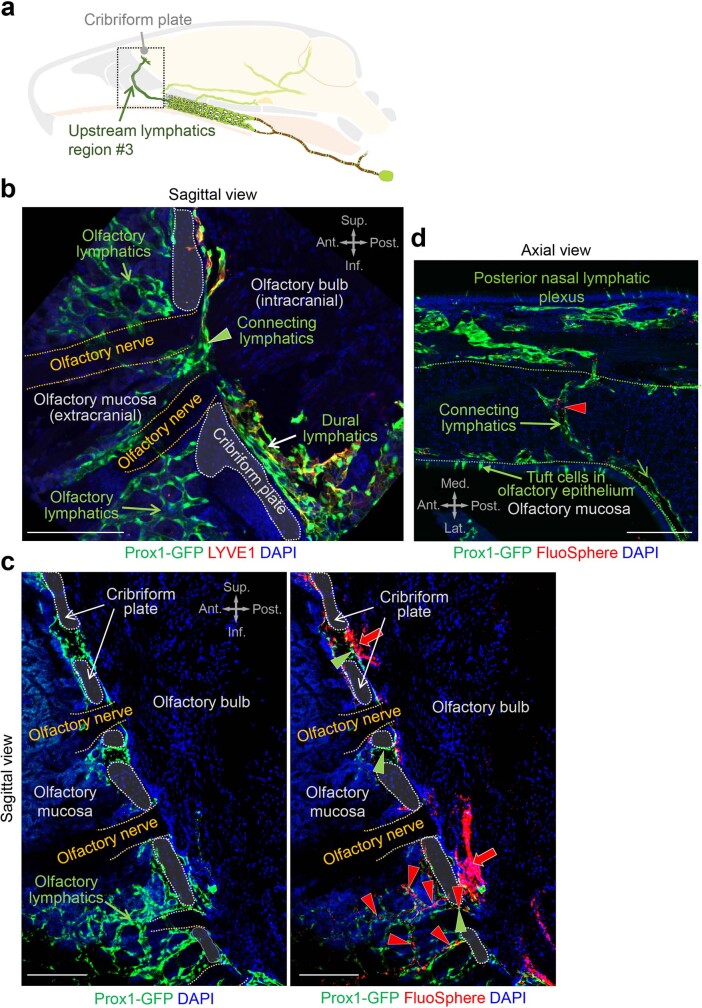
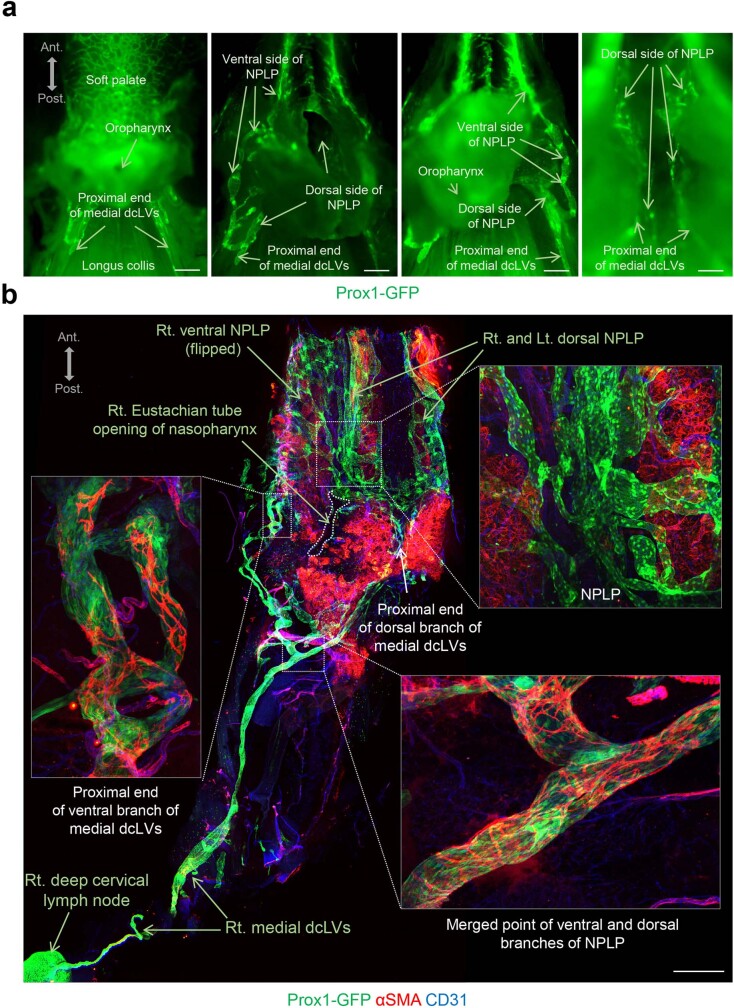
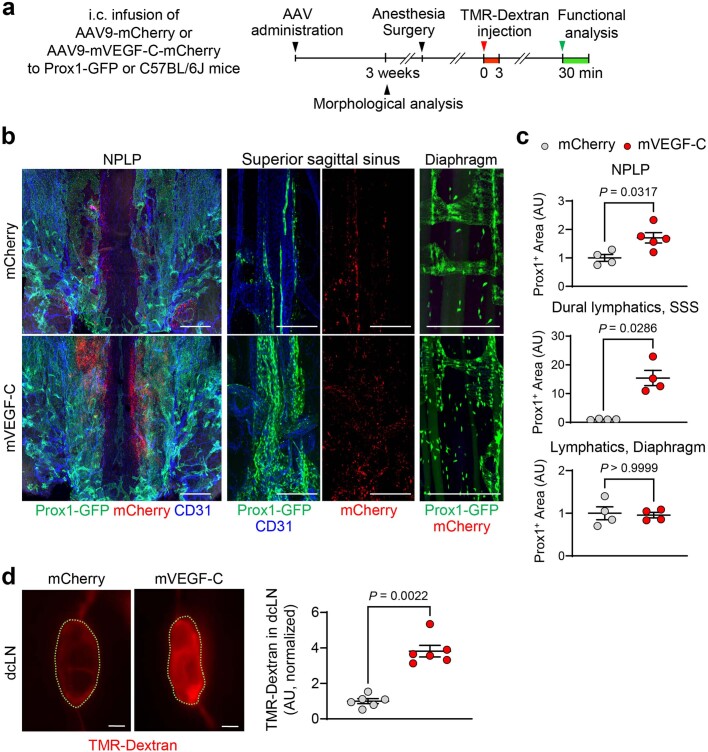
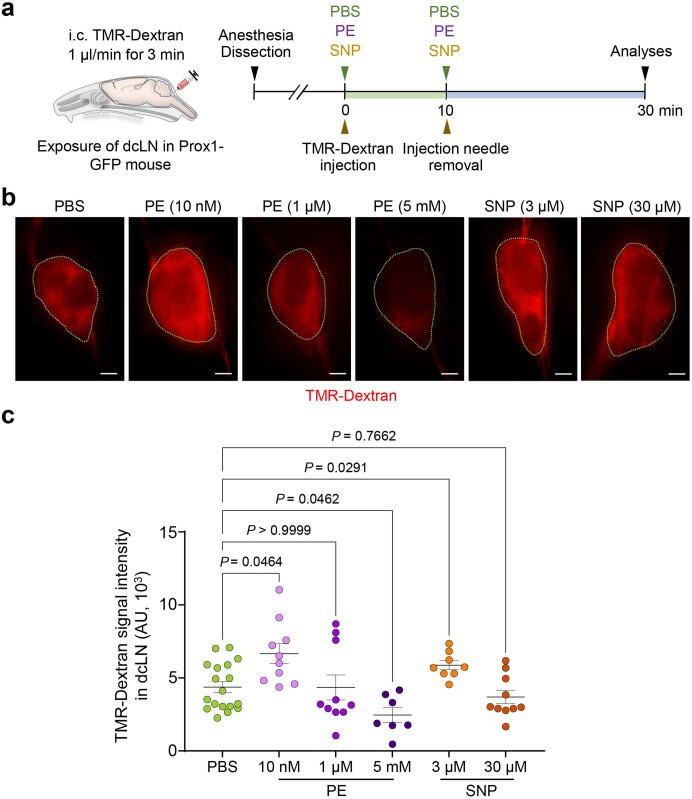
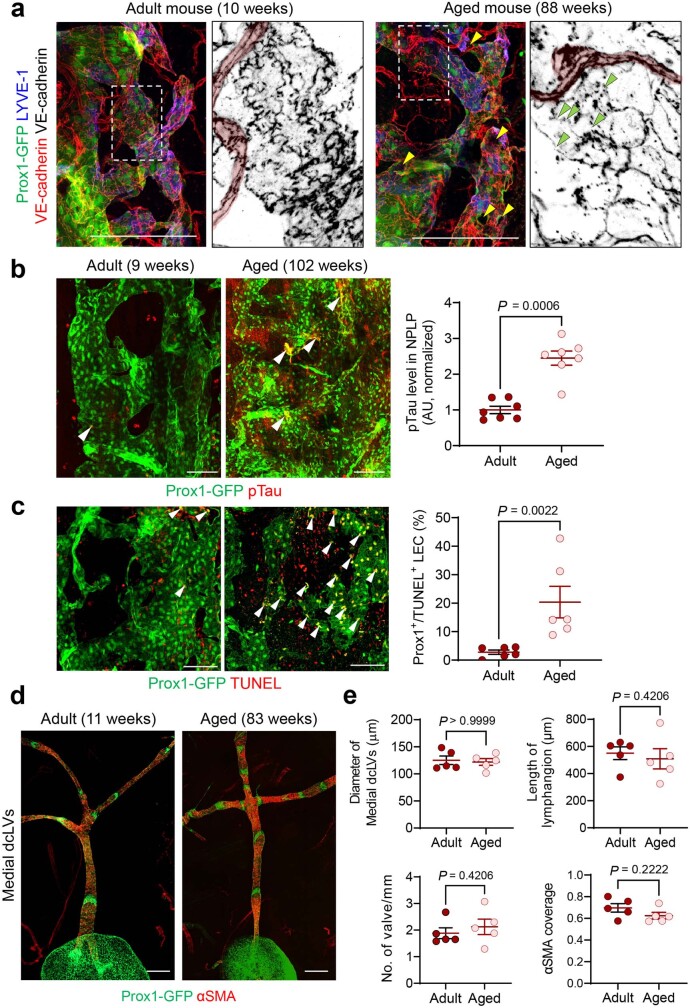
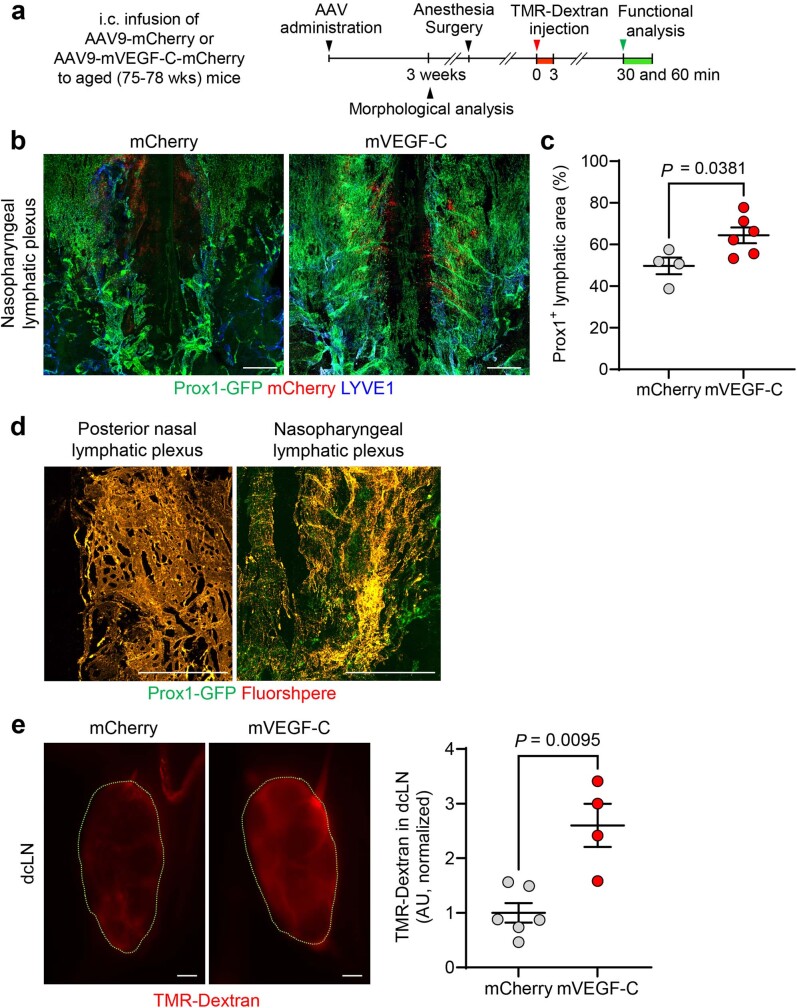
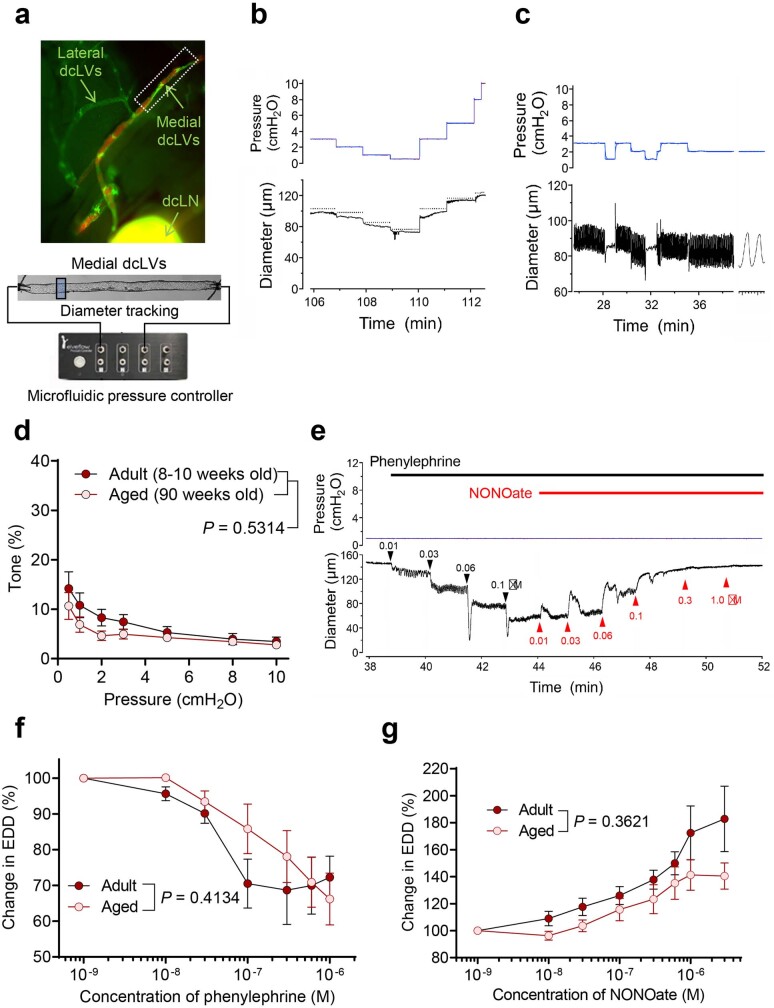
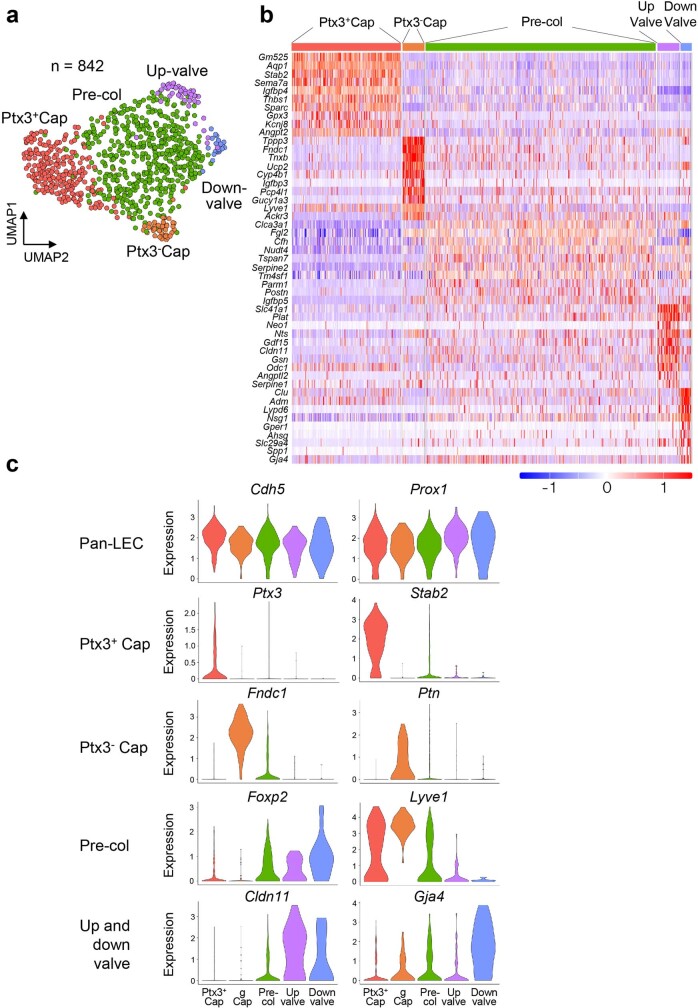
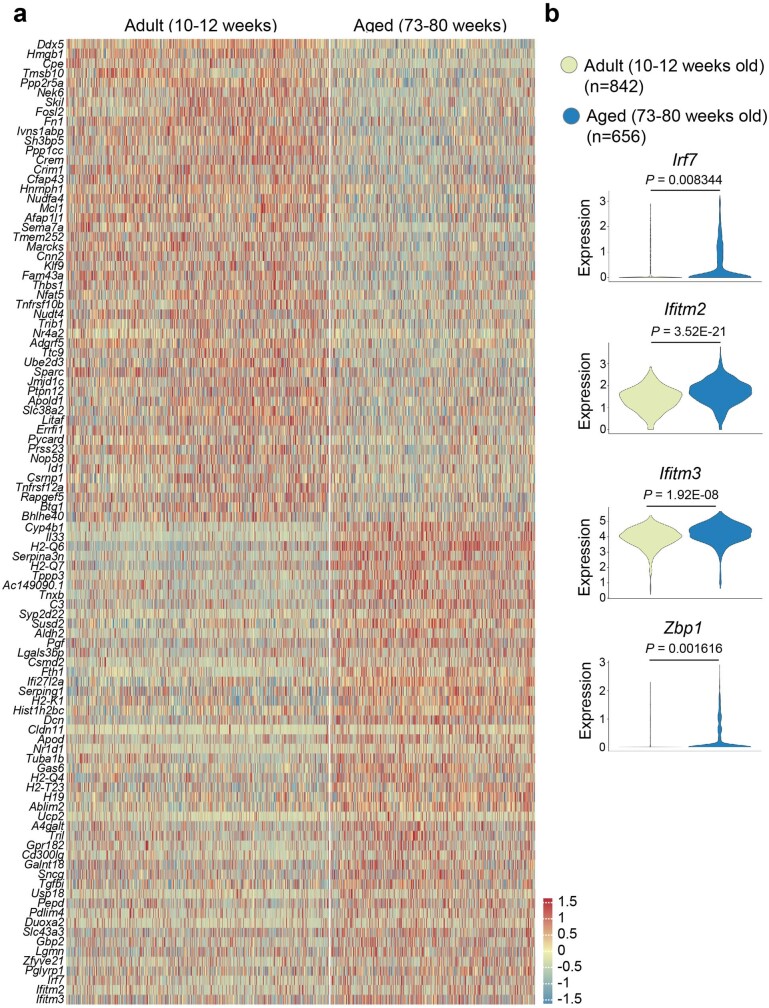
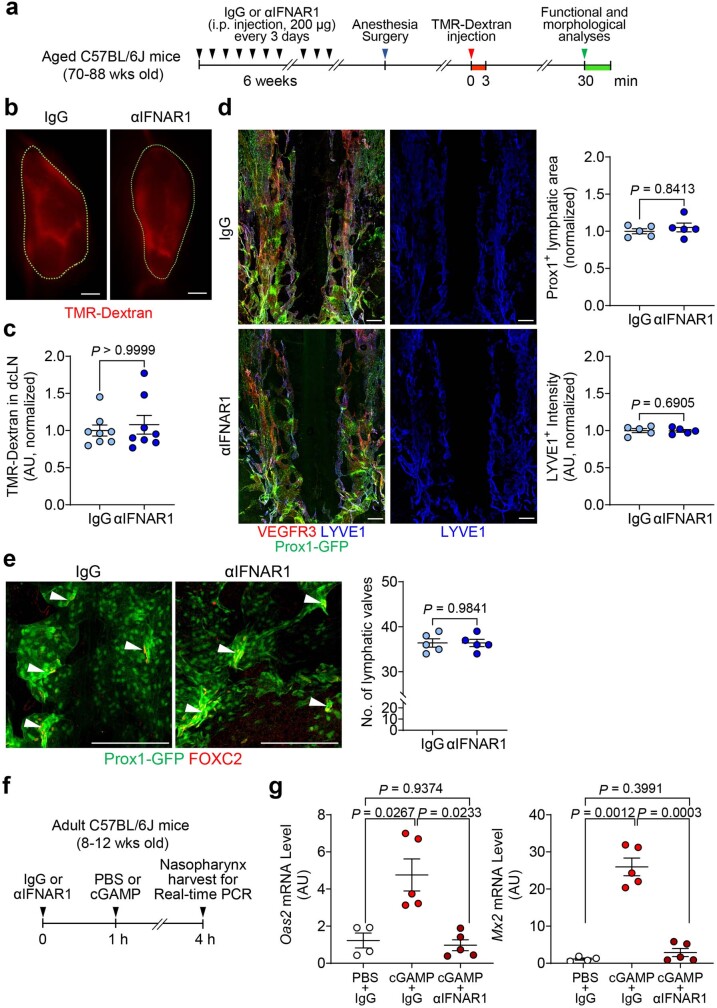
Cerebrospinal fluid (CSF) in the subarachnoid space around the brain has long been known to drain through the lymphatics to cervical lymph nodes1-17, but the connections and regulation have been challenging to identify. Here, using fluorescent CSF tracers in Prox1-GFP lymphatic reporter mice18, we found that the nasopharyngeal lymphatic plexus is a major hub for CSF outflow to deep cervical lymph nodes. This plexus had unusual valves and short lymphangions but no smooth-muscle coverage, whereas downstream deep cervical lymphatics had typical semilunar valves, long lymphangions and smooth muscle coverage that transported CSF to the deep cervical lymph nodes. α-Adrenergic and nitric oxide signalling in the smooth muscle cells regulated CSF drainage through the transport properties of deep cervical lymphatics. During ageing, the nasopharyngeal lymphatic plexus atrophied, but deep cervical lymphatics were not similarly altered, and CSF outflow could still be increased by adrenergic or nitric oxide signalling. Single-cell analysis of gene expression in lymphatic endothelial cells of the nasopharyngeal plexus of aged mice revealed increased type I interferon signalling and other inflammatory cytokines. The importance of evidence for the nasopharyngeal lymphatic plexus functioning as a CSF outflow hub is highlighted by its regression during ageing. Yet, the ageing-resistant pharmacological activation of deep cervical lymphatic transport towards lymph nodes can still increase CSF outflow, offering an approach for augmenting CSF clearance in age-related neurological conditions in which greater efflux would be beneficial.


Conflict of interest statement

The authors declare no competing interests.

Figures

Fig. 1
Fig. 1. Three-dimensional morphological features of the nasopharyngeal and posterior nasal lymphatic plexuses.
a, Immunofluorescence images of three views of whole mounts and a coronal section of the NPLP and posterior nasal lymphatic plexus of Prox1-GFP mice after staining for VEGFR3 and LYVE1. The flattened and condensed posterior nasal lymphatic plexus is in front of the NPLP distinguished by strong PROX1+, irregular and linearly shaped lymphatic valves (white arrowheads). The green arrowheads in the cross-section mark the borders of the NPLP. Scale bars, 500 μm. Similar findings were obtained from n = 6 mice in three independent experiments. b, Diagram of the inverted saddle shape of the NPLP. Anatomical positions are indicated at the bottom right. Ant., anterior; post., posterior; sup., superior; inf., inferior anatomical position.
Fig. 2
Fig. 2. Preferential and selective distribution of TMR–dextran in the head and neck after intracisternal infusion.
a, Diagram of the experimental sequence for intracisternal (i.c.) infusion of TMR–dextran (molecular mass, 10 kDa) into Prox1-GFP mice through the cisterna magna at 1.0 μl min−1 for 3 min followed by analysis of the distribution of TMR–dextran in the head and neck 30 or 60 min later. b, Fluorescence image showing the distribution of TMR–dextran in a mid-sagittal view of half of the head and neck at 60 min after intracisternal infusion. The PROX1–GFP signal is strong in the hippocampus and in the lymphatics in the nasopharynx, oropharynx and palate. Scale bar, 2 mm. Similar findings were obtained from n = 6 mice in three independent experiments. cf, Fluorescence images showing the distributions of TMR–dextran in the indicated regions of dissected neck at 30 min after intracisternal infusion. TMR–dextran fluorescence (red) is strong in medial dcLVs, dcLNs (c) and lymphatic plexus in the nasopharynx (yellow arrowheads) (d,e) but not in the oropharynx (f). Strong PROX1+ lymphatic valves are indicated by green arrowheads. The red arrowheads indicate the background signal emitted from the skull base. Scale bars, 1 mm (c) and 500 μm (d). Similar findings were obtained from n = 10 mice in five independent experiments.
Fig. 3
Fig. 3. Connections of the NPLP and features of deep cervical lymphatics.
a, Diagram of intracranial upstream lymphatic regions 1, 2 and 3, which drain through the NPLP en route to medial deep cervical lymphatics and dcLNs in the neck. Upstream lymphatic region 1 includes the lymphatics near the pituitary gland and cavernous sinus that drain to the NPLP. Upstream lymphatic region 2 includes the lymphatics in the anterior region of basolateral dura near the middle meningeal artery and petrosquamosal sinus (PSS) that course along the PPA to the NPLP. Upstream lymphatic region 3 includes lymphatics near the cribriform plate that drain to the lymphatics in the olfactory mucosa en route to the posterior nasal lymphatic plexus and NPLP. By contrast, the lymphatics in the posterior region of the basolateral dura around the sigmoid sinus do not drain to the NPLP but, instead, pass through the jugular foramen to lateral deep cervical lymphatics en route to dcLNs. Anatomical positions are indicated at the bottom left. b, Fluorescence image showing medial dcLVs, lateral dcLVs, lymphatic valves (green arrowheads) and TMR–dextran (red) in lymphatics deep in the neck of a Prox1-GFP mouse. The image was obtained 30 min after i.c. infusion of TMR–dextran (molecular mass, 10 kDa) at 1.0 μl min−1 for 3 min. Medial dcLVs connect to the NPLP, and lateral dcLVs connect to the basolateral dural lymphatics through the jugular foramen. Scale bar, 1 mm. Similar findings were obtained from n = 6 mice in three independent experiments. c–e, Immunofluorescence images of whole mounts showing the distributions of PROX1-dense, semi-lunar shaped lymphatic valves (green arrowheads) and αSMA+ circular smooth muscle cells (SMCs, orange arrowheads) in the medial and lateral dcLVs. d,e, Magnified images of the regions indicated by the green boxes in c. Scale bar, 1 mm (c). Similar findings were obtained from n = 4 mice in two independent experiments. f, Immunofluorescence images of whole mounts showing a typical semi-lunar-shaped PROX1-dense, laminin-α5high valve (yellow arrowheads) in a medial dcLV of a Prox1-GFP mouse. Scale bars, 200 μm. Similar findings were obtained from n = 4 mice in two independent experiments. g, Immunofluorescence images of whole mounts showing the distributions of β3-tubulin+ axons (white arrowheads) and αSMA+ circular smooth-muscle cells (red) along dcLVs. Scale bars, 200 μm. Similar findings were obtained from n = 4 mice in two independent experiments.
Fig. 4
Fig. 4. Greater and faster drainage of TMR–dextran in CSF through the medial deep cervical lymphatics compared with the lateral deep cervical lymphatics.
a, Diagram of the experimental sequence for intracisternal infusion of TMR–dextran at 1.0 μl min−1 for 3 min into Prox1-GFP mice followed by measurement of the fluorescence intensity in the medial and lateral dcLVs. bd, Fluorescence images (b), diagrams (c) and comparison of TMR–dextran signal intensity (d) in the medial and lateral dcLVs at 30 min (n = 10), 60 min (n = 12) and 120 min (n = 10) after intracisternal infusion from five independent experiments. TMR–dextran fluorescence is stronger in medial compared with in lateral dcLVs (green arrows) from 30 to 120 min. For b, scale bars, 500 µm. Data are mean ±  s.e.m. P values were calculated using two-way analysis of variance (ANOVA) followed by two-tailed Sidak’s post hoc test. JF, jugular foramen. e, Diagram of the experimental sequence for ligation of medial dcLVs or lateral dcLVs followed 24 h later by intrahippocampal (i.h.) infusion of TMR–dextran at 0.1 μl min−1 for 3 min into Prox1-GFP mice. The fluorescence intensity in the dcLN was measured 120 min after onset of i.h. infusion. f,g, Diagram, and bright-field and fluorescence images of the ligation sites of medial (M-ligation) and lateral (L-ligation) dcLVs (black and white arrowheads) (f) and measurements of TMR–dextran in f and measurements of TMR–dextran in dcLNs, with or without ligation, at 120 min after infusion (g). TMR–dextran accumulated in dcLVs proximal, but not distal, to the ligation. For f, scale bars, 500 µm. Comparison of TMR–dextran fluorescence in the dcLN after ligation of medial or lateral dcLVs. Each dot is the value for one mouse. n = 7 (control), n = 8 (sham), n = 6 (L-ligation) and n = 7 (M-ligation) from five independent experiments. Data are mean ±  s.e.m. P values were calculated using one-way ANOVA followed by two-tailed Dunnett’s T3 multiple-comparison post hoc test.
Fig. 5
Fig. 5. Regulation of CSF outflow by myogenic control of medial deep cervical lymphatics.
a, Diagram of the experimental sequence for intracisternal infusion of TMR–dextran at 1.0 μl min−1 for 3 min, and intravital imaging of medial deep cervical lymphatics (medial dcLVs) during pharmacological manipulation in Prox1-GFP mice. SNP, sodium nitroprusside. b, Fluorescence images showing TMR–dextran fluorescence in medial dcLVs (white arrowheads) at 2 min before treatment, during treatment and during washing. Right, immunofluorescence images of whole mounts stained for PROX1-dense lymphatic valves and αSMA+ circumferential smooth-muscle cells in medial dcLVs at 10 min after washing. Scale bars, 200 μm. Similar findings were obtained from n = 4 mice in three independent experiments. c, Changes in diameter and TMR–dextran fluorescence in the medial dcLVs over 17 min after the onset of five different pharmacological manipulations (vertical dotted lines). Data are mean ±  s.e.m. n = 4 mice per group from four independent experiments. Values were normalized to the mean baseline value for each group. P values were calculated using two-way repeated-measures ANOVA.
Fig. 6
Fig. 6. Ageing-related alterations in the NPLP.
a, Immunofluorescence images of whole mounts showing the dorsal surface of the NPLP in adult (aged 10 weeks) and aged (aged 88 weeks) mice. Multiple abnormalities are evident in the aged mice. Row 1, the lymphatic plexus is smaller and has fewer valves. Row 2, PROX1-dense, FOXC2+ lymphatic valves (white arrowheads) are less numerous. Rows 3 and 4, the lymphatic plexus is smaller (the regions indicated by white dashed boxes are magnified in the adjacent monochrome panels); fewer LECs have an oak-leaf shape (black arrowheads); LECs have altered intercellular junctions (red arrowheads); and some cells appear to be detached from the adjacent cells (yellow arrowheads). The blood capillaries are marked by a pink overlay. Scale bars, 200 μm. Similar findings were obtained from n = 7 mice in three independent experiments. b, Comparison of the lymphatic area, valves, LYVE1 and VEGFR3 staining, and detached endothelial cells in the plexus between adult (aged 8–12 weeks) and aged (aged 73–102 weeks) mice. Each dot is the value for one mouse; n = 7 (PROX1+ lymphatic area), n = 6 (number of lymphatic valves), n = 6 (LYVE1 intensity), n = 4 (VEGFR3 intensity) and n = 6 (number of detached LEC) mice per group from three independent experiments. Data are mean ± s.e.m. P values were calculated using two-tailed unpaired t-tests with Welch’s correction or two-tailed Mann–Whitney U-tests.
Fig. 7
Fig. 7. Slowed CSF outflow through the medial deep cervical lymphatics in aged mice and ageing-related transcriptomic changes in LECs of the NPLP.
a, Diagram of the location and the experimental sequence of intracisternal infusion of TMR–dextran at 1.0 μl min−1 for 3 min followed by measurement of TMR–dextran fluorescence in the medial deep cervical lymphatics (medial dcLVs) and dcLNs over 30 min by intravital imaging in C57BL/6J mice. be, Fluorescence images (b,d) and measurements (c,e) comparing TMR–dextran fluorescence in the medial dcLVs (b,c; outlined by yellow dashed lines) and dcLNs (d,e, outlined by yellow dashed lines) of adult (aged 11 weeks) and aged (aged 83 weeks) mice over 30 min after intracisternal infusion. Scale bars, 200 µm (b) and 500 µm (d). For c, data are mean ± s.e.m. for n = 4 mice per group in four independent experiments. P values were calculated using two-way repeated-measures ANOVA. For e, each dot is the value for one mouse. n = 4 mice per group in four independent experiments. a.u., arbitrary units. Data are mean ±  s.e.m. P values were calculated using two-tailed Mann–Whitney U-tests. f, Uniform manifold approximation and projection (UMAP) plot visualizing five subclusters of LECs in the nasopharyngeal mucosa of adult (aged 10–12 weeks) and aged (aged 73–80 weeks) mice. The five subclusters of LECs are conserved in aged mice. The total number of LECs analysed was 1,498. g, GO analysis of the genes enriched in adult or aged mice. The list shows the top three GO terms significantly enriched in adult LECs (blue) and the top five GO terms significantly enriched in aged LECs (red). P values were calculated using the Benjamini–Hochberg correction method for multiple-hypothesis testing. h, Three example genes that were differentially expressed in adult and aged mice. P values were calculated using two-tailed model-based analysis of single cell transcriptomics (MAST) with Bonferroni post hoc test or two-tailed Wilcoxon rank-sum test.
Extended Data Fig. 1
Extended Data Fig. 1. Posterior margin of the palatal bone separates the nasopharyngeal lymphatic plexus from the posterior nasal lymphatic plexus.
a, Bright-field and fluorescence images of upper jaw and nasopharynx viewed from below (left) and laterally (upper right) and in a sagittal section through the palatal bone (lower right) of Prox1-GFP mice. The palatal bone is outlined (yellow dashed lines), and the posterior margin is marked with a red dashed line. The nasopharynx is outlined by a black dashed line. Anatomical positions are indicated in the upper left or right corner. Scale bars, 1 mm. Similar findings were obtained from n = 4 mice in two independent experiments. Ant., anterior; Post., posterior; Sup., superior; Inf., inferior anatomical position. b, Fluorescence images of coronal sections of the nasopharynx at the level of the posterior nasal lymphatic plexus (left, white arrowhead) and the level of the nasopharyngeal lymphatic plexus (right, green arrowhead) in Prox1-GFP mice. White dashed line box regions are enlarged in the lower panels. Scale bars, 200 μm. Similar findings were obtained from n = 4 mice in two independent experiments.
Extended Data Fig. 2
Extended Data Fig. 2. Location of the nasopharyngeal lymphatic plexus in the mucosa of the nasopharynx of the primate, Macaca fascicularis.
a, Mid-sagittal section of the head and neck of Macaca fascicularis with relevant landmarks labelled. Anatomical positions are indicated in the lower left corner. Scale bar, 3 mm. Ant., anterior; Post., posterior anatomical position. b, Immunofluorescence images of thick sections of nasopharyngeal mucosa stained for LYVE1+ (green) of lymphatics and collagen IV+ (red) on vessels. Green dashed-line box in upper panel is enlarged in the lower panel. White arrowheads mark lymphatic valves. Scale bar, 1 mm. Similar findings were obtained from n = 5 Macaca fascicularis in two independent experiments.
Extended Data Fig. 3
Extended Data Fig. 3. Intercellular junctions of lymphatic endothelial cells of the nasopharyngeal lymphatic plexus.
a,b, Immunofluorescence images of whole mounts of the dorsal and ventral portions of nasopharyngeal lymphatic plexus (NPLP) stained for VE-cadherin (VE-cad) and LYVE1 in adult (8–10 weeks old) Prox1-GFP mice. White and yellow dashed-line box areas are enlarged in the centre and right panels. Blood capillaries are highlighted in pink. Zipper-like intercellular junction (magenta arrowheads) predominated (95%) in lymphatics with little or no LYVE1 staining, whereas button-like intercellular junctions (blue arrowheads) were more numerous (21%) in LYVE1+ lymphatics. Scale bars, 100 μm. Similar findings were obtained from n = 4 mice in two independent experiments. Bars indicate mean ± s.e.m. P values for junctions in LYVE1- and LYVE1+ lymphatics were calculated by two-way ANOVA test followed by two-tailed Holm-Sidak’s multiple comparison post-hoc test.
Extended Data Fig. 4
Extended Data Fig. 4. Prox1+/LYVE1+ lymphatics near the pituitary gland extend to the nasopharyngeal lymphatic plexus along cranial nerve V and cavernous sinus of Prox1-GFP mice.
a, Diagram of a sagittal view of dural lymphatics designated upstream lymphatics region #1. b, Light-sheet fluorescence microscopic images showing serial optical sections (numbered) of upstream lymphatics region #1 (white arrowheads) originating near the Prox1+ pituitary gland. These lymphatics course along the cavernous sinus (outlined with blue-dotted lines) and beneath cranial nerve (CN) V (outlined with yellow-dotted lines) en route to the nasopharyngeal lymphatic plexus (NPLP). Anatomical positions are indicated in the lower right corner. Scale bar, 1 mm. Similar findings were obtained from n = 5 mice in three independent experiments. Ant., anterior; Post., posterior; Med., medial; Lat., lateral anatomical position. c, Light-sheet fluorescence microscopic image showing LYVE1-stained (red), blunt-ended Prox1+/LYVE1+ dural lymphatics (green nuclei) in an enlargement of the region in b section 1 marked by white-dotted line box (c) near the Prox1+ pituitary gland (bright green). Scale bar, 100 μm. d, Fluorescence microscopic images of section showing Prox1+ upstream lymphatics region #1 containing FluoSpheres (red arrowheads) along the cavernous sinus. The region of the white dashed-lined box is enlarged in the right panel. Anatomical positions are indicated in the lower left corner. Scale bar, 200 μm. Similar findings were obtained from n = 3 mice in two independent experiments. Ant., anterior; Post., posterior; Med., medial; Lat., lateral anatomical position.
Extended Data Fig. 5
Extended Data Fig. 5. Lymphatics in upstream lymphatics region #2 along the pterygopalatine artery reach the nasopharyngeal lymphatic plexus through the posterior nasal plexus.
a, Diagram of sagittal view of upstream lymphatics region #2. b, Light-sheet fluorescence microscopic images showing serial optical sections (numbered) of lymphatics (outlined with green-dotted lines marked by white arrowheads) along the pterygopalatine artery (PPA, outlined with red-dotted lines) en route to the posterior nasal (green arrows) and nasopharyngeal lymphatic plexuses. A valve (green arrowhead) is located where lymphatics along the PPA join the posterior nasal lymphatic plexus. The white asterisk marks a segment of lymphatic with unknown connections. Anatomical positions are indicated in the upper right corner. Scale bars, 200 μm. Similar findings were obtained from n = 5 mice in three independent experiments. Ant., anterior; Post., posterior; Med., medial; Lat., lateral anatomical position. c, Fluorescence images of sections showing Prox1+ lymphatics in upstream lymphatics region #2 containing FluoSpheres (red arrowheads) along the PPA. Tuft cells of the olfactory epithelium are Prox1+. Anatomical positions are indicated in the upper right corner. Scale bar, 200 μm. Similar findings were obtained from n = 3 mice in two independent experiments. Ant., anterior; Post., posterior; Med., medial; Lat., lateral anatomical position.
Extended Data Fig. 6
Extended Data Fig. 6. Lymphatics near the olfactory bulb cross the cribriform plate with olfactory nerves, traverse the olfactory mucosa, and connect to the posterior nasal lymphatic plexus.
a, Drawing of a mid-sagittal view of upstream lymphatics region #3. b, Immunofluorescence image of section showing a sagittal view of Prox1+ lymphatics near the cribriform plate (white dashed lines). Dural lymphatics near the olfactory bulb are LYVE1+ (white arrow) but connecting lymphatics (green arrowhead) and lymphatics in the olfactory mucosa (green arrow) are LYVE1-. Olfactory nerves are outlined by yellow dashed lines. Anatomical positions are indicated in the upper right corner. Scale bar, 100 μm. Similar findings were obtained from n = 3 mice in two independent experiments. Ant., anterior; Post., posterior; Sup., superior; Inf., inferior anatomical position. c, Immunofluorescence images of sagittal section through the olfactory bulb and cribriform plate (white dashed lines) showing adjacent Prox1+ lymphatics (left panel, image optimized for Prox1) that contain FluoSpheres (right panel, red arrow, image optimized for microspheres). FluoSpheres are also present in perineural lymphatics (green arrowheads) within the plate and in the olfactory mucosa (red arrowheads). Olfactory nerves are outlined by yellow dashed lines. Anatomical positions are indicated in the upper right corner. Scale bars, 100 μm. Similar findings were obtained from n = 3 mice in two independent experiments. Ant., anterior; Post., posterior; Sup., superior; Inf., inferior anatomical position. d, Immunofluorescence image of section showing an axial view of Prox1+ connecting lymphatics containing FluoSpheres (red arrowhead) located between the olfactory mucosa and the posterior nasal lymphatic plexus. Anatomical positions are indicated in the lower left corner. Scale bar, 200 μm. Similar findings were obtained from n = 3 mice in two independent experiments. Ant., anterior; Post., posterior; Med., medial; Lat., lateral anatomical position.
Extended Data Fig. 7
Extended Data Fig. 7. Downstream lymphatics from the nasopharyngeal lymphatic plexus merge and connect to medial deep cervical lymphatics.
a, Fluorescence images of whole mounts of nasopharyngeal region showing four views of direct connections between lymphatics downstream from the nasopharyngeal lymphatic plexus (NPLP) and the proximal end of medial deep cervical lymphatics (medial dcLVs) of Prox1-GFP mice. Anatomical positions are indicated in the upper left corner. Scale bars, 1 mm. Similar findings were obtained from n = 4 mice in three independent experiments. Ant., anterior; Post., posterior anatomical position. b, Immunofluorescence images of nasopharyngeal whole mount stained for α-smooth muscle actin (αSMA, red) and CD31 (blue) in Prox1-GFP mice showing direct connections of downstream lymphatics from the NPLP to the proximal end of medial dcLVs. White dashed-line boxes mark three regions that are enlarged to show detail. Lymphatics from ventral and dorsal sides of the NPLP merge and become ventral and dorsal branches of the medial dcLVs, and then those branches merge and become the main medial dcLVs. The NPLP is not covered by αSMA+ smooth muscle cells (SMCs), but medial dcLVs are covered by SMCs from the proximal end to distal end. Anatomical positions are indicated in the upper left corner. Scale bar, 1 mm. Similar findings were obtained from n = 4 mice in three independent experiments. Ant., anterior; Post., posterior anatomical position.
Extended Data Fig. 8
Extended Data Fig. 8. Intracisternal AAV-mVEGF-C delivery expands nasopharyngeal lymphatic plexus and increases CSF outflow to deep cervical lymph nodes.
a, Diagram of the experimental sequence of intracisternal (i.c.) infusion of 3 × 1010 genome copies of AAV9-mCherry (mCherry) or AAV9-mVEGF-C-mCherry (mVEGF-C) in 3 μl of PBS, followed by i.c. infusion of TMR-Dextran at 1.0 μl/min for 3 min at 3 weeks later and measurement of TMR-Dextran fluorescence in deep cervical lymph nodes (dcLN) 30 min later in Prox1-GFP or C57BL/6J mice. b,c, Immunofluorescence images of tissue whole mounts stained for mCherry (red) and CD31 (blue) and area measurements comparing Prox1+ lymphatics in the NPLP, dura along the superior sagittal sinus (SSS), and diaphragm after delivery of mCherry or mVEGF-C. The similarity of mCherry expression in the NPLP and SSS of both groups is evidence that the AAV9-vectors were similarly transduced to these tissues. Scale bars, 500 μm (NPLP) and 200 μm (SSS, diaphragm). Each dot is the value for one mouse; Prox1+ area of the NPLP (mCherry, n = 4; mVEGF-C, n = 5), Prox1+ area of the dural lymphatics of SSS (n = 4 mice/group), Prox1+ area of diaphragm (n = 4 mice/group), TMR-Dextran intensity in dcLN (n = 6 mice/group) in three independent experiments. Bars indicate mean ± s.e.m. AU (arbitrary unit) normalized to control mean. P values were calculated by two-tailed Mann-Whitney test. d, Fluorescence images and measurements comparing TMR-Dextran fluorescence in deep cervical lymph nodes (dcLN, outlined by green dashed lines) in mice treated with mCherry or mVEGF-C. Scale bars, 200 μm. Each dot is the value for one mouse; n = 6 mice/group in three independent experiments. Bars present mean ± s.e.m. AU, arbitrary unit, normalized to mCherry mean. P values were calculated by two-tailed Mann-Whitney test.
Extended Data Fig. 9
Extended Data Fig. 9. CSF drainage into deep cervical lymph nodes increased by topical application of low concentration of phenylephrine or sodium nitroprusside to deep cervical lymphatics.
a, Diagram of experimental sequence of intracisternal (i.c.) infusion of TMR-Dextran at 1.0 μl/min for 3 min, removal of injection needle, topical application of phenylephrine (PE) or sodium nitroprusside (SNP) to deep cervical lymphatics, and measurement of TMR-Dextran fluorescence in deep cervical lymph nodes (dcLN) of Prox1-GFP mice. b,c, Fluorescence images and measurements of TMR-Dextran fluorescence in dcLNs (outlined by green dashed lines) at 30 min after application of multiple concentrations of PE or SNP. Scale bars, 200 μm. Each dot is the value for one mouse; PBS (n = 18), 10 nM PE (n = 10), 1 μM PE (n = 10), 5 mM PE (n = 7), 3 μM SNP (n = 8), 30 μM SNP (n = 10) in five independent experiments. Error bars indicate mean ± s.e.m. AU, arbitrary unit. P values were calculated by two-way ANOVA test followed by two-tailed Dunnett’s T3 multiple comparison post-hoc test.
Extended Data Fig. 10
Extended Data Fig. 10. Ageing-related alterations in nasopharyngeal lymphatic plexus but no apparent ageing-related structural alterations of medial deep cervical lymphatics.
a, Immunofluorescence images of whole mounts comparing the dorsal region of the nasopharyngeal lymphatic plexus in adult (10 weeks old) and aged (88 weeks old) mice. White dashed-line boxed regions are enlarged in the monochrome panels. Blood capillaries are marked by pink highlighting. In aged mice, Prox1+ lymphatic plexus have disintegrated intercellular junctions (green arrowheads), and some of which appear detached (yellow arrowheads). Scale bars, 200 μm. Similar findings were obtained from n = 7 mice in three independent experiments. b,c, Immunofluorescence images of whole mounts comparing phosphorylated (pTau) and apoptosis (TUNEL+) in nasopharyngeal lymphatic plexus (NPLP) of young (9 weeks old) and aged (95-102 weeks old) mice. pTau+ and TUNEL+ nuclei (red) are significantly more numerous in lymphatic endothelial cells (white arrowheads) in the NPLP of aged mice. Scale bars, 100 μm. Each dot is the value for one mouse; pTau level in NPLP (n = 7 mice/group) and Prox1+/TUNEL+ LEC (n = 6 mice/group) in three independent experiments. Bars indicate mean ± s.e.m. AU, arbitrary unit. P values were calculated by two-tailed Mann-Whitney test. d,e, Immunofluorescence images of whole mounts comparing the diameter, length, valves (Prox1-GFP+, green), and smooth muscle coverage (α-smooth muscle actin, αSMA, red) of medial deep cervical lymphatics (medial dcLVs) in adult (10-11 weeks old) and aged (83-88 weeks old) mice. Scale bars, 200 μm. Each dot is the value for one mouse; n = 5 mice/group in three independent experiments. Bars indicate mean ± s.e.m. P values were calculated by two-tailed Mann-Whitney test.
Extended Data Fig. 11
Extended Data Fig. 11. Expansion of nasopharyngeal lymphatic plexus and CSF outflow to deep cervical lymph nodes in aged mice by intracisternal AAV-mVEGF-C.
a, Diagram of the sequence of intracisternal (i.c.) infusion of 3 × 10¹⁰ genome copies of AAV9-mCherry (mCherry) or AAV9-mVEGF-C-mCherry (mVEGF-C) in 3 μl of PBS followed 3 weeks later by i.c. infusion of TMR-Dextran at 1.0 μl/min for 3 min (or 0.5-µm FluoSpheres) and measurement of TMR-Dextran fluorescence in deep cervical lymph nodes (dcLN) 30 min later in aged (75–78 weeks old) Prox1-GFP or C57BL/6J mice. b,c, Immunofluorescence images comparing whole mounts of the nasopharyngeal lymphatic plexus after AAV delivery of mCherry or mVEGF-C. mCherry expression (red) is present in the NPLP of both groups, indicating that the AAV9-vectors were similarly transduced in these lymphatics. Scale bars, 500 μm. Each dot is the value for one mouse; Prox1+ lymphatic area (mCherry, n = 4; mVEGF-C, n = 6) in two independent experiments. Bars indicate mean ± s.e.m. AU, arbitrary unit. P value was calculated by two-tailed Mann-Whitney test. d, Fluorescence images showing the distribution of FluoSpheres in lymphatics of whole mounts of the posterior nasal and nasopharyngeal plexuses at 1 h after the i.c. infusion to mice that received AAV9-mVEGF-C-mCherry. Scale bar, 500 μm. Similar findings were obtained from n = 3 mice in two independent experiments. e, Fluorescence images and measurements of TMR-Dextran fluorescence in deep cervical lymph nodes (dcLN, outlined by green dashed lines) in aged mice after AAV delivery of mCherry or mVEGF-C. Scale bars, 200 μm. Each dot is the value for one mouse; TMR-Dextran intensity in dcLN (mCherry, n = 6; mVEGF-C, n = 4) in three independent experiments. Bars present mean ± s.e.m. AU, arbitrary unit. P value was calculated by two-tailed Mann-Whitney test.
Extended Data Fig. 12
Extended Data Fig. 12. Active responses of ex vivo medial deep cervical lymphatics to pressure, phenylephrine, and NONOate.
a, Images showing medial deep cervical lymphatics (medial dcLVs) in situ and after cannulation ex vivo for measuring diameter and intraluminal pressure. The experimental setup enabled diameter measurements of isolated, cannulated lymphatics with intraluminal pressure governed by a microfluidic pressure controller. White box marks the segment of medial dcLVs typically dissected for ex vivo studies. b, Response of typical medial dcLV to pressure steps over the physiological range 0.5 to 10 cmH2O. Only small spontaneous amplitude fluctuations are evident at lower pressures. Dotted lines indicate the passive diameter at each pressure, as determined in Ca2+-free Krebs at the end of the experiment. c, Example of medial dcLV with large-amplitude spontaneous diameter changes (contractions) at pressure settings of 1 or 2 cmH2O. Diameter changes ceased at 0.5 cmH2O. Contraction frequency was 13-14 per min. Expanded trace on far right shows two individual contractions, each with a duration of 2.4 sec. d, Plot of active tone as a function of intraluminal pressure in medial dcLVs from adult (8-10 weeks old; n = 10) and aged (90 weeks old; n = 12) mice. Tone was calculated as the difference in active and passive end-diastolic diameter at each pressure and expressed as a percentage of the passive diameter at that pressure. Bars present mean ± s.e.m. P value was calculated by two-way repeated measures ANOVA. e, Recordings of pressure and diameter that illustrate the dosing protocol for inducing tone and assessing concentration-dependent responses to phenylephrine, followed by assessment of concentration-dependent responses to sodium NONOate, at a constant pressure of 1 cmH2O. Small spontaneous contractions follow the first exposure to phenylephrine (10 nM). f, Lack of age-related difference in concentration-dependent constrictions to phenylephrine in medial dcLVs from adult (8-10 weeks old; n = 11) and aged (90 weeks old; n = 12) mice. EDD, end diastolic diameter. Bars present mean ± s.e.m. P value was calculated by a mixed effect analysis. g, Lack of age-related difference in concentration-dependent dilatations to sodium NONOate (in the continued presence of phenylephrine) in adult (8-10 weeks old; n = 11) and aged (90 weeks old; n = 12) mice. EDD, end diastolic diameter. Bars present mean ± s.e.m. P value was calculated by two-way repeated measures ANOVA.
Extended Data Fig. 13
Extended Data Fig. 13. Single-cell transcriptomics of LECs of the nasopharynx in adult mice.
a, UMAP plot visualizing five subclusters of lymphatic endothelial cells (LECs) in the nasopharyngeal mucosa of adult (10-12 weeks old) mice. Pentraxin-3 (Ptx3), Ptx3 capillary LECs (Ptx3 Cap), Ptx3+ capillary LECs (Ptx3+ Cap), pre-collecting LECs (Pre-col), upstream valve LECs (up-valve), downstream valve LECs (down-valve). Total number of LECs analysed = 842. b, Heatmap showing differential expression of genes for the five subclusters of LECs. c, Violin plots comparing the expression of ten representative genes in the five sub-clusters. Little difference was found in Cdh5 or Prox1 among the subclusters, but Ptx3, Stab2, Foxp2, LYVE1, Cldn11, and Gja4 had prominent cluster-related differences.
Extended Data Fig. 14
Extended Data Fig. 14. Ageing-related transcriptomic changes in lymphatic endothelial cells of nasopharyngeal lymphatic plexus.
a, Heatmap showing 50 differentially expressed genes in LECs of the nasopharyngeal mucosa of adult (10–12 weeks old) and aged (73–80 weeks old) mice. The total number of LECs analysed is 1,498. b, Violin plots showing as examples seven genes that were differentially expressed in adult and aged mice. Aged mice has higher expression of genes Irf7, Ifitm2, Ifitm3, and Zbp1 involved in the type I interferon response. P values were calculated by two-tailed MAST with Bonferroni post hoc test or two-tailed Wilcoxon rank test.
Extended Data Fig. 15
Extended Data Fig. 15. Lack of reversal of ageing-related regression of nasopharyngeal lymphatic plexus (NPLP) and reduced CSF drainage by inhibition of interferon type I signalling for 6 weeks.
a, Diagram of the experimental sequence for intraperitoneal (i.p.) injection of 200 μg of IgG or αIFNAR1 into aged (70-88 weeks old) C57BL/6J or Prox1-GFP mice every 72 hr for 6 weeks followed by intracisternal (i.c.) infusion of TMR-Dextran at 1.0 μl/min for 3 min and measurement of TMR-Dextran fluorescence in deep cervical lymph nodes (dcLN) 30 min later. b,c, Fluorescence microscopic images comparing amount of TMR-Dextran fluorescence in dcLNs (outlined by green dashed lines) after IgG or αIFNAR1. Scale bars, 200 μm. Each dot is the value for one mouse; n = 8 mice/group in two independent experiments. Error bars indicate mean ± s.e.m. AU, arbitrary unit. AU (arbitrary unit) normalized to mean IgG value. P values were calculated by two-tailed Mann-Whitney test. d,e, Immunofluorescence images of nasopharyngeal plexus whole mounts stained for Prox1-GFP, VEGFR3, and LYVE1 after IgG or αIFNAR1 administered to aged mice for 6 weeks. Scale bars, 200 μm. No differences between the groups are evident in lymphatic area, LYVE1 intensity, or lymphatic valves. Each dot is the value for one mouse; n = 5 mice/group from two independent experiments. Bars indicate mean ± s.e.m. AU, arbitrary unit. AU (arbitrary unit) normalized to mean control value = 1.0. P values were calculated by two-tailed Mann-Whitney test. f,g, Diagram of the experimental sequence for validating inhibition of interferon type I signalling by i.p. injection of 200 μg of αIFNAR1 antibody into adult (8-12 weeks old) C57BL/6J mice. One hour after injection of IgG or αIFNAR1 antibody, 300 μg of cGAMP was injected i.p. to stimulate type I interferon signalling. At 4 hr, nasopharyngeal tissue was removed for real-time PCR analysis of interferon-stimulating genes, Oas2 and Mx2. The blocking antibody reduced Oas2 and Mx2 expression to the PBS baseline. Each dot is the value for one mouse; Oas2 mRNA level and Mx2 mRNA level (PBS+IgG, n = 4; cGAMP+IgG, n = 5; cGAMP+ αIFNAR1, n = 5) in two independent experiments. Error bars indicate mean ± s.e.m. AU, arbitrary unit. P values were calculated by Brown-Forsythe ANOVA and two-tailed Dunnett’s T3 multiple comparison test.

Comment in

Similar articles

Cited by

References

    1. Key, A. & Retzius, G. Studien in der Anatomie des Nervensystems und des Bindegewebes: 1. Hälfte Vol. 1 (Samson & Wallin, 1875).
    1. Bradbury M, Cserr H. Drainage of cerebral interstitial fluid and of cerebrospinal fluid into lymphatics. Exp. Biol. Lymph. Circ. 1985;9:355–394.
    1. Cserr HF, Harling-Berg CJ, Knopf PM. Drainage of brain extracellular fluid into blood and deep cervical lymph and its immunological significance. Brain Pathol. 1992;2:269–276. doi: 10.1111/j.1750-3639.1992.tb00703.x. - DOI - PubMed
    1. Kida S, Pantazis A, Weller RO. CSF drains directly from the subarachnoid space into nasal lymphatics in the rat. Anatomy, histology and immunological significance. Neuropathol. Appl. Neurobiol. 1993;19:480–488. doi: 10.1111/j.1365-2990.1993.tb00476.x. - DOI - PubMed
    1. Zakharov A, Papaiconomou C, Djenic J, Midha R, Johnston M. Lymphatic cerebrospinal fluid absorption pathways in neonatal sheep revealed by subarachnoid injection of Microfil. Neuropathol. Appl. Neurobiol. 2003;29:563–573. doi: 10.1046/j.0305-1846.2003.00508.x. - DOI - PubMed