. 2024 Jan;625(7996):797-804.
doi: 10.1038/s41586-023-06902-y. Epub 2024 Jan 10.

The CRISPR effector Cam1 mediates membrane depolarization for phage defence

Affiliations

The CRISPR effector Cam1 mediates membrane depolarization for phage defence

Christian F Baca et al. Nature. 2024 Jan.

Abstract

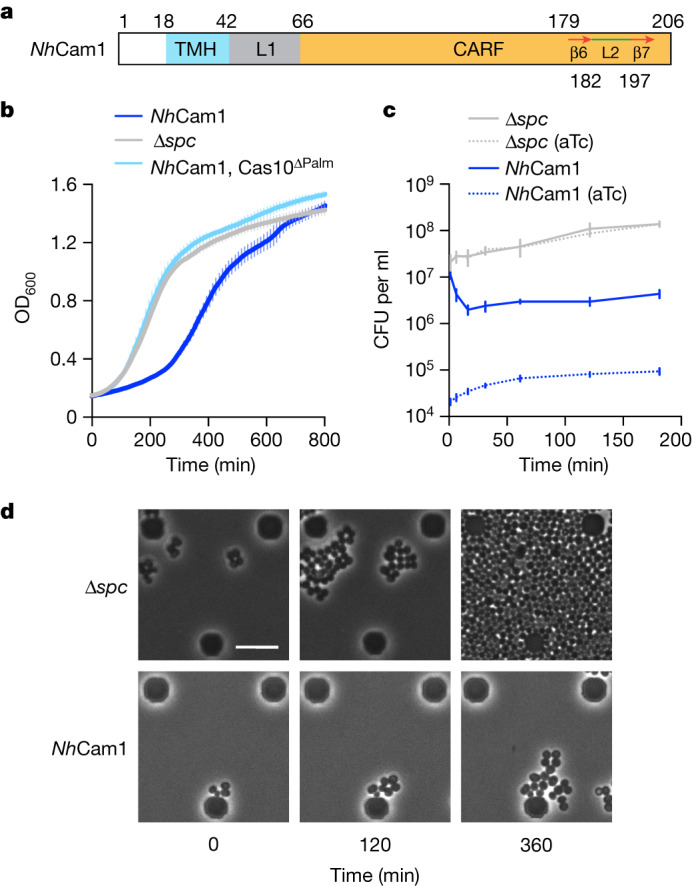
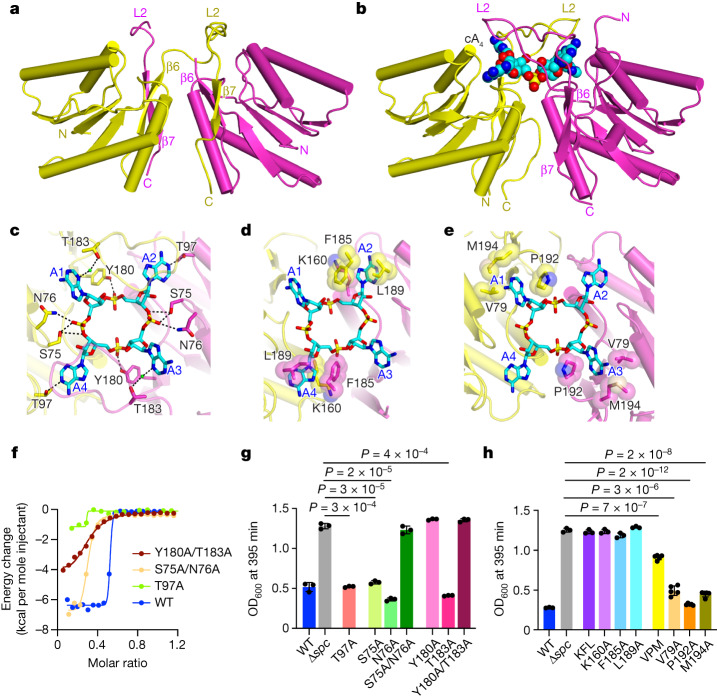
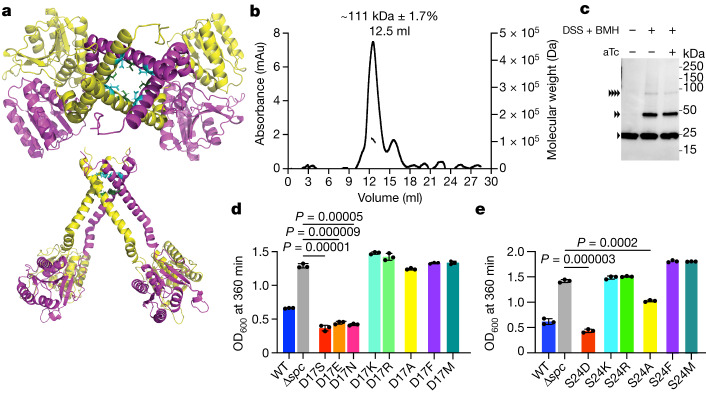
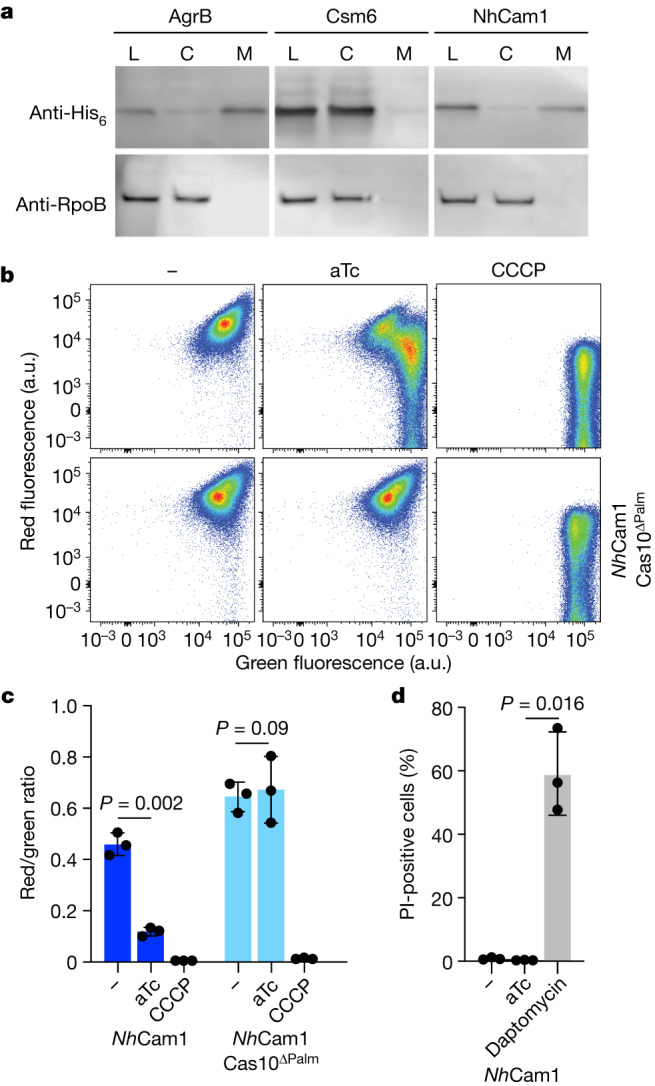
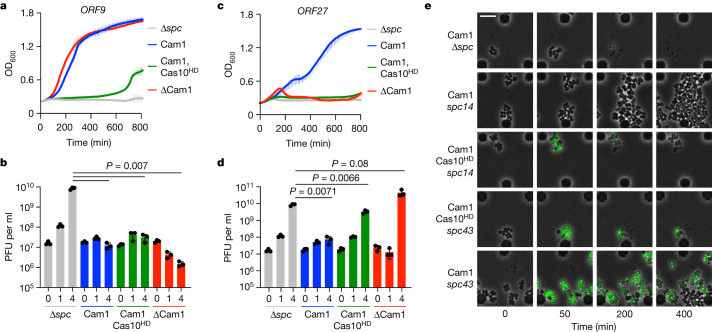
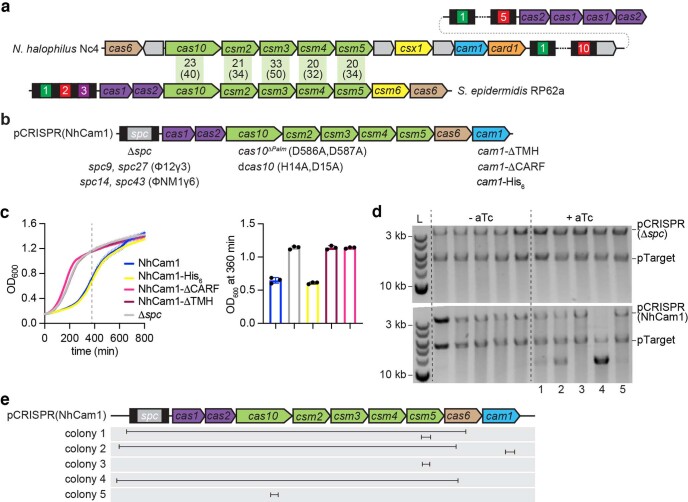
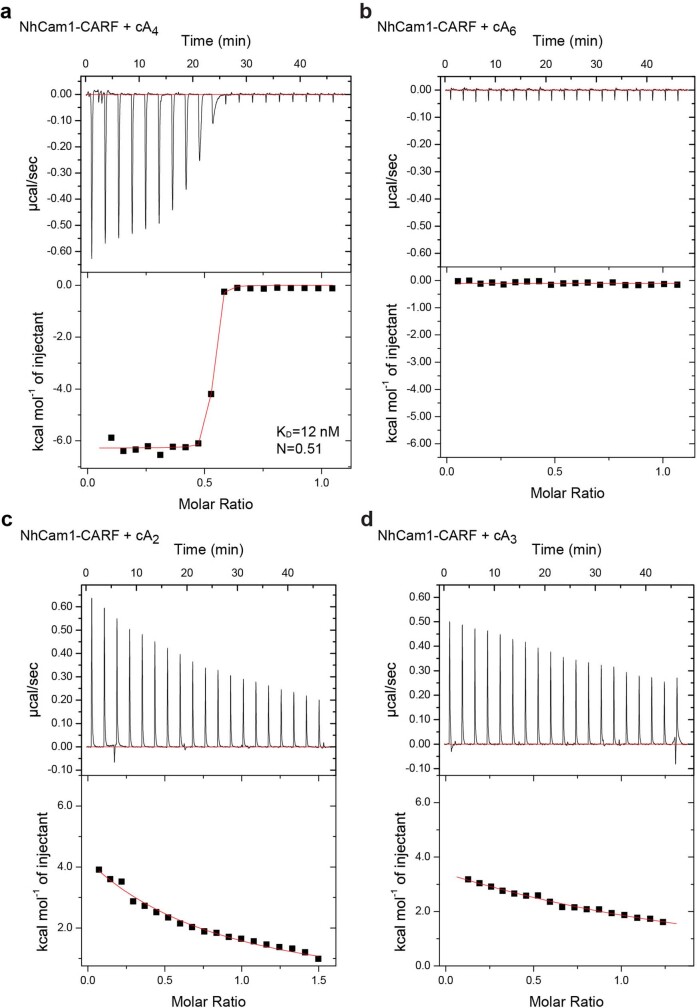
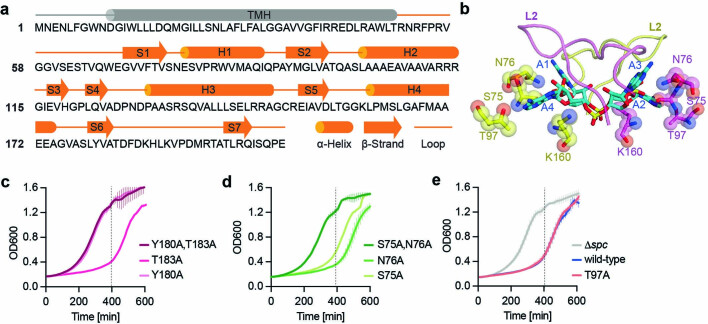
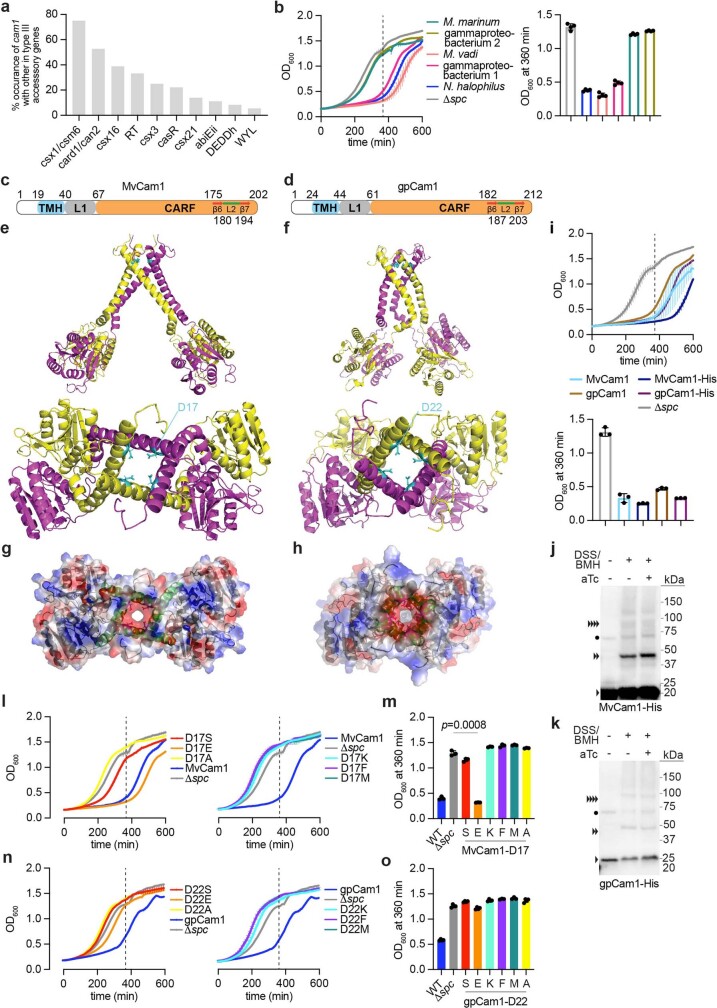
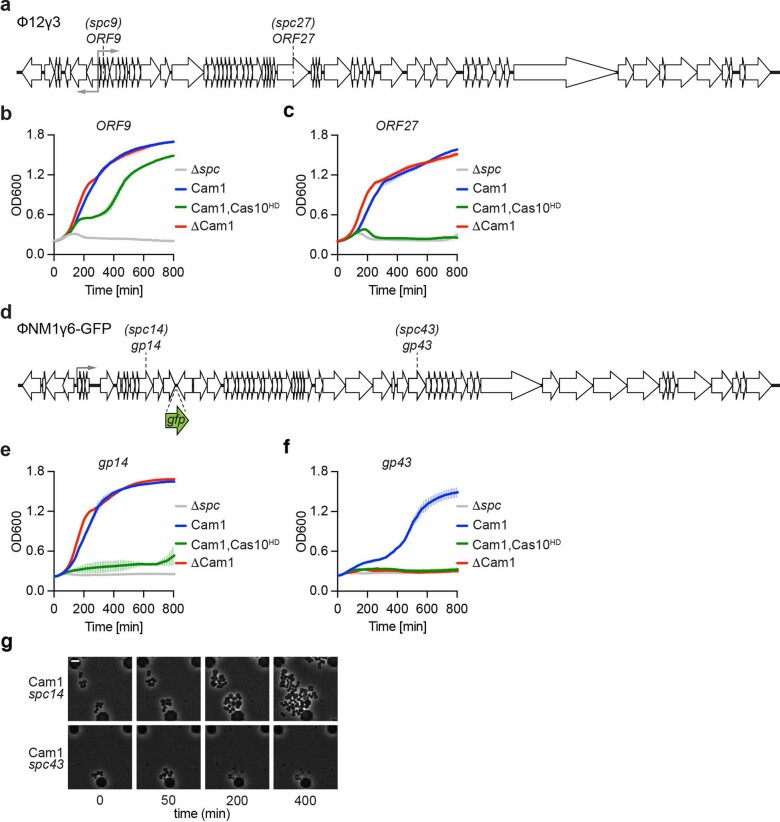
Prokaryotic type III CRISPR-Cas systems provide immunity against viruses and plasmids using CRISPR-associated Rossman fold (CARF) protein effectors1-5. Recognition of transcripts of these invaders with sequences that are complementary to CRISPR RNA guides leads to the production of cyclic oligoadenylate second messengers, which bind CARF domains and trigger the activity of an effector domain6,7. Whereas most effectors degrade host and invader nucleic acids, some are predicted to contain transmembrane helices without an enzymatic function. Whether and how these CARF-transmembrane helix fusion proteins facilitate the type III CRISPR-Cas immune response remains unknown. Here we investigate the role of cyclic oligoadenylate-activated membrane protein 1 (Cam1) during type III CRISPR immunity. Structural and biochemical analyses reveal that the CARF domains of a Cam1 dimer bind cyclic tetra-adenylate second messengers. In vivo, Cam1 localizes to the membrane, is predicted to form a tetrameric transmembrane pore, and provides defence against viral infection through the induction of membrane depolarization and growth arrest. These results reveal that CRISPR immunity does not always operate through the degradation of nucleic acids, but is instead mediated via a wider range of cellular responses.


Conflict of interest statement

L.A.M. is a co-founder of Intellia Therapeutics and Eligo Biosciences, and a scientific advisory board member of Intellia Therapeutics and Ancilia Biosciences. C.F.B., Y.Y., J.T.R., P.M. and D.J.P. declare no competing interests.

Figures

Fig. 1
Fig. 1. NhCam1 mediates growth arrest upon activation of type III CRISPR immunity.
a, Domain architecture of NhCam1. Numbers indicate amino acids, and β6 and β7 are beta strands. b, Growth of staphylococci carrying pTarget and pCRISPR variants, measured as OD600 after the addition of aTc in the absence of antibiotic selection for pTarget. Data are mean of three biological triplicates ± s.e.m. c, Number of colony-forming units from staphylococcal cultures carrying pCRISPR variants after the addition of aTc. At the indicated times after induction, aliquots were removed and plated on solid medium with or without aTc to count the remaining viable cells. Data are mean of three biological replicates ± s.e.m. d, Time-course microscopy of S. aureus cells harbouring pTarget and pCRISPR(Δspc) or pCRISPR(NhCam1) at different times after addition of aTc. Images representative for two biological replicates. Scale bar, 6.8 µm. Source Data
Fig. 2
Fig. 2. The NhCam1 CARF domain dimerizes to bind cA4.
a, The 2.2 Å X-ray structure of NhCam1-CARF, showing the dimeric alignment of the CARF domain of NhCam1 (residues 42–206) in the apo state. Individual monomers are coloured in yellow and magenta. Note the swapped dimeric topology, in which β6 of one monomer pairs with β7 of the other monomer. b, The 2.1 Å X-ray structure of NhCam1-CARF bound to cA4, showing cA4 binding within the dimeric alignment of the CARF domain (residues 42–206) of NhCam1. c, Intermolecular hydrogen-bonding alignments between bound cA4 and CARF domain residues (residues 42–206) in the X-ray structure of the dimeric cA4NhCam1 complex. d,e, Intermolecular hydrophobic contacts involving A2 and A4 (d) and A1 and A3 (e) with CARF domain residues (residues 42–206) in the X-ray structure of the CARF domain (residues 42–206) of dimeric NhCam1 in the cA4-bound state. f, ITC plots comparing the binding affinity of cA4 to the CARF domain (residues 67–206) of dimeric NhCam1 in wild-type (WT) and T97A, S75A/N76A and Y180A/T183A mutant NhCam1. g, Growth of staphylococci carrying pTarget and pCRISPR(NhCam1) harbouring alanine substitutions of the residues shown in c, measured as the OD600 value 395 min after addition of aTc. Data are mean of three biological triplicates ± s.e.m. Two-sided t-test with Welch’s correction. h, As in g, but testing alanine substitutions of residues shown in d and e. KFL, K160A/F185A/L189A. Data are mean of three biological triplicates ± s.e.m. Two-sided t-test with Welch’s correction. Source Data
Fig. 3
Fig. 3. NhCam1 is predicted to form a tetrameric pore.
a, Structure of a tetrameric NhCam1 obtained using AlphaFold2 simulation of different multimeric forms. Two NhCam1 subunits (yellow and magenta) form a dimer; two of these dimers form a tetrameric pore. Aspartate and serine residues lining the opening of the pore are shown in cyan and green, respectively. b, SEC–MALS measurement of the molecular weight of NhCam1 solubilized into DDM micelles. The measured molecular weight of 111 kDa is close to the calculated molecular weight of tetrameric Cam1 (99.6 kDa). The experiment was repeated for two biological replicates. c, Western blot of extracts from staphylococci expressing NhCam1–His that were treated with DSS and BMH crosslinkers or mock-treated, in the presence or absence of aTc. A primary anti-His6 antibody was used on these samples. Arrowheads each represent a single MvCam1 subunit. Images are representative of three biological triplicates. d, Growth of staphylococci carrying pTarget and pCRISPR(NhCam1) harbouring different D17 substitutions in NhCam1, measured as the OD600 value 395 min after addition of aTc. Data are mean of three biological triplicates ± s.e.m. Two-sided t-test with Welch’s correction. e, As in d, but testing substitutions of S24. Data are mean of three biological triplicates ± s.e.m. Two-sided t-test with Welch’s correction. Source Data
Fig. 4
Fig. 4. NhCam1 mediates membrane depolarization.
a, Western blot of cellular fractions. Staphylococci harbouring plasmids encoding C-terminally hexahistidine-tagged AgrB, Csm6 or NhCam1 were grown to an OD600 of 0.5. Cells were disrupted to collect the total lysate fraction (L), which was subsequently fractionated by ultracentrifugation to obtain cytosolic (C) and membrane (M) fractions. Samples were blotted with a primary anti-His6 antibody. Anti-RpoB was used as a loading control. The protein molecular weight ladder is shown in Supplementary Fig. 1b. The experiment was repeated for two biological replicates. b, Flow cytometry of S. aureus cells harbouring various pCRISPR constructs and stained with DiOC2(3), collected 30 min after addition of aTc or the depolarizing agent CCCP. a.u., arbitrary units; green fluorescence, emission of 515 nm upon 488 nm excitation; red fluorescence, emission of 610 nm upon 561 nm excitation. Each plot is representative of approximately 100,000 cells. Blue points represent low density of events while red points represent higher density of events. c, Quantification of flow cytometry in b. Two-sided t-test with Welch’s correction. The ratio of red to green fluorescence was calculated from the mean fluorescence intensities of red and green channels. Data are mean of three biological triplicates ± s.e.m. Two-sided Welch’s t-test. d, Quantification of propidium iodide (PI) fluorescence measured after addition of either aTc or daptomycin to staphylococci harbouring pTarget and pCRISPR(NhCam1). Data are mean of three biological triplicates ± s.e.m. Two-sided Welch’s t-test. At least 150 cells were analysed for each biological replicate to calculate the percentage of propidium iodide-positive cells. Source Data
Fig. 5
Fig. 5. NhCam1 mediates immunity against phage infection during the type III CRISPR response.
a, Growth of staphylococci carrying different pCRISPR constructs targeting the ORF9 transcript of Φ12γ3, measured as OD600 after infection at an MOI of approximately 5. Data are mean of three biological triplicates ± s.e.m. Cas10HD, Cas10 carrying inactivating mutations in the HD domain. b, Number of plaque-forming units in staphylococcal cultures harbouring different pCRISPR constructs programmed to target the ORF9 transcript, at the indicated times after infection with Φ12γ3 at an MOI of approximately 1. Data are mean of three biological replicates ± s.e.m. Two-sided t-test with Welch’s correction. c, As in a, but with pCRISPR constructs targeting the ORF27 transcript. d, As in b, but with pCRISPR constructs targeting the ORF27 transcript. Data are mean of three biological triplicates ± s.e.m. Two-sided t-test with Welch’s correction. e, Time-course microscopy of S. aureus harbouring different pCRISPR constructs after infection with ΦNM1γ6-GFP. Images are representative of two biological replicates. Scale bar, 3.0 μm. Source Data
Extended Data Fig. 1
Extended Data Fig. 1. NhCam1 mediates growth arrest in staphylococci.
(a) Comparison of the type III-A systems of Nitrosococcus halophilus Nc4 and Staphylococcus epidermidis RP62. Black boxes, CRISPR repeats; colored and numbered boxes, CRISPR spacers. Numbers indicate the % homology at the amino acid sequence level. Numbers in parenthesis indicate the % homology at the DNA sequence level. (b) Genetic modifications of the S. epidermidis RP62 type III-A CRISPR locus cloned into different pCRISPR plasmids. Insertion of different spacer sequences, amino acid substitutions and domain deletions are indicated. (c) Growth of staphylococci carrying pTarget and pCRISPR variants, measured as OD600 after the addition of aTc in the absence of antibiotic selection for pTarget. Dotted line marks the OD600 value at 395 min, used to generate the bar graph. In both graphs the mean of three biological triplicates, ±s.e.m., is reported. (d) Agarose gel electrophoresis of linearized plasmids purified from five different colonies obtained in the final data point of the experiment shown in Fig. 1d. “L”, DNA ladder. Image is representative of two technical replicates. (e) Schematic of the DNA sequencing results obtained after NGS of the pCRISPR(NhCam1) plasmids purified from the five colonies obtained in the presence of aTc, shown in panel (d). Lines represent the regions of the CRISPR locus not found in these plasmids (presumably deleted). Source Data
Extended Data Fig. 2
Extended Data Fig. 2. ITC experiments using different cyclic oligoadenylates.
(ad). ITC plots of the binding of cA4 (a), cA6 (b), cA2 (c) and cA3 (d) to the CARF (residues 67-206) domain of dimeric NhCam1. Source Data
Extended Data Fig. 3
Extended Data Fig. 3. Analysis NhCam1 residues that interact with cA4 through hydrogen bonding.
(a) Sequence alignment of full-length NhCam1, together with secondary structure shown above the sequence. The secondary structure of the TMH helix is predicted while the secondary structure of the CARF domain is based on the x-ray structures of dimeric NhCam1 in the apo- and cA4-bound states. (b) Positioning of bound cA4 on a platform formed by the side chains of Lys160, Thr97, Ser75 and Asn76 in the x-ray structure of the CARF(42-206) domain of dimeric NhCam1 in the cA4-bound state. (ce) Growth of staphylococci carrying pTarget and pCRISPR(NhCam1) harboring alanine substitutions of the NhCam1 residues shown in Fig. 2c, measured as the OD600 value over time. Dotted line marks the OD600 value at 395 min, used to generate Fig. 2g. Mean of three biological triplicates, ±s.e.m., is reported. Source Data
Extended Data Fig. 4
Extended Data Fig. 4. Analysis NhCam1 non-polar residues that interact with cA4.
(a,b) ITC plots of the binding of cA4 to CARF(67-206) domain of dimeric NhCam1 with K160A + F185A + L189A mutants (a) and V79A + P192A + M194A mutants (b). (c) Growth of staphylococci carrying pTarget and pCRISPR(NhCam1) harboring alanine substitutions of the NhCam1 residues shown in Fig. 2d, measured as the OD600 value over time. Dotted line marks the OD600 value at 395 min, used to generate Fig. 2h. Mean of three biological triplicates, ±s.e.m., is reported. (de) Same as (c) but for the NhCam1 residues shown in Fig. 2e. Mean of three biological triplicates, ±s.e.m., is reported. Source Data
Extended Data Fig. 5
Extended Data Fig. 5. Crystal structure of NhCam1-CARF bound to cA6.
(a,b) The 1.9 Å x-ray structure of cA6 bound to the dimeric CARF (residues 42-206) domain of NhCam1 (a) and the 2.1 Å x-ray structure of cA4 bound to the dimeric CARF (residues 42-206) domain of NhCam1 (b). Green ovals highlight the loop L2 in the two structures (c, d) A schematic representation of cA6 (c) and cA4 (d) bound to the dimeric CARF domain of NhCam1. Although cA6 occupies the same pocket of the NhCam1-CARF dimer that binds cA4, only three contiguous adenosines could be fit into the electron density for bound cA6 within the binding pocket, while the other three adenosines had poor density and were positioned outside of the pocket, thereby preventing the capping of the bound ligand by the pair of L2 loops.
Extended Data Fig. 6
Extended Data Fig. 6. Alphafold model of tetrameric NhCam1.
(a) Alphafold model of tetrameric NhCam1 structure, showing surface electrostatics in blue (positive charge) and red (negative charge). (b) Zoom in of the predicted pore formed by the NhCam1 tetramer, showing the D17 and S24 pore-lining residues in cyan and green, respectively. (c) Sequence alignment of the N-terminal, transmembrane helix, domains of different Cam1 homologs, showing conservation for the D17 (cyan), but not for the S24 (green), pore-lining residues. (*) indicates Cam1 homologs that showed activity in our experimental set up; (**) indicates those that were tested but showed no activity. (d) SDS-PAGE of NhCam1 purified and solubilized into β-DDM micelles, used for the SEC-MALS experiment of Fig. 3b. Image is representative of two biological replicates. (e) Structure of the NhCam1-CARF dimer showing the lysine and cysteine residues available for crosslinking. (f) Western blot of extracts from staphylococci expressing NhCam1-His that were treated or (mock-treated) with the DSS crosslinker, in the presence or absence of aTc. A primary anti-hexahistidine antibody was used to detect NhCam1-His. Image is representative of three biological triplicates. (g) Growth of staphylococci carrying pTarget and pCRISPR(NhCam1) harboring different substitutions of the D17 residue, measured as the OD600 value over time. Dotted line marks the OD600 value at 395 min, used to generate Fig. 2g. Mean of three biological triplicates, ±s.e.m., is reported. (h) Growth of staphylococci carrying pTarget and pCRISPR(NhCam1) harboring different substitutions of the S24 residue, measured as the OD600 value over time. Dotted line marks the OD600 value at 395 min, used to generate Fig. 2h. Mean of three biological triplicates, ±s.e.m., is reported. Source Data
Extended Data Fig. 7
Extended Data Fig. 7. Analysis of NhCam1 function in membrane depolarization.
(a) Quantification of flow cytometry of S. aureus cells harboring pCRISPR constructs without a targeting spacer but expressing NhCam1 (Δspc) or with a spacer targeting a transcript produced by pTarget but expressing the nucleases Csm6 or Card1. Cells were stained with DiOC2(3) and collected 30 min after addition of either aTc or the depolarizing agent CCCP. The ratio of red to green fluorescence was calculated from the mean fluorescence intensities (MFIs) of red and green channels. “a”, aTc; “C”, CCCP. Mean of three biological triplicates, ±s.e.m. is reported. (b) Fluorescent microscopy of staphylococci harboring pTarget and pCRISPR(NhCam1) in the presence of propidium iodine, either untreated or after the addition of aTc or daptomycin. Images are representative of three biological triplicates. Scale bar is 3.0 μM. Source Data
Extended Data Fig. 8
Extended Data Fig. 8. Cam1 homologs mediate growth arrest.
(a) Analysis of co-occurrence of Cam1 with other known type III accessory effectors, reported as the % of genomes containing Cam1 that also contain any of the effectors shown in the x axis. (b) Growth of staphylococci carrying pTarget and pCRISPR plasmids harboring different Cam1 homologs, measured as OD600 after the addition of aTc in the absence of antibiotic selection for pTarget. Dotted line marks the OD600 value at 395 min, used to generate the bar graph. In both graphs the mean of three biological triplicates, ±s.e.m., is reported. (c) Domain architecture of Methylomarinum vadi Cam1, MvCam1. Numbers indicate amino acids; TMH, transmembrane helix; L1, L2, linkers; CARF, CRISPR-associated Rossman fold domain; β6, β7, beta strands. (d) Same as (c) but for gammaproteobacterium bacterium Cam1, gpCam1. (e) Structure of a tetrameric MvCam1 obtained using Alphafold2 simulation of different multimeric forms. Two MvCam1 subunits (yellow and magenta) form a dimer; two of these dimers form a tetrameric pore. Aspartate residues (D17) lining the opening of the pore are shown in cyan. (f) Same as (e) but for gpCam1, showing the location of D22 within the pore. (g) Alphafold model of tetrameric MvCam1 structure, showing surface electrostatics in blue (positive charge) and red (negative charge). (h) Same as (g) but for gpCam1. (i) Same as (b) but using staphylococci that carry pCRISPR plasmids expressing MvCam1, gpCam1 or their His6-tagged versions. (j) Western blot of extracts from staphylococci expressing MvCam1-His that were treated or (mock-treated) with DSS and BMH crosslinkers, in the presence or absence of aTc. A primary anti-hexahistidine antibody was used on these samples. Arrowheads represent a single MvCam1 subunit. The circle indicates a non-specific band. Image is representative of two biological replicates. (k) Same as (j) but using extracts of staphylococci expressing gpCam1-His. (l) Growth of staphylococci carrying pTarget and pCRISPR(MvCam1) harboring different substitutions of the D17 residue, measured as the OD600 value over time. Dotted line marks the OD600 value at 395 min. Mean of three biological triplicates, ±s.e.m., is reported. (m) OD600 value after 395 min of addition of aTc obtained in (l). Mean of three biological triplicates, ±s.e.m., is reported. p values, obtained with a two-sided t-test with Welch’s correction, are shown. (n) Growth of staphylococci carrying pTarget and pCRISPR(gpCam1) harboring different substitutions of the D22 residue, measured as the OD600 value over time. Dotted line marks the OD600 value at 395 min. Mean of three biological triplicates, ±s.e.m., is reported. (o) OD600 value after 395 min of addition of aTc obtained in (n). Mean of three biological triplicates, ±s.e.m., is reported. Source Data
Extended Data Fig. 9
Extended Data Fig. 9. NhCam1 mediates phage defense.
(a) Schematic of the genome of the staphylococcal phage Φ12γ3, showing the location of the transcripts targeted by the different spacers of type III-A CRISPR-Cas system. Grey arrows indicate promoters. (b) Growth of staphylococci carrying different pCRISPR constructs carrying active NhCam1 and/or Cas10, programmed to target the ORF27 transcript of Φ12γ3, measured as OD600 at different times after infection, at an MOI ~ 0.1. Mean of three biological triplicates ± s.e.m. are reported. (c) Same as in (b) but targeting the ORF29 transcript. Mean of three biological triplicates ± s.e.m. are reported. (d) Schematic of the genome of the staphylococcal phage ΦNM1γ6-GFP, showing the location of the transcripts targeted by the different spacers of type III-A CRISPR-Cas system, as well as the insertion site of the gfp gene. Grey arrows indicate promoters. (e) Growth of staphylococci carrying different pCRISPR constructs programmed to target the gp14 transcript of ΦNM1γ6-GFP, measured as OD600 at different times after infection, at an MOI ~ 5. Mean of three biological triplicates ± s.e.m. are reported. (f) Same as in (e) but targeting the gp43 transcript. Mean of three biological triplicates ± s.e.m. are reported. (g) Time-course microscopy of S. aureus harboring different pCRISPR constructs after infection with ΦNM1γ6-GFP. Images are representative of two biological replicates. Scale bar is 3.0 μM. Source Data

Similar articles

Cited by

References

    1. McMahon SA, et al. Structure and mechanism of a type III CRISPR defence DNA nuclease activated by cyclic oligoadenylate. Nat. Commun. 2020;11:500. doi: 10.1038/s41467-019-14222-x. - DOI - PMC - PubMed
    1. Zhu W, et al. The CRISPR ancillary effector Can2 is a dual-specificity nuclease potentiating type III CRISPR defence. Nucleic Acids Res. 2021;49:2777–2789. doi: 10.1093/nar/gkab073. - DOI - PMC - PubMed
    1. Rostol JT, et al. The Card1 nuclease provides defence during type III CRISPR immunity. Nature. 2021;590:624–629. doi: 10.1038/s41586-021-03206-x. - DOI - PMC - PubMed
    1. Molina R, et al. Structure of Csx1–cOA4 complex reveals the basis of RNA decay in type III-B CRISPR–Cas. Nat. Commun. 2019;10:4302. doi: 10.1038/s41467-019-12244-z. - DOI - PMC - PubMed
    1. Jia N, Jones R, Yang G, Ouerfelli O, Patel DJ. CRISPR–Cas III-A Csm6 CARF domain is a ring nuclease triggering stepwise cA4 cleavage with ApA>p formation terminating RNase activity. Mol. Cell. 2019;75:944–956.e946. doi: 10.1016/j.molcel.2019.06.014. - DOI - PMC - PubMed

MeSH terms

Substances