

CNN-based multi-modal radiomics analysis of pseudo-CT utilization in MRI-only brain stereotactic radiotherapy: a feasibility study
- PMID: 38200424
- PMCID: PMC10782704
- DOI: 10.1186/s12885-024-11844-3
CNN-based multi-modal radiomics analysis of pseudo-CT utilization in MRI-only brain stereotactic radiotherapy: a feasibility study
Abstract
Background: Pseudo-computed tomography (pCT) quality is a crucial issue in magnetic resonance image (MRI)-only brain stereotactic radiotherapy (SRT), so this study systematically evaluated it from the multi-modal radiomics perspective.
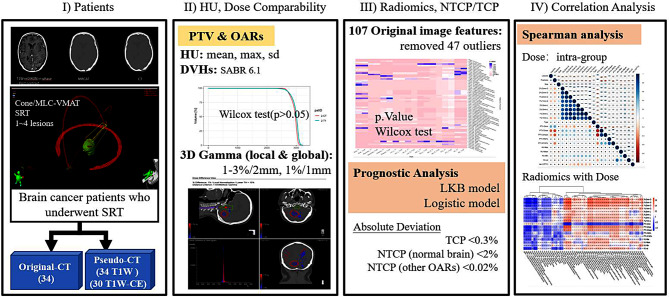
Methods: 34 cases (< 30 cm³) were retrospectively included (2021.9-2022.10). For each case, both CT and MRI scans were performed at simulation, and pCT was generated by a convolutional neural network (CNN) from planning MRI. Conformal arc or volumetric modulated arc technique was used to optimize the dose distribution. The SRT dose was compared between pCT and planning CT with dose volume histogram (DVH) metrics and gamma index. Wilcoxon test and Spearman analysis were used to identify key factors associated with dose deviations. Additionally, original image features were extracted for radiomic analysis. Tumor control probability (TCP) and normal tissue complication probability (NTCP) were employed for efficacy evaluation.
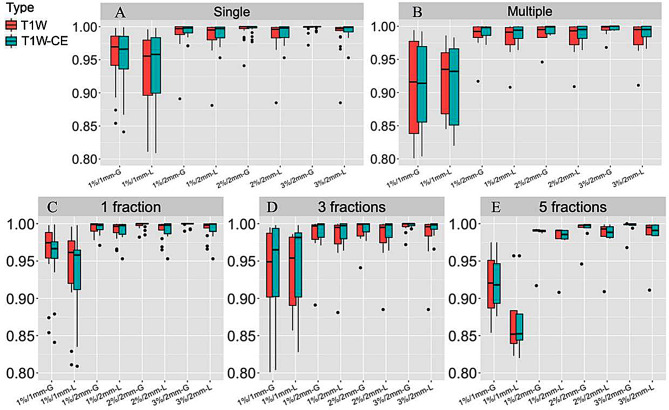
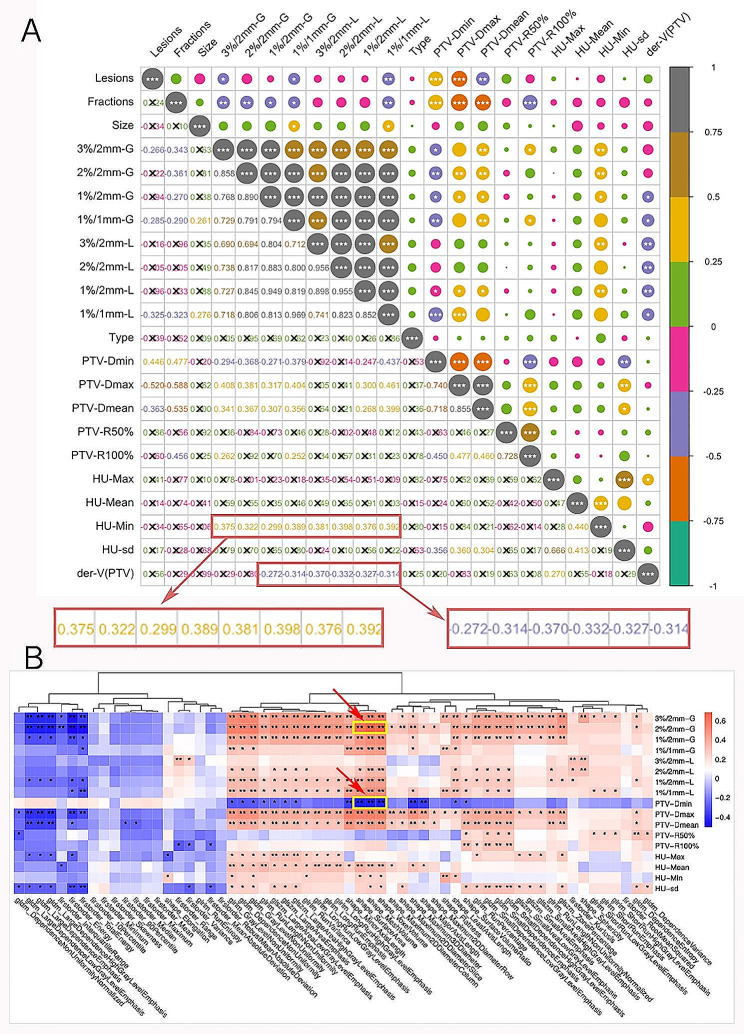
Results: There was no significant difference between pCT and planning CT except for radiomics. The mean value of Hounsfield unit of the planning CT was slightly higher than that of pCT. The Gadolinium-based agents in planning MRI could increase DVH metrics deviation slightly. The median local gamma passing rates (1%/1 mm) between planning CTs and pCTs (non-contrast) was 92.6% (range 63.5-99.6%). Also, differences were observed in more than 85% of original radiomic features. The mean absolute deviation in TCP was 0.03%, and the NTCP difference was below 0.02%, except for the normal brain, which had a 0.16% difference. In addition, the number of SRT fractions and lesions, and lesion morphology could influence dose deviation.
Conclusions: This is the first multi-modal radiomics analysis of CNN-based pCT from planning MRI for SRT of small brain lesions, covering dosiomics and radiomics. The findings suggest the potential of pCT in SRT plan design and efficacy prediction, but caution needs to be taken for radiomic analysis.
Keywords: MRI-only radiotherapy; Multi-modal radiomics analysis; Pseudo-CT.
© 2024. The Author(s).
Conflict of interest statement
The authors declare no competing interests.
Figures
Similar articles
-
Dosimetry-Driven Quality Measure of Brain Pseudo Computed Tomography Generated From Deep Learning for MRI-Only Radiation Therapy Treatment Planning.Int J Radiat Oncol Biol Phys. 2020 Nov 1;108(3):813-823. doi: 10.1016/j.ijrobp.2020.05.006. Epub 2020 May 14. Int J Radiat Oncol Biol Phys. 2020. PMID: 32417412
-
A patch-based pseudo-CT approach for MRI-only radiotherapy in the pelvis.Med Phys. 2016 Aug;43(8):4742. doi: 10.1118/1.4958676. Med Phys. 2016. PMID: 27487892
-
Feasibility of MR-only proton dose calculations for prostate cancer radiotherapy using a commercial pseudo-CT generation method.Phys Med Biol. 2017 Nov 21;62(24):9159-9176. doi: 10.1088/1361-6560/aa9677. Phys Med Biol. 2017. PMID: 29076458
-
Dosimetric Validation of a GAN-Based Pseudo-CT Generation for MRI-Only Stereotactic Brain Radiotherapy.Cancers (Basel). 2021 Mar 3;13(5):1082. doi: 10.3390/cancers13051082. Cancers (Basel). 2021. PMID: 33802499 Free PMC article.
-
MRI-based treatment planning for brain stereotactic radiosurgery: Dosimetric validation of a learning-based pseudo-CT generation method.Med Dosim. 2019 Autumn;44(3):199-204. doi: 10.1016/j.meddos.2018.06.008. Epub 2018 Aug 14. Med Dosim. 2019. PMID: 30115539 Free PMC article.
Cited by
-
Reproducibility of methodological radiomics score (METRICS): an intra- and inter-rater reliability study endorsed by EuSoMII.Eur Radiol. 2025 Aug;35(8):4533-4545. doi: 10.1007/s00330-025-11443-1. Epub 2025 Feb 19. Eur Radiol. 2025. PMID: 39969552 Free PMC article.
References
MeSH terms
Grants and funding
LinkOut - more resources
Full Text Sources
Research Materials
