Randomized Controlled Trial
. 2024 Jan 10;24(1):150.
doi: 10.1186/s12889-024-17645-4.

Gender differences in changes in alcohol consumption achieved by free provision of non-alcoholic beverages: a secondary analysis of a randomized controlled trial

Affiliations
Randomized Controlled Trial

Gender differences in changes in alcohol consumption achieved by free provision of non-alcoholic beverages: a secondary analysis of a randomized controlled trial

Shohei Dobashi et al. BMC Public Health. .

Abstract

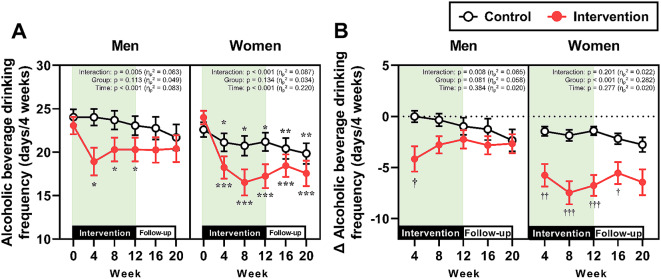
Background: We recently demonstrated that a 12-week intervention consisting of the provision of free non-alcoholic beverages reduced alcohol consumption in excessive drinkers for 8 weeks after the intervention. However, gender differences in this effect were not explored. Thus, this secondary analysis investigated gender differences in the influence of non-alcoholic beverage provision on alcohol consumption.

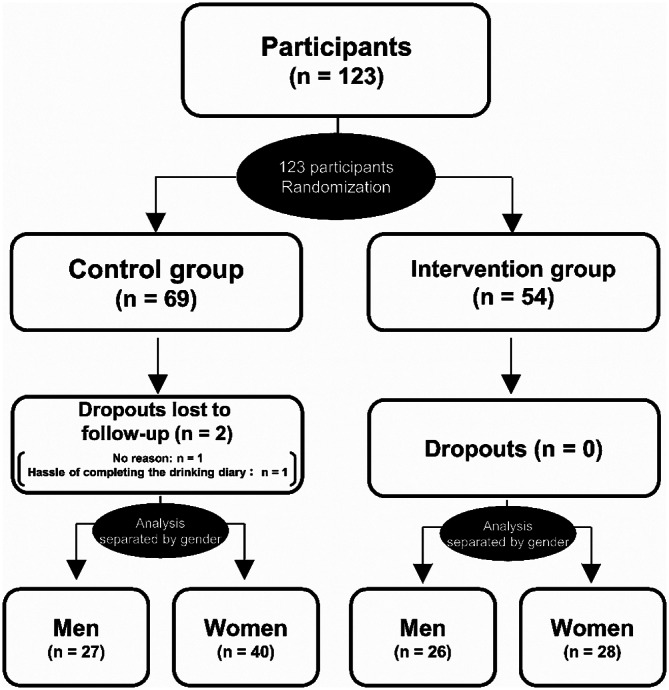
Methods: Individuals who frequently drank excessively (at least 40 g/day in men and 20 g/day in women) and who were not diagnosed with alcoholism were recruited. Participants were randomized into the intervention or control group by simple randomization using a random number table. In the intervention group, free non-alcoholic beverages were provided once every 4 weeks for 12 weeks (three times in total). The consumption of alcoholic and non-alcoholic beverages was calculated based on a drinking diary submitted with the previous 4 weeks' of data. In this study, we compared the longitudinal changes in alcohol consumption between genders in both groups.

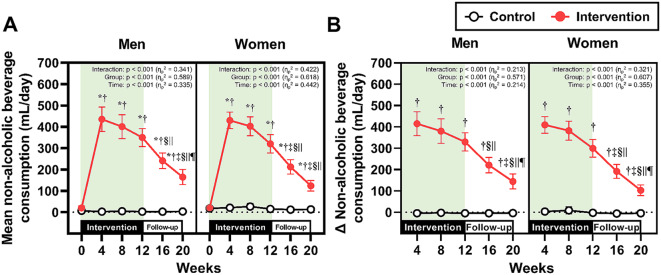
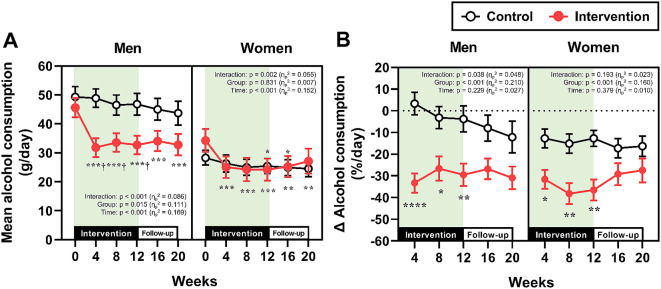
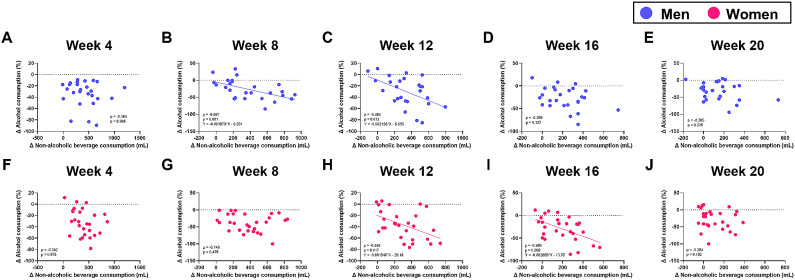
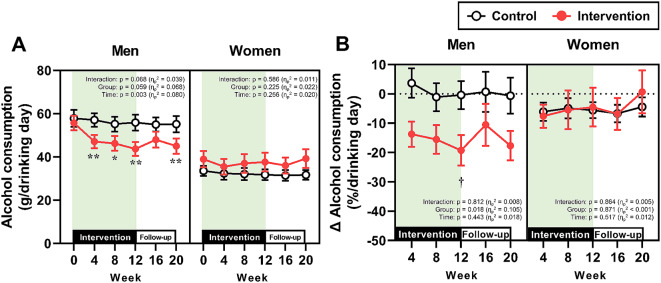
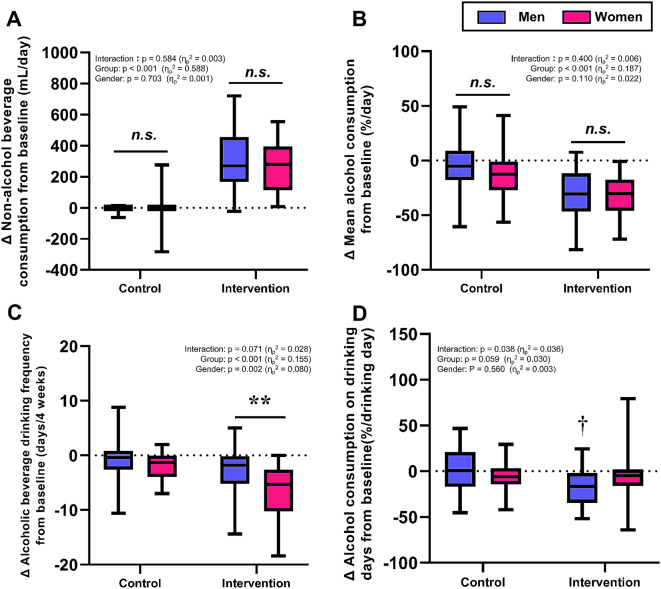
Results: The provision of non-alcoholic beverages significantly reduced alcohol consumption in both genders; however, significant differences in alcohol consumption between the control and intervention groups were observed only in men. The average alcohol consumption during the intervention fell below the level associated with a high risk of non-communicable diseases in men (32.7 g/day), but not in women (24.8 g/day). Correlation coefficient analysis showed that replacing alcoholic beverages with the provided non-alcoholic beverages resulted in different drinking patterns according to gender. The percent changes in the consumption of alcoholic and non-alcoholic beverages relative to baseline levels did not differ between genders.

Conclusions: Our results suggest that the provision of non-alcoholic beverages reduced alcohol consumption irrespective of gender. Of note, providing non-alcoholic beverages might be particularly useful for reducing high-risk alcohol consumption in male excessive drinkers.

Trial registration: UMIN UMIN000047949. Registered 4 June 2022.

Keywords: Alcohol drinking behavior; Non-alcoholic beverages; Reduced alcohol consumption; Sex difference.


Conflict of interest statement

H.Y. received research funding from Asahi Breweries.

Figures

Fig. 1
Fig. 1
Study flow diagram
Fig. 2
Fig. 2
Non-alcoholic beverage consumption. (A) Absolute values of mean non-alcoholic beverage consumption throughout the study period in men and women. (B) The changes in non-alcoholic beverage consumption from baseline (Week 0) in men and women. *p < 0.05 vs. Week 0, p < 0.05 vs. the control group at the same time point, p < 0.05 vs. Week 4, §p < 0.05 vs. Week 8, ||p < 0.05 vs. Week 12, and p < 0.05 vs. Week 16
Fig. 3
Fig. 3
Alcohol consumption. (A) Absolute values of mean alcohol consumption throughout the study period in men and women. ***p < 0.001, **p < 0.01, *p < 0.05 vs. Week 0 within the same group. p < 0.05 vs. the control group at the same time point. (B) The percent changes in alcohol consumption from baseline (Week 0) in men and women. ****p < 0.0001, **p < 0.01, *p < 0.05 vs. the control group at the same time point
Fig. 4
Fig. 4
Correlation between changes in alcohol consumption and non-alcoholic beverage consumption at Weeks 4, 8, 12, 16, and 20 in the intervention group. (A-E) Men (n = 26). (F-J) Women (n = 28)
Fig. 5
Fig. 5
Alcohol beverage drinking frequency. (A) Absolute values of mean alcoholic beverage drinking frequency throughout the study period in men and women. ***p < 0.001, **p < 0.01, *p < 0.05 vs. Week 0 within the same group. (B) The changes in alcoholic beverage drinking frequency from baseline (Week 0) in men and women. †††p < 0.001, ††p < 0.01, p < 0.05 vs. the control group at the same time point
Fig. 6
Fig. 6
Alcohol consumption on drinking days. (A) Absolute values of mean alcohol consumption on drinking days throughout the study period in men and women. **p < 0.01, *p < 0.05 vs. Week 0 within the same group. (B) The percent changes in alcoholic beverage drinking frequency from baseline (Week 0) in men and women. p < 0.05 vs. the control group at the same time point
Fig. 7
Fig. 7
Comparisons between men and women regarding changes from baseline in behaviors related to alcoholic and non-alcoholic beverages. (A) Mean non-alcohol beverage consumption, (B) Mean alcohol consumption, (C) Alcohol beverage drinking frequency, (D) Alcohol consumption on drinking day. Each box represents the interquartile range (IQR), with the lower edge of the box indicating the 25th percentile and the upper edge indicating the 75th percentile. The whiskers extend from the box to the minimum and maximum values. n.s., not significant. **p < 0.01. p < 0.05 vs. control in men

Similar articles

Cited by

References

    1. World Health Organization . Global status report on alcohol and health 2018. Geneva: World Health Organization; 2018.
    1. Zhao J, Stokwell T, Naimi T, Churchill S, Clay J, Sherk A. Association between daily alcohol intake and risk of all-cause mortality. JAMA Netw Open. 2023;6(3):e236185. doi: 10.1001/jamanetworkopen.2023.6185. - DOI - PMC - PubMed
    1. Nieto SJ, Grodin EN, Aguirre CG, Izqyuerdi A, Ray LA. Translational opportunities in animal and human modes to study alcohol use disorder. Transl Psychiatry. 2021;11(1):496. doi: 10.1038/s41398-021-01615-0. - DOI - PMC - PubMed
    1. Yoshimoto H, Kawaida K, Dobashi S, Saito G, Oowaki Y. Effect of provision of non-alcoholic beverages on alcohol consumption: a randomized controlled study. BMC Med. 2023;21:379. doi: 10.1186/s12916-023-03085-1. - DOI - PMC - PubMed
    1. Franzen M, SadiKaj G, Moskowitz DS, Ostafin BD, Aan het Rot M. Intra-and interindividual variability in the behavioral, affective, and perceptual effects of alcohol consumption in a social context. Alcohol Clin Exp Res. 2018;42:952–61. doi: 10.1111/acer.13624. - DOI - PMC - PubMed

Publication types